Elk Grove Village, IL (Illinois) Houses and Residents
Estimated median house or condo value in 2022: $333,110 (it was $181,700 in 2000 )
Elk Grove Village:
$333,110Illinois:
$251,600
Lower value quartile - upper value quartile: $263,579 - $401,200Total population: 33,379 (All urban)
Houses: 13,392 (12,745 occupied: 9,676 owner occupied, 3,285 renter occupied )
% of renters here:
25%State:
33%
Housing density: 1,213 houses/condos per square mile
Median price asked for vacant for-sale houses and condos in 2022: $862,452.
Median contract rent in 2022: $1,390 (lower quartile is $1,132, upper quartile is $1,752)
Median rent asked for vacant for-rent units in 2022: $2,474
Median gross rent in Elk Grove Village, IL in 2022: $1,533
Housing units in Elk Grove Village with a mortgage: 6,083 (468 second mortgage, 0 home equity loan, 364 both second mortgage and home equity loan )Houses without a mortgage: 241
Median household income for houses/condos with a mortgage: $123,852
Median household income for apartments without a mortgage: $90,536
Median monthly housing costs: $1,542
Data:
Median house or condo value ($)
Median house or condo value ($ change since 2000)
Median house or condo value ($) - White
Median house or condo value ($) - Black or African American
Median house or condo value ($) - Asian
Median house or condo value ($) - Hispanic or Latino
Median house or condo value ($) - American Indian and Alaska Native
Median house or condo value ($) - Multirace
Median house or condo value ($) - Other Race
Median price asked for mobile homes ($)
Household density (households per square mile)
Mean house or condo value by units in structure - 1, detached ($)
Mean house or condo value by units in structure - 1, attached ($)
Mean house or condo value by units in structure - 2 ($)
Mean house or condo value by units in structure by units in structure - 3 or 4 ($)
Mean house or condo value by units in structure - 5 or more ($)
Mean house or condo value by units in structure - Boat, RV, van, etc. ($)
Mean house or condo value by units in structure - Mobile home ($)
Median contract rent ($)
Median contract rent - Lower quartile ($)
Median contract rent - Upper quartile ($)
Median gross rent ($)
Urban houses (%)
Rural houses (%)
Houses occupied (%)
Houses occupied (% change since 2000)
Houses owner occupied (%)
Houses owner occupied (% change since 2000)
Houses renter occupied (%)
Houses renter occupied (% change since 2000)
Vacant housing units - For rent (%)
Vacant housing units - For rent (% change since 2000)
Vacant housing units - For sale only (%)
Vacant housing units - For sale only (% change since 2000)
Vacant housing units - Rented or sold, not occupied (%)
Vacant housing units - Rented or sold, not occupied (% change since 2000)
Vacant housing units - For seasonal, recreational, or occasional use (%)
Vacant housing units - For seasonal, recreational, or occasional use (% change since 2000)
Vacant housing units - For migrant workers (%)
Vacant housing units - For migrant workers (% change since 2000)
Vacant housing units - Other vacant (%)
Vacant housing units - Other vacant (% change since 2000)
Median monthly housing costs ($)
Median household income for houses/condos with a mortgage ($)
Median household income for houses/condos without a mortgage ($)
Median household income ($)
Median household income ($) - White
Median household income ($) - Black or African American
Median household income ($) - Asian
Median household income ($) - Hispanic or Latino
Median household income ($) - American Indian and Alaska Native
Median household income ($) - Multirace
Median household income ($) - Other Race
Mortgage status - with mortgage (%)
Mortgage status - with second mortgage (%)
Mortgage status - with home equity loan (%)
Mortgage status - with both second mortgage and home equity loan (%)
Mortgage status - without a mortgage (%)
Median year house/condo built
Median year apartment built
Household type by relationship - Male householder living alone (%)
Household type by relationship - Male householder not living alone (%)
Household type by relationship - Female householder living alone (%)
Household type by relationship - Female householder not living alone (%)
Household type by relationship - Opposite-Sex spouse (%)
Household type by relationship - Same-Sex spouse (%)
Household type by relationship - Opposite-Sex unmarried partner (%)
Household type by relationship - Same-Sex unmarried partner (%)
Household type by relationship - In group quarters (%)
Size of family households - 2-person household (%)
Size of family households - 3-person household (%)
Size of family households - 4-person household (%)
Size of family households - 5-person household (%)
Size of family households - 6-person household (%)
Size of family households - 7-or-more-person household (%)
Size of nonfamily households - 1-person household (%)
Size of nonfamily households - 2-person household (%)
Size of nonfamily households - 3-person household (%)
Size of nonfamily households - 4-person household (%)
Size of nonfamily households - 5-person household (%)
Size of nonfamily households - 6-person household (%)
Size of nonfamily households - 7-or-moreperson household (%)
Year house built - Built 2010 or later (%)
Year house built - Built 2000 to 2009 (%)
Year house built - Built 1990 to 1999 (%)
Year house built - Built 1980 to 1989 (%)
Year house built - Built 1970 to 1979 (%)
Year house built - Built 1960 to 1969 (%)
Year house built - Built 1950 to 1959 (%)
Year house built - Built 1940 to 1949 (%)
Year house built - Built 1939 or earlier (%)
Median number of rooms in houses and condos
Median number of rooms in apartments
Median number of bedrooms in owner occupied houses
Mean number of bedrooms in owner occupied houses
Median number of bedrooms in renter occupied houses
Mean number of bedrooms in renter occupied houses
Median number of vehichles in owner occupied houses
Mean number of vehichles in owner occupied houses
Median number of vehichles in renter occupied houses
Mean number of vehichles in renter occupied houses
Rooms in owner-occupied houses - 1 room (%)
Rooms in owner-occupied houses - 2 rooms (%)
Rooms in owner-occupied houses - 3 rooms (%)
Rooms in owner-occupied houses - 4 rooms (%)
Rooms in owner-occupied houses - 5 rooms (%)
Rooms in owner-occupied houses - 6 rooms (%)
Rooms in owner-occupied houses - 7 rooms (%)
Rooms in owner-occupied houses - 8 rooms (%)
Rooms in owner-occupied houses - 9+ rooms (%)
Rooms in renter-occupied houses - 1 room (%)
Rooms in renter-occupied houses - 2 rooms (%)
Rooms in renter-occupied houses - 3 rooms (%)
Rooms in renter-occupied houses - 4 rooms (%)
Rooms in renter-occupied houses - 5 rooms (%)
Rooms in renter-occupied houses - 6 rooms (%)
Rooms in renter-occupied houses - 7 rooms (%)
Rooms in renter-occupied houses - 8 rooms (%)
Rooms in renter-occupied houses - 9+ rooms (%)
Bedrooms in owner-occupied houses - no bedrooms (%)
Bedrooms in owner-occupied houses - 1 bedroom (%)
Bedrooms in owner-occupied houses - 2 bedrooms (%)
Bedrooms in owner-occupied houses - 3 bedrooms (%)
Bedrooms in owner-occupied houses - 4 bedrooms (%)
Bedrooms in owner-occupied houses - 5+ bedrooms (%)
Bedrooms in renter-occupied houses - no bedrooms (%)
Bedrooms in renter-occupied houses - 1 bedroom (%)
Bedrooms in renter-occupied houses - 2 bedrooms (%)
Bedrooms in renter-occupied houses - 3 bedrooms (%)
Bedrooms in renter-occupied houses - 4 bedrooms (%)
Bedrooms in renter-occupied houses - 5+ bedrooms (%)
Vehicles available in owner-occupied houses - no vehicle available (%)
Vehicles available in owner-occupied houses - 1 vehicle available(%)
Vehicles available in owner-occupied houses - 2 Vehicles available (%)
Vehicles available in owner-occupied houses - 3 Vehicles available (%)
Vehicles available in owner-occupied houses - 4 Vehicles available (%)
Vehicles available in owner-occupied houses - 5+ Vehicles available (%)
Vehicles available in renter-occupied houses - no vehicle available (%)
Vehicles available in renter-occupied houses - 1 vehicle available (%)
Vehicles available in renter-occupied houses - 2 Vehicles available (%)
Vehicles available in renter-occupied houses - 3 Vehicles available (%)
Vehicles available in renter-occupied houses - 4 Vehicles available (%)
Vehicles available in renter-occupied houses - 5+ Vehicles available (%)
Housing units in structures - 1, detached (%)
Housing units in structures - 1, attached (%)
Housing units in structures - 2 (%)
Housing units in structures - 3 or 4 (%)
Housing units in structures - 5 to 9 (%)
Housing units in structures - 10 to 19 (%)
Housing units in structures - 20 to 49 (%)
Housing units in structures - 50 or more (%)
Housing units in structures - Mobile home (%)
Housing units in structures - Boat, RV, van, etc. (%)
Housing units in structures - Owners - 1, detached (%)
Housing units in structures - Owners - 1, attached (%)
Housing units in structures - Owners - 2 (%)
Housing units in structures - Owners - 3 or 4 (%)
Housing units in structures - Owners - 5 to 9 (%)
Housing units in structures - Owners - 10 to 19 (%)
Housing units in structures - Owners - 20 to 49 (%)
Housing units in structures - Owners - 50 or more (%)
Housing units in structures - Owners - Mobile home (%)
Housing units in structures - Owners - Boat, RV, van, etc. (%)
Housing units in structures - Renters - 1, detached (%)
Housing units in structures - Renters - 1, attached (%)
Housing units in structures - Renters - 2 (%)
Housing units in structures - Renters - 3 or 4 (%)
Housing units in structures - Renters - 5 to 9 (%)
Housing units in structures - Renters - 10 to 19 (%)
Housing units in structures - Renters - 20 to 49 (%)
Housing units in structures - Renters - 50 or more (%)
Housing units in structures - Renters - Mobile home (%)
Housing units in structures - Renters - Boat, RV, van, etc. (%)
House/condo owner moved in on average (years ago)
Renter moved in on average (years ago)
Year householder moved into unit - Moved in 1999 to March 2000 (%)
Year householder moved into unit - Moved in 1999 to March 2000 (%) - White
Year householder moved into unit - Moved in 1999 to March 2000 (%) - Black or African American
Year householder moved into unit - Moved in 1999 to March 2000 (%) - Asian
Year householder moved into unit - Moved in 1999 to March 2000 (%) - Hispanic or Latino
Year householder moved into unit - Moved in 1999 to March 2000 (%) - American Indian and Alaska Native
Year householder moved into unit - Moved in 1999 to March 2000 (%) - Multirace
Year householder moved into unit - Moved in 1999 to March 2000 (%) - Other Race
Year householder moved into unit - Moved in 1995 to 1998 (%)
Year householder moved into unit - Moved in 1995 to 1998 (%) - White
Year householder moved into unit - Moved in 1995 to 1998 (%) - Black or African American
Year householder moved into unit - Moved in 1995 to 1998 (%) - Asian
Year householder moved into unit - Moved in 1995 to 1998 (%) - Hispanic or Latino
Year householder moved into unit - Moved in 1995 to 1998 (%) - American Indian and Alaska Native
Year householder moved into unit - Moved in 1995 to 1998 (%) - Multirace
Year householder moved into unit - Moved in 1995 to 1998 (%) - Other Race
Year householder moved into unit - Moved in 1990 to 1994 (%)
Year householder moved into unit - Moved in 1990 to 1994 (%) - White
Year householder moved into unit - Moved in 1990 to 1994 (%) - Black or African American
Year householder moved into unit - Moved in 1990 to 1994 (%) - Asian
Year householder moved into unit - Moved in 1990 to 1994 (%) - Hispanic or Latino
Year householder moved into unit - Moved in 1990 to 1994 (%) - American Indian and Alaska Native
Year householder moved into unit - Moved in 1990 to 1994 (%) - Multirace
Year householder moved into unit - Moved in 1990 to 1994 (%) - Other Race
Year householder moved into unit - Moved in 1980 to 1989 (%)
Year householder moved into unit - Moved in 1980 to 1989 (%) - White
Year householder moved into unit - Moved in 1980 to 1989 (%) - Black or African American
Year householder moved into unit - Moved in 1980 to 1989 (%) - Asian
Year householder moved into unit - Moved in 1980 to 1989 (%) - Hispanic or Latino
Year householder moved into unit - Moved in 1980 to 1989 (%) - American Indian and Alaska Native
Year householder moved into unit - Moved in 1980 to 1989 (%) - Multirace
Year householder moved into unit - Moved in 1980 to 1989 (%) - Other Race
Year householder moved into unit - Moved in 1970 to 1979 (%)
Year householder moved into unit - Moved in 1970 to 1979 (%) - White
Year householder moved into unit - Moved in 1970 to 1979 (%) - Black or African American
Year householder moved into unit - Moved in 1970 to 1979 (%) - Asian
Year householder moved into unit - Moved in 1970 to 1979 (%) - Hispanic or Latino
Year householder moved into unit - Moved in 1970 to 1979 (%) - American Indian and Alaska Native
Year householder moved into unit - Moved in 1970 to 1979 (%) - Multirace
Year householder moved into unit - Moved in 1970 to 1979 (%) - Other Race
Year householder moved into unit - Moved in 1969 or earlier (%)
Year householder moved into unit - Moved in 1969 or earlier (%) - White
Year householder moved into unit - Moved in 1969 or earlier (%) - Black or African American
Year householder moved into unit - Moved in 1969 or earlier (%) - Asian
Year householder moved into unit - Moved in 1969 or earlier (%) - Hispanic or Latino
Year householder moved into unit - Moved in 1969 or earlier (%) - American Indian and Alaska Native
Year householder moved into unit - Moved in 1969 or earlier (%) - Multirace
Year householder moved into unit - Moved in 1969 or earlier (%) - Other Race
Housing units lacking complete plumbing facilities (%)
Housing units lacking complete kitchen facilities (%)
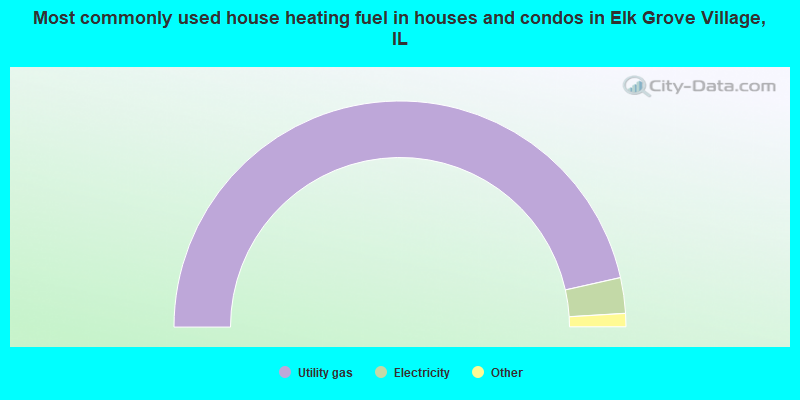
House heating fuel used in houses and condos - Utility gas (%)
House heating fuel used in houses and condos - Bottled, tank, or LP gas (%)
House heating fuel used in houses and condos - Electricity (%)
House heating fuel used in houses and condos - Fuel oil, kerosene, etc. (%)
House heating fuel used in houses and condos - Coal or coke (%)
House heating fuel used in houses and condos - Wood (%)
House heating fuel used in houses and condos - Solar energy (%)
House heating fuel used in houses and condos - Other fuel (%)
House heating fuel used in houses and condos - No fuel used (%)
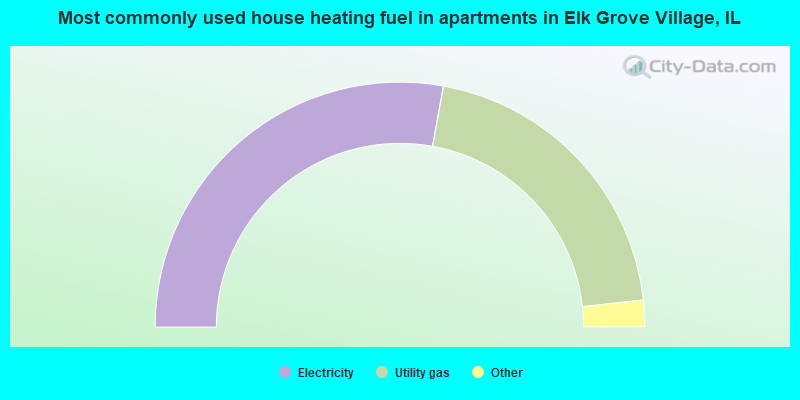
House heating fuel used in apartments - Utility gas (%)
House heating fuel used in apartments - Bottled, tank, or LP gas (%)
House heating fuel used in apartments - Electricity (%)
House heating fuel used in apartments - Fuel oil, kerosene, etc. (%)
House heating fuel used in apartments - Coal or coke (%)
House heating fuel used in apartments - Wood (%)
House heating fuel used in apartments - Solar energy (%)
House heating fuel used in apartments - Other fuel (%)
House heating fuel used in apartments - No fuel used (%)
Median year house/condo built: 1973Median year apartment built: 1978Household type by relationship:
Households: 31,776
Male householders: 5,980 (1,359 living alone ), Female householders: 6,428 (2,098 living alone )6,831 spouses (6,807 opposite-sex spouses ), 493 unmarried partners , (484 opposite-sex unmarried partners ), 9,657 children (9,223 natural , 277 adopted , 156 stepchildren ), 306 grandchildren , 287 brothers or sisters , 484 parents , 0 foster children , 559 other relatives , 507 non-relatives In group quarters: 238
Size of family households: 3,702 2-persons , 2,004 3-persons , 1,960 4-persons , 738 5-persons , 227 6-persons , 82 7-or-more-persons .
Size of nonfamily households: 3,714 1-person , 397 2-persons , 46 5-persons .
4,830 married couples with children. single-parent households (224 men , 1,101 women ).
67.4% of residents of Elk Grove Village speak English at home. of residents speak Spanish at home (76% speak English very well , 14% speak English well , 5% speak English not well , 4% don't speak English at all ).of residents speak other Indo-European language at home (65% speak English very well , 20% speak English well , 12% speak English not well , 3% don't speak English at all ).of residents speak Asian or Pacific Island language at home (73% speak English very well , 20% speak English well , 6% speak English not well , 1% don't speak English at all ).of residents speak other language at home (79% speak English very well , 21% speak English well ).
Foreign born population: 7,107 (22.4%)of them are naturalized citizens )
Median number of rooms in houses and condos:
Median number of rooms in apartments
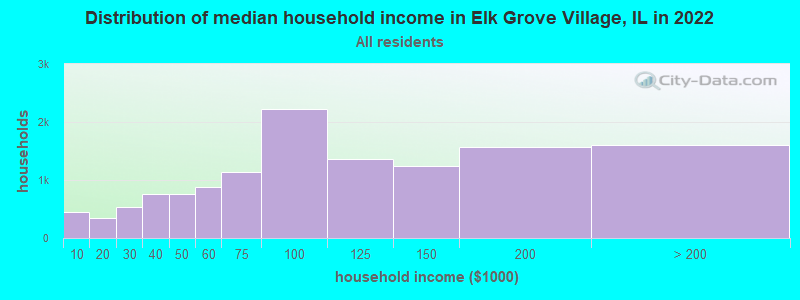
Elk Grove Village, IL household income distribution 442 Less than $10,000353 $10,000 to $19,999537 $20,000 to $29,999757 $30,000 to $39,999765 $40,000 to $49,999882 $50,000 to $59,9991,140 $60,000 to $74,9992,226 $75,000 to $99,9991,367 $100,000 to $124,9991,247 $125,000 to $149,9991,577 $150,000 to $199,9991,600 $200,000 or more
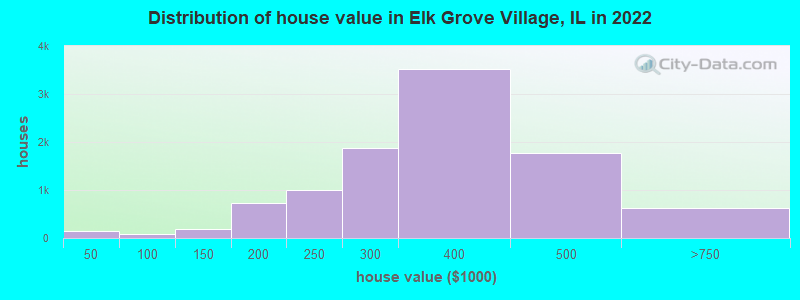
Home value of owner - occupied houses in 2022 in Elk Grove Village, IL 53 Less than $10,00020 $10,000 to $14,99913 $15,000 to $19,99914 $20,000 to $24,99915 $25,000 to $29,99913 $30,000 to $34,99925 $40,000 to $49,99946 $80,000 to $89,99914 $90,000 to $99,99970 $100,000 to $124,999124 $125,000 to $149,999325 $150,000 to $174,999401 $175,000 to $199,9991,005 $200,000 to $249,9991,873 $250,000 to $299,9993,518 $300,000 to $399,9991,765 $400,000 to $499,999614 $500,000 to $749,9998 $1,000,000 to $1,499,9999 $2,000,000 or moreRent paid by renters in 2022 in Elk Grove Village, IL 16 $400 to $44913 $500 to $54959 $750 to $79970 $800 to $899139 $900 to $999857 $1,000 to $1,249599 $1,250 to $1,4991,070 $1,500 to $1,999147 $2,000 to $2,499107 $2,500 to $2,999210 No cash rent
Percentage of workers working in this county: 74.7%Number of people working at home: 2,934 (17.2% of all workers )
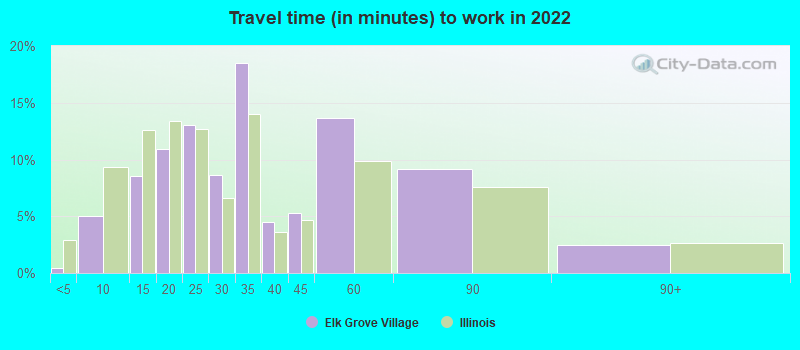
Travel time to work (commute)
Less than 5 minutes: 725 to 9 minutes: 1,65410 to 14 minutes: 2,31315 to 19 minutes: 2,13620 to 24 minutes: 1,57025 to 29 minutes: 1,18830 to 34 minutes: 1,82035 to 39 minutes: 32940 to 44 minutes: 66045 to 59 minutes: 1,22160 to 89 minutes: 99990 or more minutes: 271
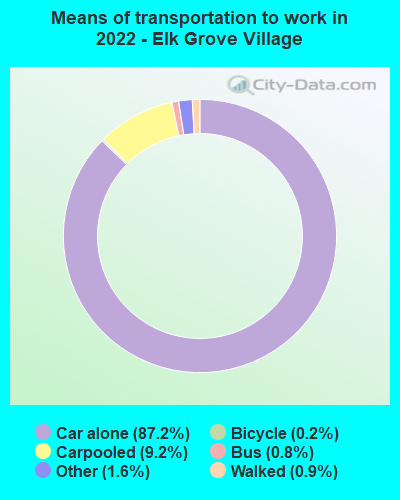
Means of transportation to work:
Drove a car alone: 37,436 (80.4%)Carpooled: 4,254 (9.1%)Bus : 318 (0.7%)Subway or elevated rail : 29 (0.1%)Long-distance train or commuter rail : 26 (0.1%)Taxi: 674 (1.4%)Bicycle: 75 (0.2%)Walked: 388 (0.8%)Worked at home: 2,934 (6.3%)
Unemployment by race in 2022
Unemployment rate for White non-Hispanic residents 3.4% Males2.6% FemalesUnemployment rate for Black residents 2.6% FemalesUnemployment rate for American Indian and Alaska Native residents 7.7% MalesUnemployment rate for Asian residents 2.7% Males1.0% FemalesUnemployment rate for other race residents 3.8% MalesUnemployment rate for two or more race residents 2.7% MalesUnemployment rate for Hispanic or Latino residents 7.9% Males3.2% Females
Year of entry for the foreign-born population in Elk Grove Village, Illinois
1,740 2010 or later 2,074 2000 to 2009 1,566 1990 to 1999 1,122 1980 to 1989 920 1970 to 1979 1,072 Before 1970
First ancestries reported:
Polish: 2,540 (14.7%)
German: 2,013 (11.6%)
Italian: 1,225 (7.1%)
Irish: 1,013 (5.8%)
Bulgarian: 654 (3.8%)
American: 409 (2.4%)
European: 391 (2.3%)
Romanian: 291 (1.7%)
Serbian: 284 (1.6%)
Ukrainian: 251 (1.4%)
Croatian: 211 (1.2%)
Lebanese: 189 (1.1%)
English: 151 (0.9%)
Norwegian: 119 (0.7%)
Iranian: 118 (0.7%)
Swedish: 116 (0.7%)
Slavic: 108 (0.6%)
Greek: 102 (0.6%)
Albanian: 95 (0.5%)
Palestinian: 95 (0.5%)
Russian: 74 (0.4%)
Czech: 70 (0.4%)
French: 67 (0.4%)
Yugoslavian: 67 (0.4%)
African: 59 (0.3%)
Dutch: 54 (0.3%)
Scotch-Irish: 33 (0.2%)
Turkish: 33 (0.2%)
Czechoslovakian: 30 (0.2%)
Haitian: 24 (0.1%)
Belizean: 23 (0.1%)
British: 20 (0.1%)
Lithuanian: 18 (0.1%)
Slovak: 18 (0.1%)
Eastern European: 17 (0.10%)
Assyrian: 17 (0.10%)
Armenian: 16 (0.09%)
Canadian: 15 (0.09%)
Scottish: 13 (0.08%)
Hungarian: 12 (0.07%)
Latvian: 12 (0.07%)
French Canadian: 11 (0.06%)
Danish: 9 (0.05%)
Slovene: 8 (0.05%)
Welsh: 8 (0.05%) Most common places of birth for foreign-born residents (%): India Elk Grove Village:
15.9% (1,127)Illinois:
9.2% (166,409)
Poland Elk Grove Village:
15.8% (1,126)Illinois:
6.9% (124,474)
Mexico Elk Grove Village:
14.3% (1,015)Illinois:
34.7% (626,958)
Bulgaria Elk Grove Village:
10.4% (736)Illinois:
0.8% (14,165)
Philippines Elk Grove Village:
9.3% (659)Illinois:
5.2% (93,003)
Colombia Elk Grove Village:
3.9% (274)Illinois:
0.9% (16,553)
Korea Elk Grove Village:
3.2% (226)Illinois:
2.2% (40,393)
China, excluding Hong Kong and Taiwan Elk Grove Village:
2.1% (146)Illinois:
4.1% (74,364)
Japan Elk Grove Village:
2.0% (144)Illinois:
0.6% (10,943)
Ukraine Elk Grove Village:
2.0% (139)Illinois:
1.6% (29,316)
Italy Elk Grove Village:
1.9% (136)Illinois:
0.9% (15,679)
Croatia Elk Grove Village:
1.9% (134)Illinois:
0.2% (3,977)
Romania Elk Grove Village:
1.7% (122)Illinois:
0.8% (14,736)
Iran Elk Grove Village:
1.6% (117)Illinois:
0.4% (6,922)
Place of birth for U.S.-born residents:
This state: 21,881Other state: 2,275Northeast: 447Midwest: 1,027South: 570West: 245 89.8% of Elk Grove Village residents lived in the same house 1 years ago.
Out of people who lived in different houses, 43.5% lived in this county.
Out of people who lived in different counties, 84.2% lived in Illinois.
Elk Grove Village:
89.8%State average:
88.3%
Education attainment for males 25 years and older:
No schooling: 250Nursery to 4th grade: 655th and 6th grade: 177th and 8th grade: 1129th grade: 710th grade: 7611th grade: 18412th grade, no diploma: 65High school graduate (or equivalency): 2,328Less than 1 year of college: 787Some college more than 1 year, no degree: 1,411Associate degree: 1,045Bachelor's degree: 3,219Master's degree: 885Professional school degree: 135Doctorate degree: 165
Education attainment for females 25 years and older:
No schooling: 143Nursery to 4th grade: 105th and 6th grade: 847th and 8th grade: 519th grade: 2710th grade: 5611th grade: 6712th grade, no diploma: 220High school graduate (or equivalency): 2,776Less than 1 year of college: 945Some college more than 1 year, no degree: 1,616Associate degree: 1,028Bachelor's degree: 3,275Master's degree: 1,590Professional school degree: 126Doctorate degree: 64
Housing units in structures:
One, detached: 7,682One, attached: 1,750Two: 353 or 4: 4465 to 9: 52110 to 19: 78020 to 49: 1,06150 or more: 1,038Mobile homes: 76Housing units lacking complete plumbing facilities in 2022: 0.3%Housing units lacking complete kitchen facilities in 2022: 1.1%House/condo owner moved in on average 17 years ago
Renter moved in on average 3 years ago
Private vs. public school enrollment:
Students in private schools in grades 1 to 8 (elementary and middle school): 119 Students in private schools in grades 9 to 12 (high school): 44 Students in private undergraduate colleges: 191