Elizabethtown, PA (Pennsylvania) Houses and Residents
| Elizabethtown: | $239,805 |
| Pennsylvania: | $245,500 |
Mean price in 2022:
Detached houses: $267,357
Here: $267,357 State: $317,202 Townhouses or other attached units: $174,781
Here: $174,781 State: $254,369 In 5-or-more-unit structures: $30,138
Here: $30,138 State: $320,068
Total population: 11,611 (All urban)
Houses: 4,850 (4,758 occupied: 2,558 owner occupied, 2,215 renter occupied)
| % of renters here: | 46% |
| State: | 31% |
Housing density: 1,864 houses/condos per square mile
Median price asked for vacant for-sale houses and condos in 2022 in this county: $323,895.
Median contract rent in 2022: $916 (lower quartile is $756, upper quartile is $1,206)
Median rent asked for vacant for-rent units in 2022: $7,055
Median gross rent in Elizabethtown, PA in 2022: $1,054
Housing units in Elizabethtown with a mortgage: 1,776 (250 second mortgage, 0 home equity loan, 260 both second mortgage and home equity loan)
Houses without a mortgage: 212
Median household income for houses/condos with a mortgage: $97,141
Median household income for apartments without a mortgage: $89,732
Median monthly housing costs: $1,141
Compare current foreclosures in Elizabethtown, PA:
| Photo | Address | Area | Beds / Baths | Price | Details |
|---|---|---|---|---|---|

|
#1
E High St
Elizabethtown, PA 17022
|
1,270 sq. feet
|
1 baths 3 beds |
show details | |

|
#2
N Market St
Elizabethtown, PA 17022
|
1,656 sq. feet
|
1 baths 3 beds |
show details | |

|
#3
Hill Rd
Elizabethtown, PA 17022
|
1,224 sq. feet
|
1 baths 3 beds |
show details | |

|
#4
London Ave
Elizabethtown, PA 17022
|
984 sq. feet
|
1 baths 3 beds |
show details | |

|
#5
High St
Elizabethtown, PA 17022
|
1,657 sq. feet
|
1 baths 3 beds |
show details | |

|
#6
Bossler Rd
Elizabethtown, PA 17022
|
1,680 sq. feet
|
2 baths 3 beds |
show details | |

|
#7
W High St
Elizabethtown, PA 17022
|
2,394 sq. feet
|
2 baths 4 beds |
show details | |

|
#8
Old Hershey Rd
Elizabethtown, PA 17022
|
1,200 sq. feet
|
1 baths 3 beds |
show details | |

|
#9
Groff Ave
Elizabethtown, PA 17022
|
1,384 sq. feet
|
1 baths 4 beds |
show details | |

|
#10
E Washington St
Elizabethtown, PA 17022
|
1,407 sq. feet
|
1 baths 3 beds |
show details |
| Photo | Address | Area | Beds / Baths | Price | Details |
|---|---|---|---|---|---|

|
#11
Trail Rd N
Elizabethtown, PA 17022
|
2,408 sq. feet
|
1 baths 2 beds |
show details | |

|
#12
Elizabethtown Rd
Elizabethtown, PA 17022
|
2,556 sq. feet
|
2 baths 4 beds |
show details | |

|
#13
Stonemill Dr
Elizabethtown, PA 17022
|
1,662 sq. feet
|
1 baths 3 beds |
show details | |

|
#14
Decatur St
Elizabethtown, PA 17022
|
1,137 sq. feet
|
1 baths 3 beds |
show details | |

|
#15
W High St
Elizabethtown, PA 17022
|
1,788 sq. feet
|
1 baths 3 beds |
show details | |

|
#16
Turnpike Rd
Elizabethtown, PA 17022
|
1,857 sq. feet
|
1 baths 3 beds |
show details | |

|
#17
College Ave
Elizabethtown, PA 17022
|
1,388 sq. feet
|
1 baths 3 beds |
show details | |

|
#18
Aberdeen Rd
Elizabethtown, PA 17022
|
3,528 sq. feet
|
4 baths 4 beds |
show details | |

|
#19
Colebrook Rd
Elizabethtown, PA 17022
|
1,716 sq. feet
|
1 baths 3 beds |
show details | |

|
#20
Stonemill Dr
Elizabethtown, PA 17022
|
1,604 sq. feet
|
1 baths 3 beds |
show details |
| Photo | Address | Area | Beds / Baths | Price | Details |
|---|---|---|---|---|---|

|
#21
Monument Dr
Elizabethtown, PA 17022
|
- sq. feet
|
- baths - beds |
show details | |

|
#22
Mapledale Rd
Elizabethtown, PA 17022
|
- sq. feet
|
- baths - beds |
show details | |

|
#23
Oak Knoll Est
Elizabethtown, PA 17022
|
- sq. feet
|
- baths - beds |
show details | |

|
#24
Schwanger Rd Apt 2
Elizabethtown, PA 17022
|
- sq. feet
|
- baths - beds |
show details | |

|
#25
Greider Ave
Elizabethtown, PA 17022
|
- sq. feet
|
- baths - beds |
show details | |

|
#26
Roush Rd
Elizabethtown, PA 17022
|
- sq. feet
|
- baths - beds |
show details | |

|
#27
Oak Knoll Est
Elizabethtown, PA 17022
|
- sq. feet
|
- baths - beds |
show details | |

|
#28
Hitz Ln
Elizabethtown, PA 17022
|
- sq. feet
|
- baths - beds |
show details | |

|
#29
Old Elizabethtown Rd
Elizabethtown, PA 17022
|
- sq. feet
|
- baths - beds |
show details | |

|
Check over 1 million property listings on Foreclosure.com!
|
browse all offers | |||

Latest news about housing in Elizabethtown, PA collected exclusively by city-data.com from local newspapers, TV, and radio stations

 | Art House Movie Theaters (7 replies) |
| Looking to relocate - mobile/manufactured home? (18 replies) |
| Which metro area to move to in PA? (51 replies) |
| Aspen Hill vs Spring Valley Apartments (1 reply) |
| Is Pennsylvania going to be the new Florida? (101 replies) |
| City/area suggestions? (15 replies) |

Median year apartment built: 1964
Household type by relationship:
Households: 11,878- Male householders: 2,186 (657 living alone), Female householders: 2,548 (907 living alone)
2,303 spouses (2,283 opposite-sex spouses), 270 unmarried partners, (242 opposite-sex unmarried partners), 2,464 children (2,332 natural, 112 adopted, 19 stepchildren), 48 grandchildren, 15 brothers or sisters, 68 parents, 20 foster children, 13 other relatives, 240 non-relatives
- In group quarters: 1,699
Size of family households: 1,309 2-persons, 620 3-persons, 573 4-persons, 205 5-persons, 10 6-persons.
Size of nonfamily households: 1,627 1-person, 387 2-persons, 21 3-persons.
1,451 married couples with children.
470 single-parent households (135 men, 335 women).
93.4% of residents of Elizabethtown speak English at home.
1.9% of residents speak Spanish at home (64% speak English very well, 15% speak English well, 21% speak English not well).
1.3% of residents speak other Indo-European language at home (84% speak English very well, 16% speak English well).
0.9% of residents speak Asian or Pacific Island language at home (57% speak English very well, 43% speak English well).
1.9% of residents speak other language at home (64% speak English very well, 36% speak English well).
Foreign born population: 642 (5.4%)
(38.9% of them are naturalized citizens)
| Here: | 6.6 |
| State: | 6.8 |
| Here: | 4.1 |
| State: | 4.3 |

- Bedrooms in owner-occupied houses and condos in Elizabethtown, Pennsylvania
- 0no bedroom
- 91 bedroom
- 3532 bedrooms
- 1,6333 bedrooms
- 4454 bedrooms
- 1185+ bedrooms

- Bedrooms in renter-occupied apartments in Elizabethtown, Pennsylvania
- 46no bedroom
- 6211 bedroom
- 1,1352 bedrooms
- 4143 bedrooms
- 04 bedrooms
- 05+ bedrooms

- Cars and other vehicles available in Elizabethtown in owner-occupied houses/condos
- 76no vehicle
- 5731 vehicle
- 1,3472 vehicles
- 4133 vehicles
- 1294 vehicles
- 205+ vehicles

- Cars and other vehicles available in Elizabethtown in renter-occupied apartments
- 179no vehicle
- 1,1261 vehicle
- 8982 vehicles
- 73 vehicles
- 64 vehicles
- 05+ vehicles

- Rooms in owner-occupied houses in Elizabethtown, Pennsylvania
- 01 room
- 02 rooms
- 93 rooms
- 2174 rooms
- 4445 rooms
- 6106 rooms
- 3757 rooms
- 5538 rooms
- 3509+ rooms

- Rooms in renter-occupied apartments in Elizabethtown, Pennsylvania
- 461 room
- 392 rooms
- 4063 rooms
- 8764 rooms
- 4835 rooms
- 1946 rooms
- 1537 rooms
- 208 rooms
- 09+ rooms


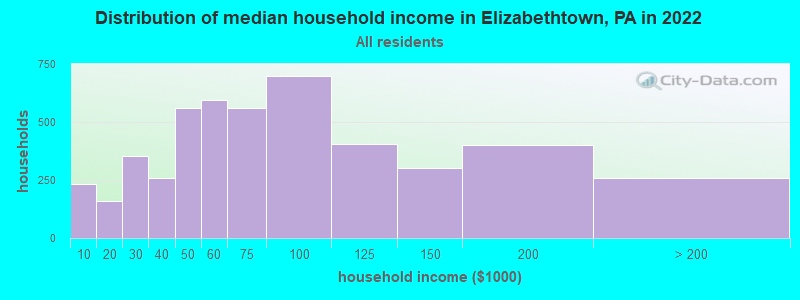
Elizabethtown, PA household income distribution

- 232Less than $10,000
- 158$10,000 to $19,999
- 355$20,000 to $29,999
- 257$30,000 to $39,999
- 561$40,000 to $49,999
- 593$50,000 to $59,999
- 562$60,000 to $74,999
- 700$75,000 to $99,999
- 404$100,000 to $124,999
- 300$125,000 to $149,999
- 400$150,000 to $199,999
- 259$200,000 or more
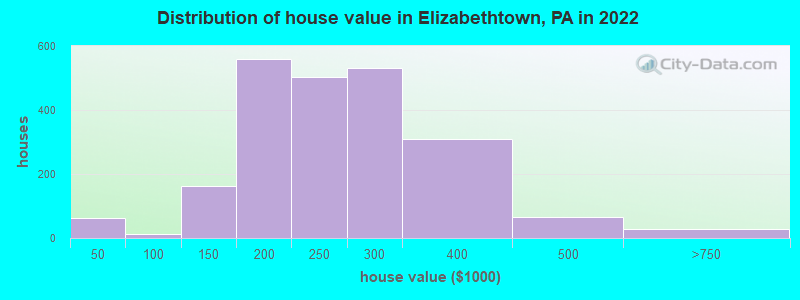
Home value of owner - occupied houses in 2022 in Elizabethtown, PA
-
- 60Less than $10,000
- 10$80,000 to $89,999
- 2$90,000 to $99,999
- 9$100,000 to $124,999
- 152$125,000 to $149,999
- 349$150,000 to $174,999
- 210$175,000 to $199,999
- 502$200,000 to $249,999
- 529$250,000 to $299,999
- 310$300,000 to $399,999
- 64$400,000 to $499,999
- 28$500,000 to $749,999
Rent paid by renters in 2022 in Elizabethtown, PA
-
- 23$150 to $199
- 42$200 to $249
- 21$250 to $299
- 32$350 to $399
- 18$450 to $499
- 208$500 to $549
- 52$600 to $649
- 65$650 to $699
- 135$700 to $749
- 107$750 to $799
- 433$800 to $899
- 227$900 to $999
- 338$1,000 to $1,249
- 288$1,250 to $1,499
- 48$1,500 to $1,999
- 69$2,000 to $2,499
- 7$2,500 to $2,999
- 64$3,000 to $3,499
- 62No cash rent


Percentage of workers working in this county: 69.6%
Number of people working at home: 536 (8.8% of all workers)
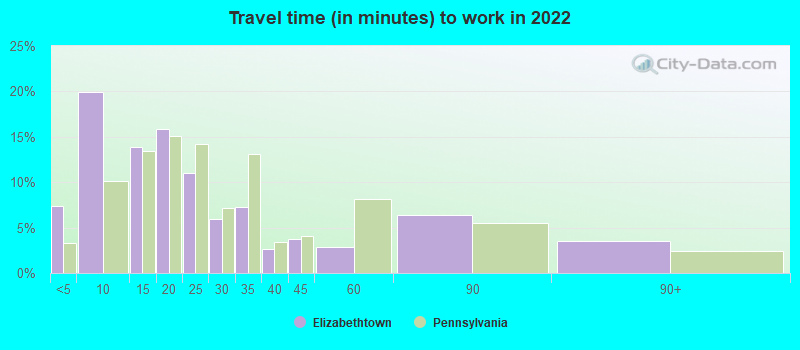
Travel time to work (commute)
- Less than 5 minutes: 457
- 5 to 9 minutes: 841
- 10 to 14 minutes: 533
- 15 to 19 minutes: 544
- 20 to 24 minutes: 930
- 25 to 29 minutes: 496
- 30 to 34 minutes: 966
- 35 to 39 minutes: 127
- 40 to 44 minutes: 166
- 45 to 59 minutes: 304
- 60 to 89 minutes: 53
- 90 or more minutes: 103
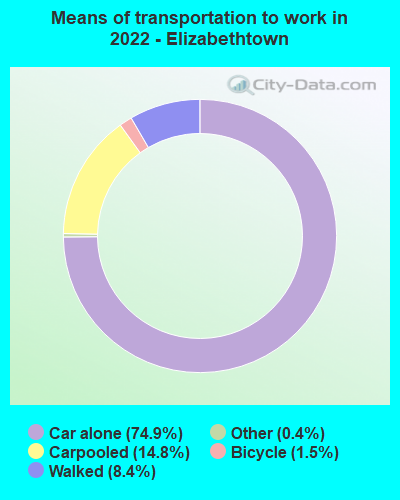
Means of transportation to work:
- Drove a car alone: 4,718 (68.0%)
- Carpooled: 919 (13.2%)
- Taxi: 35 (0.5%)
- Bicycle: 109 (1.6%)
- Walked: 627 (9.0%)
- Worked at home: 536 (7.7%)

- Unemployment by race in 2022
- Unemployment rate for White non-Hispanic residents
- 1.1%Males
- 5.3%Females
- Unemployment rate for Black residents
- 6.0%Females
- Unemployment rate for Hispanic or Latino residents
- 2.5%Females

- Year of entry for the foreign-born population in Elizabethtown, Pennsylvania
- 3312010 or later
- 2122000 to 2009
- 241990 to 1999
- 1011980 to 1989
- 651970 to 1979
- 74Before 1970
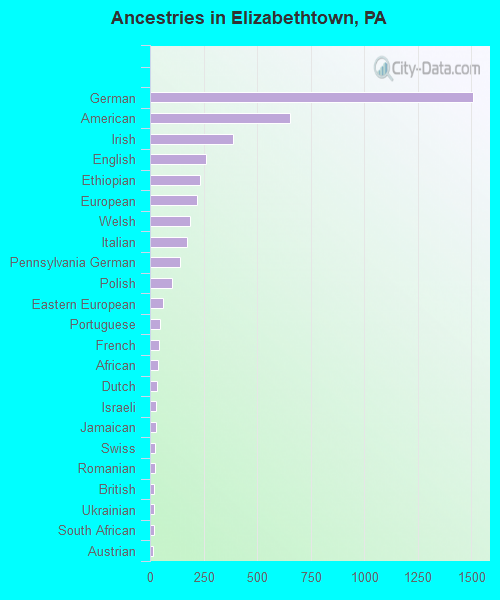
First ancestries reported:
- German: 1,507 (29.7%)
- American: 654 (12.9%)
- Irish: 387 (7.6%)
- English: 263 (5.2%)
- Ethiopian: 232 (4.6%)
- European: 218 (4.3%)
- Welsh: 186 (3.7%)
- Italian: 173 (3.4%)
- Pennsylvania German: 140 (2.8%)
- Polish: 103 (2.0%)
- Eastern European: 63 (1.2%)
- Portuguese: 46 (0.9%)
- French: 44 (0.9%)
- African: 36 (0.7%)
- Dutch: 35 (0.7%)
- Israeli: 27 (0.5%)
- Jamaican: 26 (0.5%)
- Swiss: 23 (0.5%)
- Romanian: 22 (0.4%)
- British: 20 (0.4%)
- Ukrainian: 19 (0.4%)
- South African: 18 (0.4%)
- Austrian: 16 (0.3%)
- Norwegian: 11 (0.2%)
- French Canadian: 8 (0.2%)
- Macedonian: 8 (0.2%)
- Croatian: 2 (0.04%)
Most common places of birth for foreign-born residents (%):
| Elizabethtown: | 24.3% (191) |
| Pennsylvania: | 1.1% (10,331) |
| Elizabethtown: | 23.8% (187) |
| Pennsylvania: | 0.5% (4,658) |
| Elizabethtown: | 10.7% (84) |
| Pennsylvania: | 7.2% (67,704) |
| Elizabethtown: | 8.6% (68) |
| Pennsylvania: | 0.5% (4,946) |
| Elizabethtown: | 7.4% (58) |
| Pennsylvania: | 10.7% (100,596) |
| Elizabethtown: | 5.3% (42) |
| Pennsylvania: | 0.4% (3,416) |
| Elizabethtown: | 3.3% (26) |
| Pennsylvania: | 0.9% (8,463) |
| Elizabethtown: | 3.2% (25) |
| Pennsylvania: | 1.2% (11,211) |
| Elizabethtown: | 3.0% (24) |
| Pennsylvania: | 2.4% (22,612) |
| Elizabethtown: | 1.8% (14) |
| Pennsylvania: | 5.8% (54,190) |
| Elizabethtown: | 1.5% (12) |
| Pennsylvania: | 1.0% (9,386) |
| Elizabethtown: | 1.5% (12) |
| Pennsylvania: | 0.3% (3,273) |
Place of birth for U.S.-born residents:
- This state: 8,763
- Other state: 2,488
- Northeast: 701
- Midwest: 492
- South: 855
- West: 405
87.4% of Elizabethtown residents lived in the same house 1 years ago.
Out of people who lived in different houses, 29.6% lived in this county.
Out of people who lived in different counties, 67.0% lived in Pennsylvania.
| Elizabethtown: | 87.4% |
| State average: | 89.3% |
Education attainment for males 25 years and older:
- No schooling: 84
- Nursery to 4th grade: 0
- 5th and 6th grade: 0
- 7th and 8th grade: 70
- 9th grade: 17
- 10th grade: 38
- 11th grade: 36
- 12th grade, no diploma: 0
- High school graduate (or equivalency): 1,352
- Less than 1 year of college: 205
- Some college more than 1 year, no degree: 332
- Associate degree: 387
- Bachelor's degree: 567
- Master's degree: 391
- Professional school degree: 40
- Doctorate degree: 85

Education attainment for females 25 years and older:
- No schooling: 55
- Nursery to 4th grade: 30
- 5th and 6th grade: 0
- 7th and 8th grade: 10
- 9th grade: 95
- 10th grade: 28
- 11th grade: 33
- 12th grade, no diploma: 16
- High school graduate (or equivalency): 1,304
- Less than 1 year of college: 202
- Some college more than 1 year, no degree: 335
- Associate degree: 397
- Bachelor's degree: 1,000
- Master's degree: 315
- Professional school degree: 43
- Doctorate degree: 98


Housing units in structures:
- One, detached: 1,930
- One, attached: 984
- Two: 238
- 3 or 4: 351
- 5 to 9: 718
- 10 to 19: 148
- 20 to 49: 197
- 50 or more: 280
Housing units lacking complete kitchen facilities in 2022: 2.2%
House/condo owner moved in on average 13 years ago
Renter moved in on average 5 years ago

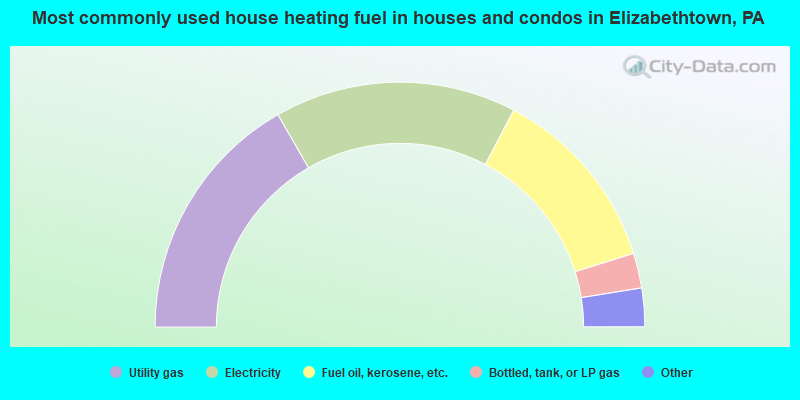
- 33.4%Utility gas
- 32.0%Electricity
- 24.9%Fuel oil, kerosene, etc.
- 4.6%Bottled, tank, or LP gas
- 2.0%Wood
- 1.5%Coal or coke
- 1.1%Other fuel
- 0.5%Solar energy
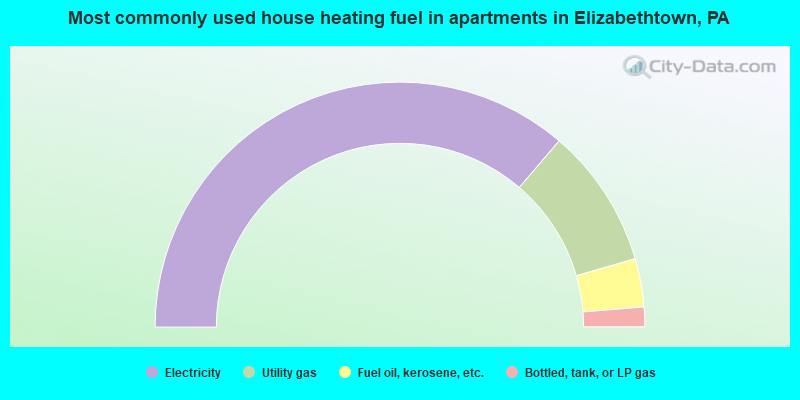
- 72.6%Electricity
- 18.5%Utility gas
- 6.4%Fuel oil, kerosene, etc.
- 2.6%Bottled, tank, or LP gas
Private vs. public school enrollment:
| Here: | 8.9% |
| Pennsylvania: | 15.7% |
| Here: | 8.2% |
| Pennsylvania: | 13.4% |
| Here: | 65.8% |
| Pennsylvania: | 39.8% |


