Elizabeth City, NC (North Carolina) Houses and Residents
| Elizabeth City: | $198,415 |
| North Carolina: | $280,600 |
Total population: 18,047 (Urban population: 17,212 (all inside urban clusters), Rural population: 73 (all nonfarm))
Houses: 8,578 (7,331 occupied: 3,185 owner occupied, 4,252 renter occupied)
| % of renters here: | 57% |
| State: | 33% |
Housing density: 960 houses/condos per square mile
Median price asked for vacant for-sale houses and condos in 2022: $168,436.
Median contract rent in 2022: $870 (lower quartile is $590, upper quartile is $1,170)
Median rent asked for vacant for-rent units in 2022: $824
Median gross rent in Elizabeth City, NC in 2022: $1,070
Housing units in Elizabeth City with a mortgage: 1,951 (147 second mortgage, 5 home equity loan, 116 both second mortgage and home equity loan)
Houses without a mortgage: 91
Median household income for houses/condos with a mortgage: $87,019
Median household income for apartments without a mortgage: $50,976
Median monthly housing costs: $1,030
Compare current foreclosures in Elizabeth City, NC:
| Photo | Address | Area | Beds / Baths | Price | Details |
|---|---|---|---|---|---|

|
#1
Crystal Lake Dr
Elizabeth City, NC 27909
|
1,769 sq. feet
|
2 baths 3 beds |
show details | |

|
#2
Golfclub Dr
Elizabeth City, NC 27909
|
2,264 sq. feet
|
2 baths 3 beds |
show details | |

|
#3
Lisas Way
Elizabeth City, NC 27909
|
2,052 sq. feet
|
2 baths 4 beds |
show details | |

|
#4
Majesty Ct
Elizabeth City, NC 27909
|
2,204 sq. feet
|
3 baths 4 beds |
show details | |

|
#5
Horseshoe Rd
Elizabeth City, NC 27909
|
- sq. feet
|
1 baths 3 beds |
show details | |

|
#6
Harrell St
Elizabeth City, NC 27909
|
- sq. feet
|
1 baths 2 beds |
show details | |

|
#7
Halls Creek Rd
Elizabeth City, NC 27909
|
3,104 sq. feet
|
- baths 3 beds |
show details | |

|
#8
Pelican Pointe Dr
Elizabeth City, NC 27909
|
- sq. feet
|
- baths - beds |
show details | |

|
#9
Union St
Elizabeth City, NC 27909
|
- sq. feet
|
- baths - beds |
show details | |

|
#10
Walker Ave Apt 95
Elizabeth City, NC 27909
|
- sq. feet
|
- baths - beds |
show details |
| Photo | Address | Area | Beds / Baths | Price | Details |
|---|---|---|---|---|---|

|
#11
Cedar St
Elizabeth City, NC 27909
|
- sq. feet
|
- baths - beds |
show details | |

|
#12
Lambs Grove Rd
Elizabeth City, NC 27909
|
- sq. feet
|
- baths - beds |
show details | |

|
#13
Halls Creek Rd
Elizabeth City, NC 27909
|
- sq. feet
|
- baths - beds |
show details | |

|
#14
Simpson Ditch Rd
Elizabeth City, NC 27909
|
- sq. feet
|
- baths - beds |
show details | |

|
#15
Zack Cir
Elizabeth City, NC 27909
|
- sq. feet
|
- baths - beds |
show details | |

|
#16
Copeland Dr
Elizabeth City, NC 27909
|
- sq. feet
|
- baths - beds |
show details | |

|
#17
Aydlett Dr
Elizabeth City, NC 27909
|
- sq. feet
|
- baths - beds |
show details | |

|
#18
Okisko Rd
Elizabeth City, NC 27909
|
- sq. feet
|
- baths - beds |
show details | |

|
#19
Roscoe Dr
Elizabeth City, NC 27909
|
- sq. feet
|
- baths - beds |
show details | |

|
#20
Forrest Skipper Dr
Elizabeth City, NC 27909
|
- sq. feet
|
- baths - beds |
show details |
| Photo | Address | Area | Beds / Baths | Price | Details |
|---|---|---|---|---|---|

|
#21
Emerald Lake Cir # 103
Elizabeth City, NC 27909
|
- sq. feet
|
- baths - beds |
show details | |

|
#22
Millbrooke Cir
Elizabeth City, NC 27909
|
- sq. feet
|
- baths - beds |
show details | |

|
#23
Union St
Elizabeth City, NC 27909
|
- sq. feet
|
- baths - beds |
show details | |

|
#24
Foreman Bundy Rd
Elizabeth City, NC 27909
|
- sq. feet
|
- baths - beds |
show details | |

|
#25
Cameron Dr Apt 101
Elizabeth City, NC 27909
|
- sq. feet
|
- baths - beds |
show details | |

|
#26
Kingswood Blvd
Elizabeth City, NC 27909
|
- sq. feet
|
- baths - beds |
show details | |

|
#27
Mosley St
Elizabeth City, NC 27909
|
- sq. feet
|
- baths - beds |
show details | |

|
#28
Union St
Elizabeth City, NC 27909
|
- sq. feet
|
- baths - beds |
show details | |

|
#29
Queen St
Elizabeth City, NC 27909
|
- sq. feet
|
- baths - beds |
show details | |

|
#30
Grandview Dr
Elizabeth City, NC 27909
|
- sq. feet
|
- baths - beds |
show details |
| Photo | Address | Area | Beds / Baths | Price | Details |
|---|---|---|---|---|---|

|
#31
Oak Stump Rd
Elizabeth City, NC 27909
|
- sq. feet
|
- baths - beds |
show details | |

|
#32
Northside Rd
Elizabeth City, NC 27909
|
- sq. feet
|
- baths - beds |
show details | |

|
#33
Horseshoe Rd
Elizabeth City, NC 27909
|
- sq. feet
|
- baths - beds |
show details | |

|
#34
Harney St
Elizabeth City, NC 27909
|
- sq. feet
|
- baths - beds |
show details | |

|
#35
Planters Run
Elizabeth City, NC 27909
|
- sq. feet
|
- baths - beds |
show details | |

|
#36
W Church St
Elizabeth City, NC 27909
|
- sq. feet
|
- baths - beds |
show details | |

|
#37
Simpson Ditch Rd
Elizabeth City, NC 27909
|
- sq. feet
|
- baths - beds |
show details | |

|
#38
Birdie Ln
Elizabeth City, NC 27909
|
- sq. feet
|
- baths - beds |
show details | |

|
#39
Madeline Ln
Elizabeth City, NC 27909
|
- sq. feet
|
- baths - beds |
show details | |

|
#40
Sutton Dr
Elizabeth City, NC 27909
|
- sq. feet
|
- baths - beds |
show details |
| Photo | Address | Area | Beds / Baths | Price | Details |
|---|---|---|---|---|---|

|
#41
Horseshoe Rd
Elizabeth City, NC 27909
|
- sq. feet
|
- baths - beds |
show details | |

|
#42
Hunnicutt Ave
Elizabeth City, NC 27909
|
- sq. feet
|
- baths - beds |
show details | |

|
#43
Turnpike Rd
Elizabeth City, NC 27909
|
- sq. feet
|
- baths - beds |
show details | |

|
#44
Okisko Rd
Elizabeth City, NC 27909
|
- sq. feet
|
- baths - beds |
show details | |

|
Check over 1 million property listings on Foreclosure.com!
|
browse all offers | |||


 | Old or Historic Homes in Hertford town, not county (1 reply) |
| The City of Elizabeth City Electric Department (2 replies) |
| Job offer in Elizabeth City, NC but think living in Chesepeake or Virginia Beach? (5 replies) |
| Elizabeth City, NC - general info (6 replies) |
| Elizabeth City or Edenton (2 replies) |
| Goldsboro is growing again! (1077 replies) |

Median year apartment built: 1980
Household type by relationship:
Households: 18,975- Male householders: 2,900 (979 living alone), Female householders: 4,358 (1,548 living alone)
2,652 spouses (2,606 opposite-sex spouses), 517 unmarried partners, (498 opposite-sex unmarried partners), 5,042 children (4,965 natural, 32 adopted, 44 stepchildren), 440 grandchildren, 240 brothers or sisters, 208 parents, 0 foster children, 85 other relatives, 898 non-relatives
- In group quarters: 1,631
Size of family households: 2,231 2-persons, 1,179 3-persons, 478 4-persons, 465 5-persons, 66 6-persons, 30 7-or-more-persons.
Size of nonfamily households: 2,571 1-person, 334 2-persons, 10 3-persons, 31 4-persons, 37 5-persons, 7 6-persons.
1,899 married couples with children.
1,578 single-parent households (80 men, 1,498 women).
92.4% of residents of Elizabeth City speak English at home.
4.7% of residents speak Spanish at home (64% speak English very well, 16% speak English well, 10% speak English not well, 10% don't speak English at all).
0.3% of residents speak other Indo-European language at home (83% speak English very well, 2% speak English not well, 15% don't speak English at all).
2.2% of residents speak Asian or Pacific Island language at home (65% speak English very well, 18% speak English well, 10% speak English not well, 6% don't speak English at all).
0.2% of residents speak other language at home (100% speak English very well).
Foreign born population: 626 (3.3%)
(46.6% of them are naturalized citizens)
| Here: | 6.0 |
| State: | 6.4 |
| Here: | 4.7 |
| State: | 4.4 |

- Bedrooms in owner-occupied houses and condos in Elizabeth City, North Carolina
- 0no bedroom
- 971 bedroom
- 7782 bedrooms
- 1,7543 bedrooms
- 4294 bedrooms
- 1275+ bedrooms

- Bedrooms in renter-occupied apartments in Elizabeth City, North Carolina
- 72no bedroom
- 8061 bedroom
- 1,3442 bedrooms
- 1,8493 bedrooms
- 1754 bedrooms
- 65+ bedrooms

- Cars and other vehicles available in Elizabeth City in owner-occupied houses/condos
- 121no vehicle
- 8771 vehicle
- 1,2122 vehicles
- 8223 vehicles
- 1324 vehicles
- 225+ vehicles

- Cars and other vehicles available in Elizabeth City in renter-occupied apartments
- 547no vehicle
- 2,0921 vehicle
- 1,3162 vehicles
- 1763 vehicles
- 1214 vehicles
- 05+ vehicles

- Rooms in owner-occupied houses in Elizabeth City, North Carolina
- 01 room
- 02 rooms
- 433 rooms
- 3364 rooms
- 8275 rooms
- 7996 rooms
- 3917 rooms
- 2788 rooms
- 5129+ rooms

- Rooms in renter-occupied apartments in Elizabeth City, North Carolina
- 721 room
- 2202 rooms
- 6843 rooms
- 9344 rooms
- 1,2815 rooms
- 4966 rooms
- 3537 rooms
- 1218 rooms
- 919+ rooms


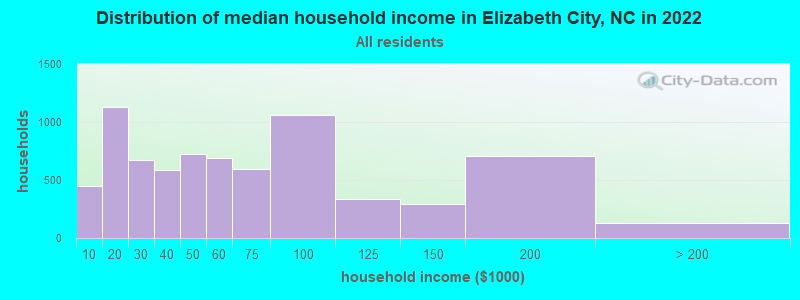
Elizabeth City, NC household income distribution

- 445Less than $10,000
- 1,130$10,000 to $19,999
- 676$20,000 to $29,999
- 587$30,000 to $39,999
- 727$40,000 to $49,999
- 692$50,000 to $59,999
- 593$60,000 to $74,999
- 1,058$75,000 to $99,999
- 337$100,000 to $124,999
- 290$125,000 to $149,999
- 704$150,000 to $199,999
- 127$200,000 or more
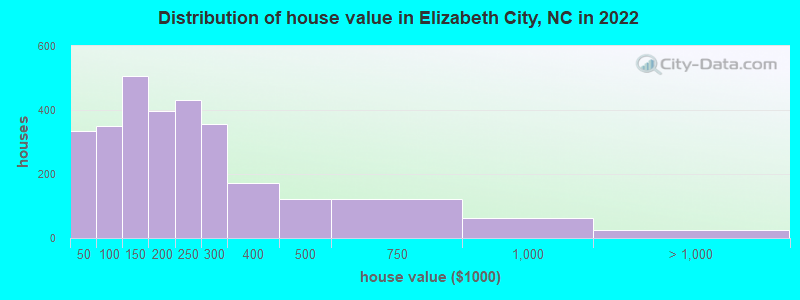
Home value of owner - occupied houses in 2022 in Elizabeth City, NC
-
- 35$10,000 to $14,999
- 26$15,000 to $19,999
- 153$20,000 to $24,999
- 25$25,000 to $29,999
- 10$30,000 to $34,999
- 37$35,000 to $39,999
- 46$40,000 to $49,999
- 88$50,000 to $59,999
- 43$60,000 to $69,999
- 42$70,000 to $79,999
- 70$80,000 to $89,999
- 57$90,000 to $99,999
- 145$100,000 to $124,999
- 360$125,000 to $149,999
- 177$150,000 to $174,999
- 219$175,000 to $199,999
- 429$200,000 to $249,999
- 356$250,000 to $299,999
- 173$300,000 to $399,999
- 122$400,000 to $499,999
- 121$500,000 to $749,999
- 63$750,000 to $999,999
- 25$2,000,000 or more
Rent paid by renters in 2022 in Elizabeth City, NC
-
- 85Less than $100
- 71$100 to $149
- 20$150 to $199
- 82$200 to $249
- 138$250 to $299
- 124$300 to $349
- 86$350 to $399
- 63$400 to $449
- 52$450 to $499
- 119$500 to $549
- 229$550 to $599
- 312$600 to $649
- 91$650 to $699
- 98$700 to $749
- 178$750 to $799
- 346$800 to $899
- 408$900 to $999
- 646$1,000 to $1,249
- 344$1,250 to $1,499
- 141$1,500 to $1,999
- 133$2,000 to $2,499
- 23$3,000 to $3,499
- 147No cash rent


Percentage of workers working in this county: 74.6%
Number of people working at home: 985 (11.8% of all workers)
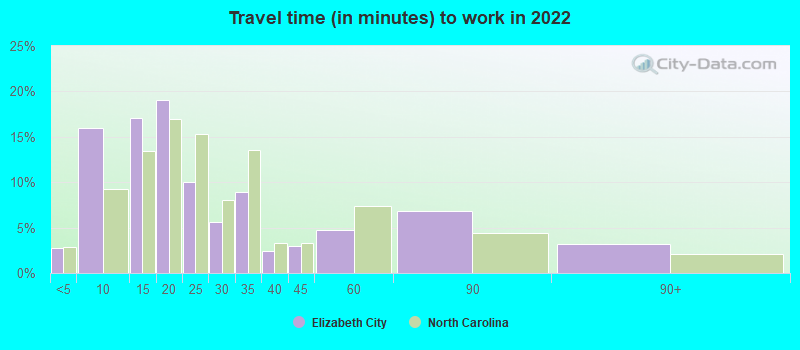
Travel time to work (commute)
- Less than 5 minutes: 255
- 5 to 9 minutes: 1,537
- 10 to 14 minutes: 1,766
- 15 to 19 minutes: 1,133
- 20 to 24 minutes: 406
- 25 to 29 minutes: 113
- 30 to 34 minutes: 231
- 35 to 39 minutes: 137
- 40 to 44 minutes: 213
- 45 to 59 minutes: 476
- 60 to 89 minutes: 700
- 90 or more minutes: 190
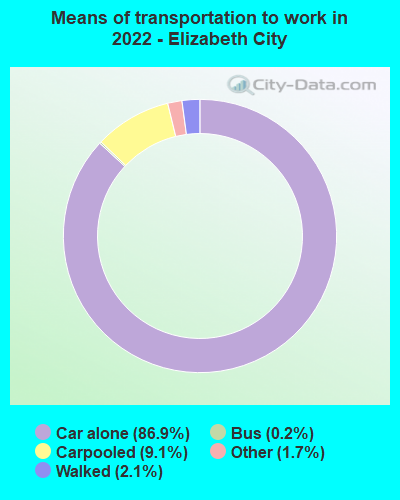
Means of transportation to work:
- Drove a car alone: 10,262 (77.7%)
- Carpooled: 1,119 (8.5%)
- Bus: 15 (0.1%)
- Taxi: 211 (1.6%)
- Bicycle: 2 (0.0%)
- Walked: 271 (2.1%)
- Worked at home: 985 (7.5%)

- Unemployment by race in 2022
- Unemployment rate for White non-Hispanic residents
- 3.6%Males
- 1.0%Females
- Unemployment rate for Black residents
- 9.6%Males
- 8.1%Females
- Unemployment rate for Asian residents
- 83.2%Females
- Unemployment rate for two or more race residents
- 9.3%Females
- Unemployment rate for Hispanic or Latino residents
- 11.4%Males

- Year of entry for the foreign-born population in Elizabeth City, North Carolina
- 3022010 or later
- 1922000 to 2009
- 281990 to 1999
- 441980 to 1989
- 451970 to 1979
- 40Before 1970

First ancestries reported:
- American: 831 (8.2%)
- English: 748 (7.4%)
- German: 296 (2.9%)
- Irish: 267 (2.6%)
- Scottish: 117 (1.2%)
- Italian: 94 (0.9%)
- African: 52 (0.5%)
- Scotch-Irish: 38 (0.4%)
- British: 35 (0.3%)
- Polish: 35 (0.3%)
- Jamaican: 27 (0.3%)
- Nigerian: 25 (0.2%)
- Haitian: 25 (0.2%)
- European: 23 (0.2%)
- Pennsylvania German: 16 (0.2%)
- Ukrainian: 14 (0.1%)
- Dutch: 12 (0.1%)
- Israeli: 10 (0.10%)
- Northern European: 8 (0.08%)
- Swedish: 7 (0.07%)
- Portuguese: 6 (0.06%)
- French: 4 (0.04%)
- Scandinavian: 3 (0.03%)
Most common places of birth for foreign-born residents (%):
| Elizabeth City: | 34.3% (215) |
| North Carolina: | 24.7% (214,776) |
| Elizabeth City: | 15.5% (97) |
| North Carolina: | 2.9% (24,965) |
| Elizabeth City: | 8.6% (54) |
| North Carolina: | 2.4% (20,695) |
| Elizabeth City: | 6.1% (38) |
| North Carolina: | 0.4% (3,587) |
| Elizabeth City: | 5.1% (32) |
| North Carolina: | 4.7% (40,707) |
| Elizabeth City: | 4.0% (25) |
| North Carolina: | 0.2% (1,461) |
| Elizabeth City: | 3.7% (23) |
| North Carolina: | 0.4% (3,524) |
| Elizabeth City: | 3.7% (23) |
| North Carolina: | 1.1% (9,831) |
| Elizabeth City: | 3.4% (21) |
| North Carolina: | 9.3% (80,594) |
| Elizabeth City: | 3.4% (21) |
| North Carolina: | 1.1% (9,173) |
| Elizabeth City: | 2.6% (16) |
| North Carolina: | 0.8% (6,645) |
| Elizabeth City: | 1.8% (11) |
| North Carolina: | 3.2% (27,477) |
| Elizabeth City: | 1.8% (11) |
| North Carolina: | 1.8% (15,534) |
| Elizabeth City: | 1.6% (10) |
| North Carolina: | 0.5% (4,378) |
| Elizabeth City: | 1.6% (10) |
| North Carolina: | 1.3% (11,419) |
Place of birth for U.S.-born residents:
- This state: 10,053
- Other state: 7,743
- Northeast: 1,832
- Midwest: 1,021
- South: 4,209
- West: 673
76.8% of Elizabeth City residents lived in the same house 1 years ago.
Out of people who lived in different houses, 30.3% lived in this county.
Out of people who lived in different counties, 64.0% lived in North Carolina.
| Elizabeth City: | 76.8% |
| State average: | 87.3% |
Education attainment for males 25 years and older:
- No schooling: 81
- Nursery to 4th grade: 0
- 5th and 6th grade: 1
- 7th and 8th grade: 43
- 9th grade: 117
- 10th grade: 163
- 11th grade: 174
- 12th grade, no diploma: 69
- High school graduate (or equivalency): 1,491
- Less than 1 year of college: 176
- Some college more than 1 year, no degree: 841
- Associate degree: 529
- Bachelor's degree: 1,082
- Master's degree: 201
- Professional school degree: 95
- Doctorate degree: 94

Education attainment for females 25 years and older:
- No schooling: 150
- Nursery to 4th grade: 0
- 5th and 6th grade: 8
- 7th and 8th grade: 102
- 9th grade: 34
- 10th grade: 30
- 11th grade: 159
- 12th grade, no diploma: 70
- High school graduate (or equivalency): 1,920
- Less than 1 year of college: 462
- Some college more than 1 year, no degree: 1,282
- Associate degree: 656
- Bachelor's degree: 1,352
- Master's degree: 590
- Professional school degree: 61
- Doctorate degree: 123


Housing units in structures:
- One, detached: 5,397
- One, attached: 315
- Two: 625
- 3 or 4: 539
- 5 to 9: 594
- 10 to 19: 400
- 20 to 49: 301
- 50 or more: 130
- Mobile homes: 273
Median worth of mobile homes: $35,166
Housing units lacking complete kitchen facilities in 2022: 2.5%
House/condo owner moved in on average 13 years ago
Renter moved in on average 2 years ago

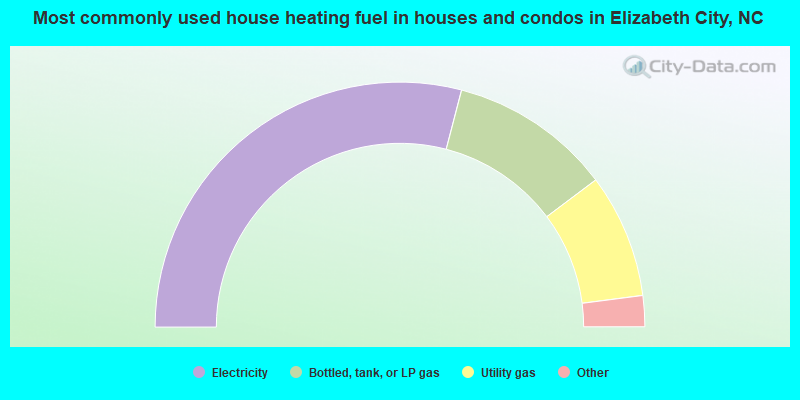
- 58.1%Electricity
- 21.4%Bottled, tank, or LP gas
- 16.4%Utility gas
- 3.4%Fuel oil, kerosene, etc.
- 0.7%No fuel used
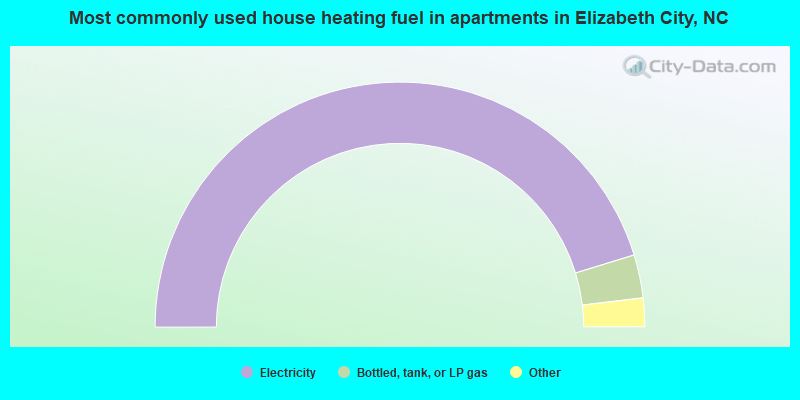
- 90.6%Electricity
- 5.7%Bottled, tank, or LP gas
- 2.3%Utility gas
- 1.1%Fuel oil, kerosene, etc.
- 0.4%No fuel used
Private vs. public school enrollment:
| Here: | 4.6% |
| North Carolina: | 13.8% |
| Here: | 9.8% |
| North Carolina: | 11.9% |
| Here: | 15.0% |
| North Carolina: | 19.3% |


