Eldersburg, MD (Maryland) Houses and Residents
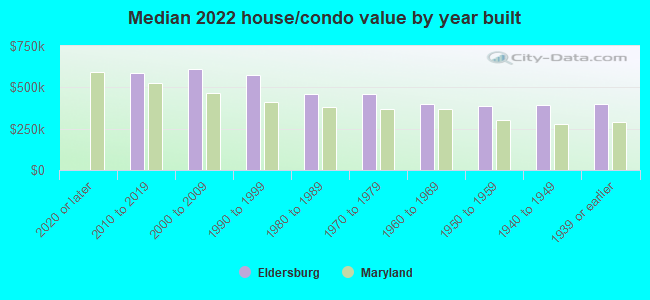
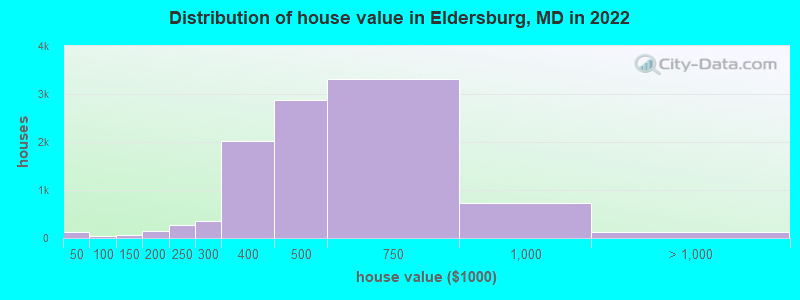
| Eldersburg: | $490,286 |
| Maryland: | $398,100 |
Mean price in 2022:
Detached houses: $498,223
Here: $498,223 State: $526,819 Townhouses or other attached units: $378,364
Here: $378,364 State: $328,305 In 3-to-4-unit structures: $241,716
Here: $241,716 State: $295,378 In 5-or-more-unit structures: $278,142
Here: $278,142 State: $350,378
Total population: 30,531 (Urban population: 22,295, Rural population: 5,430 (80 farm, 5,350 nonfarm))
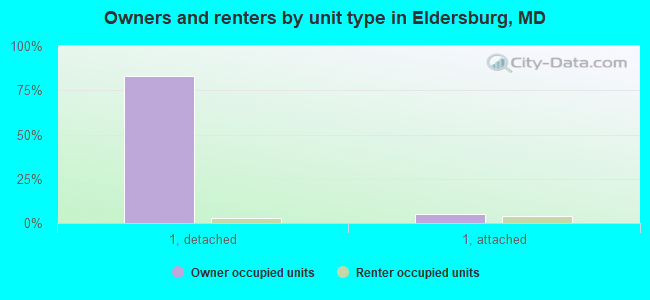
Houses: 11,028 (10,694 occupied: 9,580 owner occupied, 1,181 renter occupied)
| % of renters here: | 11% |
| State: | 32% |
Housing density: 275 houses/condos per square mile
Median price asked for vacant for-sale houses and condos in 2022: $887,115.
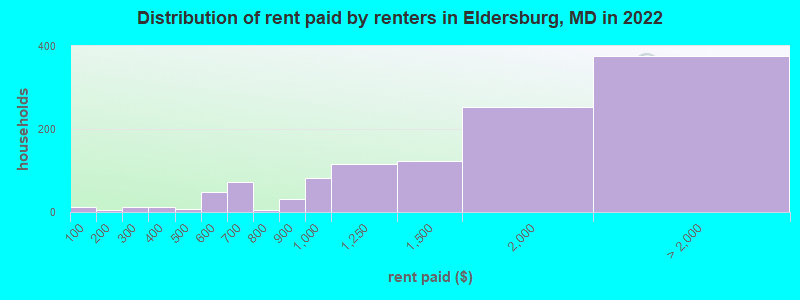
Median contract rent in 2022: $1,486 (lower quartile is $1,006, upper quartile is $1,965)
Median rent asked for vacant for-rent units in 2022: $4,838
Median gross rent in Eldersburg, MD in 2022: $1,602
Housing units in Eldersburg with a mortgage: 7,302 (1,059 second mortgage, 14 home equity loan, 988 both second mortgage and home equity loan)
Houses without a mortgage: 144
Median household income for houses/condos with a mortgage: $161,254
Median household income for apartments without a mortgage: $95,114
Median monthly housing costs: $2,057
Compare current foreclosures near Eldersburg, MD:
| Photo | Address | Area | Beds / Baths | Price | Details |
|---|---|---|---|---|---|

|
#1
Wicklow Rd
Baltimore, MD 21229
|
1,152 sq. feet
|
1 baths 3 beds |
$112,000
|
show details |

|
#2
Rayner Ave
Baltimore, MD 21216
|
1,456 sq. feet
|
1 baths 3 beds |
$42,900
|
show details |

|
#3
Wilgate Rd
Owings Mills, MD 21117
|
1,056 sq. feet
|
1 baths 3 beds |
$321,000
|
show details |

|
#4
Willow Branch Way Unit 303
Owings Mills, MD 21117
|
1,200 sq. feet
|
2 baths 2 beds |
$259,000
|
show details |

|
#5
Ann Dr
Westminster, MD 21157
|
1,092 sq. feet
|
1 baths 3 beds |
$279,300
|
show details |

|
#6
W Mosher St
Baltimore, MD 21216
|
1,574 sq. feet
|
1 baths 3 beds |
$28,500
|
show details |

|
#7
Cuthbert Ave
Baltimore, MD 21215
|
- sq. feet
|
1 baths 1 beds |
$12,000
|
show details |

|
#8
W Broadway St
Union Bridge, MD 21791
|
- sq. feet
|
2 baths 4 beds |
$239,900
|
show details |

|
#9
S Prospect Ave
Catonsville, MD 21228
|
1,178 sq. feet
|
1 baths 3 beds |
show details | |

|
#10
Old Frederick Rd
Baltimore, MD 21229
|
928 sq. feet
|
1 baths 2 beds |
show details |
| Photo | Address | Area | Beds / Baths | Price | Details |
|---|---|---|---|---|---|

|
#11
Walnut Ave
Baltimore, MD 21229
|
1,008 sq. feet
|
1 baths 3 beds |
show details | |

|
#12
Riding Crop Way
Windsor Mill, MD 21244
|
1,160 sq. feet
|
2 baths 2 beds |
show details | |

|
#13
Mondawmin Ave
Baltimore, MD 21216
|
1,512 sq. feet
|
3 baths 3 beds |
show details | |

|
#14
Gwynns Falls Pkwy
Baltimore, MD 21216
|
1,416 sq. feet
|
2 baths 3 beds |
show details | |

|
#15
Mcwhorter Farm Ct
Damascus, MD 20872
|
6,621 sq. feet
|
6 baths 5 beds |
show details | |

|
#16
Penhurst Ave
Baltimore, MD 21215
|
2,743 sq. feet
|
3 baths 6 beds |
show details | |

|
#17
Jonquil Ave
Baltimore, MD 21215
|
1,260 sq. feet
|
1 baths 3 beds |
show details | |

|
#18
Royal Oak Ave
Gwynn Oak, MD 21207
|
1,748 sq. feet
|
2 baths 4 beds |
show details | |

|
#19
Carlisle Ave
Baltimore, MD 21216
|
2,028 sq. feet
|
2 baths 4 beds |
show details | |

|
#20
Sigrid Rd
Randallstown, MD 21133
|
1,062 sq. feet
|
2 baths 3 beds |
show details |
| Photo | Address | Area | Beds / Baths | Price | Details |
|---|---|---|---|---|---|

|
#21
Sheraton Rd
Randallstown, MD 21133
|
1,413 sq. feet
|
1 baths 3 beds |
show details | |

|
#22
Manor Ln
Ellicott City, MD 21042
|
864 sq. feet
|
1 baths 2 beds |
show details | |

|
#23
Monticello Rd
Baltimore, MD 21216
|
1,984 sq. feet
|
3 baths 3 beds |
show details | |

|
#24
Woodholme Village Ct
Pikesville, MD 21208
|
2,844 sq. feet
|
4 baths 5 beds |
show details | |

|
#25
Dogwood Rd
Gwynn Oak, MD 21207
|
1,128 sq. feet
|
2 baths 3 beds |
show details | |

|
#26
Hillvale Rd
Baltimore, MD 21229
|
1,024 sq. feet
|
1 baths 3 beds |
show details | |

|
#27
Dogwood Rd
Gwynn Oak, MD 21207
|
2,456 sq. feet
|
3 baths 5 beds |
show details | |

|
#28
Dogwood Rd
Windsor Mill, MD 21244
|
1,319 sq. feet
|
2 baths 3 beds |
show details | |

|
#29
Lorraine Ave
Gwynn Oak, MD 21207
|
1,476 sq. feet
|
3 baths 3 beds |
show details | |

|
#30
Cypress Grove Ct
Owings Mills, MD 21117
|
1,280 sq. feet
|
4 baths 3 beds |
show details |
| Photo | Address | Area | Beds / Baths | Price | Details |
|---|---|---|---|---|---|

|
#31
Sunset Rd
Baltimore, MD 21215
|
1,520 sq. feet
|
1 baths 3 beds |
show details | |

|
#32
Kathland Ave
Gwynn Oak, MD 21207
|
2,942 sq. feet
|
2 baths 5 beds |
show details | |

|
#33
Gwynns Falls Pkwy
Baltimore, MD 21216
|
1,200 sq. feet
|
3 baths 4 beds |
show details | |

|
#34
Lohrs Ln
Baltimore, MD 21229
|
840 sq. feet
|
1 baths 2 beds |
show details | |

|
#35
Lyndhurst Ave
Baltimore, MD 21216
|
1,998 sq. feet
|
2 baths 4 beds |
show details | |

|
#36
Elsinore Ave
Baltimore, MD 21216
|
1,644 sq. feet
|
2 baths 4 beds |
show details | |

|
#37
S Beechfield Ave
Baltimore, MD 21229
|
1,598 sq. feet
|
2 baths 4 beds |
show details | |

|
#38
Valley Manor Rd Apt 3b
Owings Mills, MD 21117
|
1,346 sq. feet
|
2 baths 2 beds |
show details | |

|
#39
Doe Meadow Dr
Owings Mills, MD 21117
|
2,155 sq. feet
|
2 baths 4 beds |
show details | |

|
#40
Langford Rd
Gwynn Oak, MD 21207
|
1,292 sq. feet
|
1 baths 3 beds |
show details |
| Photo | Address | Area | Beds / Baths | Price | Details |
|---|---|---|---|---|---|

|
#41
Oakley Ave
Baltimore, MD 21215
|
1,443 sq. feet
|
1 baths 4 beds |
show details | |

|
#42
Red Cedar Pl Unit 110
Baltimore, MD 21209
|
1,452 sq. feet
|
2 baths 3 beds |
show details | |

|
#43
Brooke Rd
Sandy Spring, MD 20860
|
5,046 sq. feet
|
4 baths 4 beds |
show details | |

|
#44
Fairmount Ave
Baltimore, MD 21215
|
1,018 sq. feet
|
1 baths 3 beds |
show details | |

|
#45
Benton Woods Ln
Reisterstown, MD 21136
|
1,280 sq. feet
|
1 baths 3 beds |
show details | |

|
#46
Marksworth Rd
Gwynn Oak, MD 21207
|
1,720 sq. feet
|
3 baths 3 beds |
show details | |

|
#47
Norfolk Ave
Baltimore, MD 21216
|
1,350 sq. feet
|
3 baths 4 beds |
show details | |

|
#48
N Main Street
Hampstead, MD 21074
|
1,352 sq. feet
|
2 baths 3 beds |
show details | |

|
#49
Cedar Dr
Gwynn Oak, MD 21207
|
1,834 sq. feet
|
2 baths 4 beds |
show details | |

|
Check over 1 million property listings on Foreclosure.com!
|
browse all offers | |||

Latest news about housing in Eldersburg, MD collected exclusively by city-data.com from local newspapers, TV, and radio stations

 | Looking to buy a House in MD (71 replies) |
| Homes for commute to Laurel (10 replies) |
| House for rent in Sykesville/Eldersburg area (2 replies) |
| Considering a return to MD? (76 replies) |
| Rental Home in/near Eldersburg (2 replies) |
| So We Have Decided To Stay in Maryland (71 replies) |

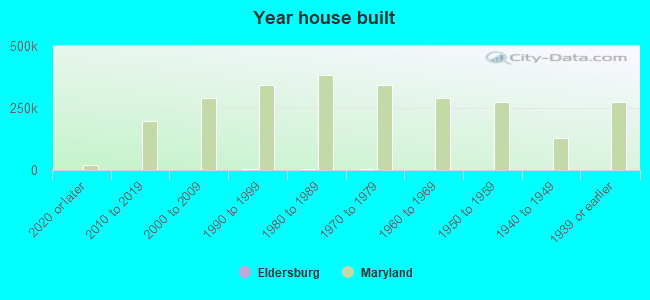
Median year apartment built: 1975
Household type by relationship:
Households: 30,721- Male householders: 5,784 (721 living alone), Female householders: 4,917 (1,170 living alone)
7,342 spouses (7,274 opposite-sex spouses), 509 unmarried partners, (502 opposite-sex unmarried partners), 9,769 children (9,283 natural, 181 adopted, 305 stepchildren), 373 grandchildren, 99 brothers or sisters, 410 parents, 10 foster children, 233 other relatives, 381 non-relatives
- In group quarters: 889
Size of family households: 2,819 2-persons, 2,230 3-persons, 2,284 4-persons, 602 5-persons, 313 6-persons, 70 7-or-more-persons.
Size of nonfamily households: 2,008 1-person, 437 2-persons, 25 3-persons.
5,929 married couples with children.
925 single-parent households (279 men, 646 women).
91.0% of residents of Eldersburg speak English at home.
1.7% of residents speak Spanish at home (74% speak English very well, 15% speak English well, 11% speak English not well).
2.5% of residents speak other Indo-European language at home (72% speak English very well, 12% speak English well, 7% speak English not well, 8% don't speak English at all).
3.5% of residents speak Asian or Pacific Island language at home (52% speak English very well, 30% speak English well, 16% speak English not well, 2% don't speak English at all).
0.4% of residents speak other language at home (82% speak English very well, 18% speak English well).
Foreign born population: 2,279 (7.4%)
(69.5% of them are naturalized citizens)
| Here: | 8.0 |
| State: | 7.3 |
| Here: | 4.6 |
| State: | 4.2 |
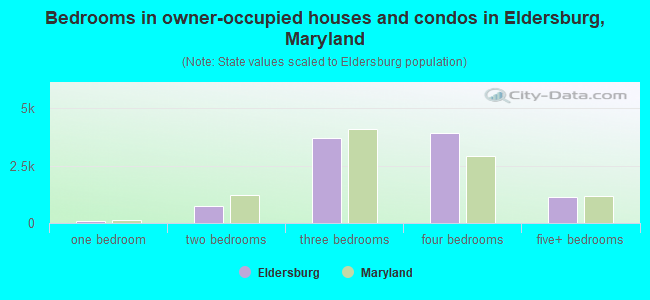
- Bedrooms in owner-occupied houses and condos in Eldersburg, Maryland
- 0no bedroom
- 761 bedroom
- 7462 bedrooms
- 3,6833 bedrooms
- 3,9234 bedrooms
- 1,1525+ bedrooms
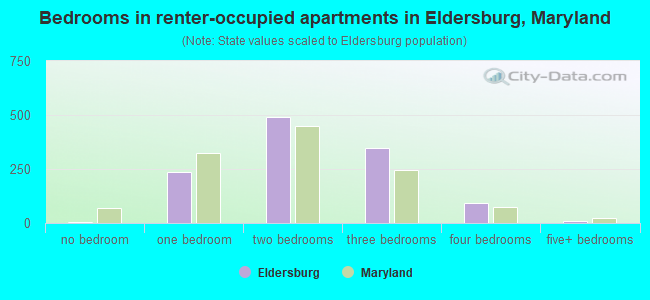
- Bedrooms in renter-occupied apartments in Eldersburg, Maryland
- 6no bedroom
- 2351 bedroom
- 4922 bedrooms
- 3463 bedrooms
- 934 bedrooms
- 105+ bedrooms
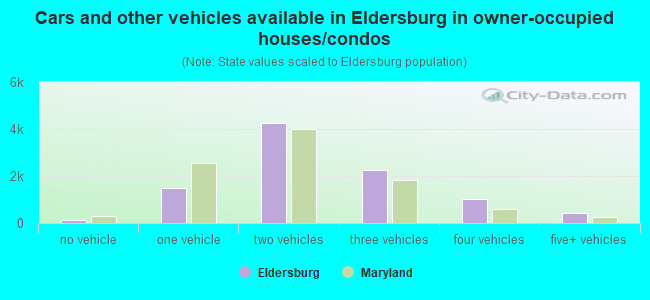
- Cars and other vehicles available in Eldersburg in owner-occupied houses/condos
- 137no vehicle
- 1,5001 vehicle
- 4,2642 vehicles
- 2,2513 vehicles
- 1,0164 vehicles
- 4125+ vehicles
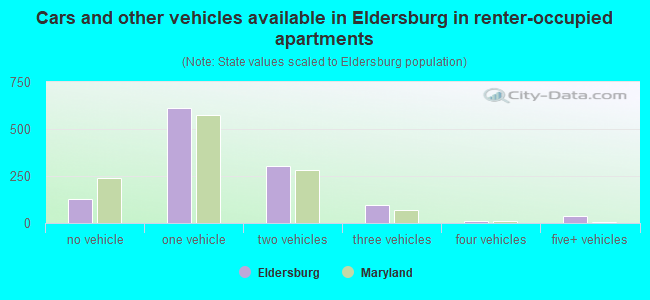
- Cars and other vehicles available in Eldersburg in renter-occupied apartments
- 127no vehicle
- 6101 vehicle
- 3022 vehicles
- 943 vehicles
- 114 vehicles
- 385+ vehicles
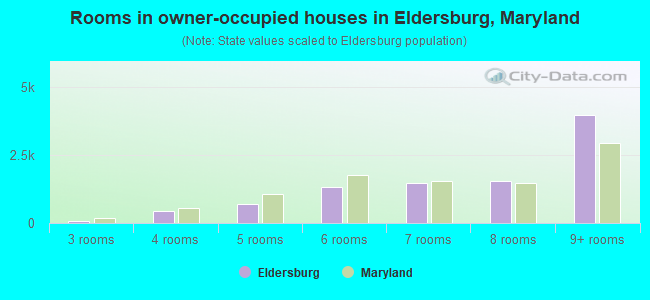
- Rooms in owner-occupied houses in Eldersburg, Maryland
- 01 room
- 192 rooms
- 733 rooms
- 4344 rooms
- 7035 rooms
- 1,3256 rooms
- 1,4867 rooms
- 1,5588 rooms
- 3,9829+ rooms
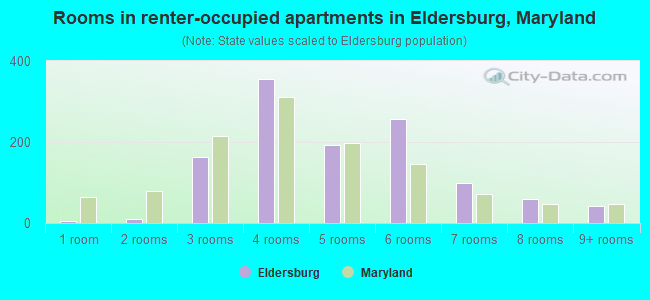
- Rooms in renter-occupied apartments in Eldersburg, Maryland
- 61 room
- 102 rooms
- 1623 rooms
- 3554 rooms
- 1925 rooms
- 2576 rooms
- 987 rooms
- 598 rooms
- 429+ rooms
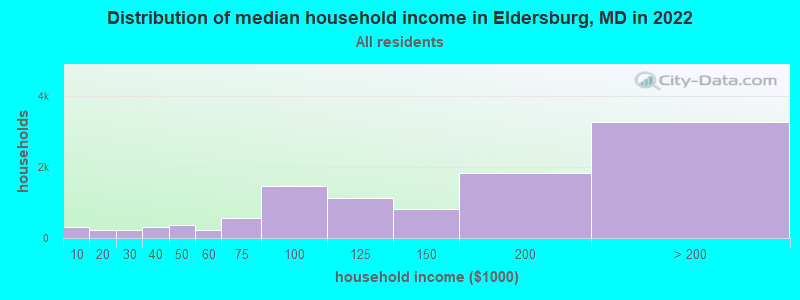
Eldersburg, MD household income distribution

- 315Less than $10,000
- 213$10,000 to $19,999
- 221$20,000 to $29,999
- 299$30,000 to $39,999
- 373$40,000 to $49,999
- 212$50,000 to $59,999
- 566$60,000 to $74,999
- 1,456$75,000 to $99,999
- 1,116$100,000 to $124,999
- 814$125,000 to $149,999
- 1,848$150,000 to $199,999
- 3,276$200,000 or more
Home value of owner - occupied houses in 2022 in Eldersburg, MD
-
- 58Less than $10,000
- 23$20,000 to $24,999
- 12$25,000 to $29,999
- 22$35,000 to $39,999
- 17$50,000 to $59,999
- 10$60,000 to $69,999
- 12$90,000 to $99,999
- 49$100,000 to $124,999
- 11$125,000 to $149,999
- 40$150,000 to $174,999
- 98$175,000 to $199,999
- 270$200,000 to $249,999
- 363$250,000 to $299,999
- 2,022$300,000 to $399,999
- 2,872$400,000 to $499,999
- 3,307$500,000 to $749,999
- 730$750,000 to $999,999
- 110$1,000,000 to $1,499,999
- 5$2,000,000 or more
Rent paid by renters in 2022 in Eldersburg, MD
-
- 11Less than $100
- 5$150 to $199
- 12$250 to $299
- 12$350 to $399
- 8$400 to $449
- 13$500 to $549
- 34$550 to $599
- 72$650 to $699
- 6$700 to $749
- 32$800 to $899
- 82$900 to $999
- 116$1,000 to $1,249
- 123$1,250 to $1,499
- 251$1,500 to $1,999
- 204$2,000 to $2,499
- 9$2,500 to $2,999
- 62$3,500 or more
- 100No cash rent
Percentage of workers working in this county: 46.3%
Number of people working at home: 4,098 (25.3% of all workers)
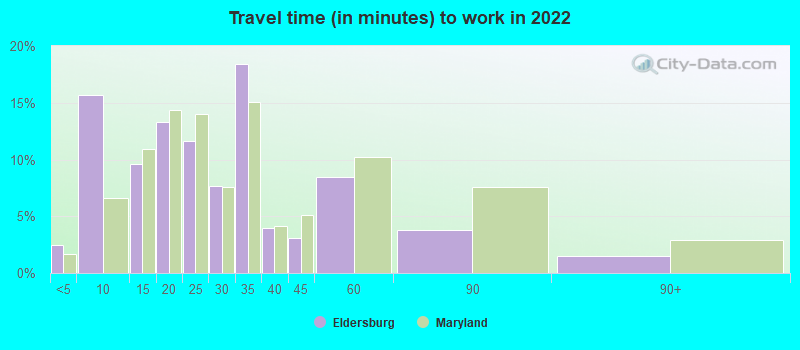
Travel time to work (commute)
- Less than 5 minutes: 212
- 5 to 9 minutes: 1,120
- 10 to 14 minutes: 883
- 15 to 19 minutes: 836
- 20 to 24 minutes: 1,023
- 25 to 29 minutes: 580
- 30 to 34 minutes: 1,973
- 35 to 39 minutes: 750
- 40 to 44 minutes: 1,668
- 45 to 59 minutes: 2,075
- 60 to 89 minutes: 917
- 90 or more minutes: 504
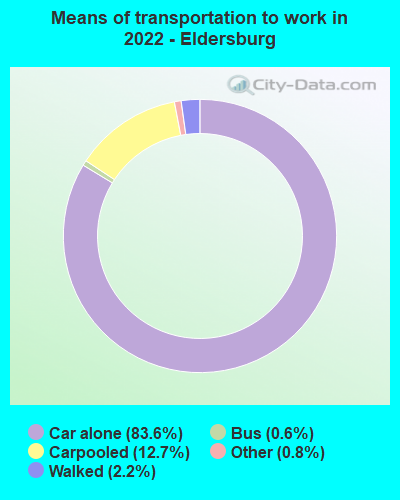
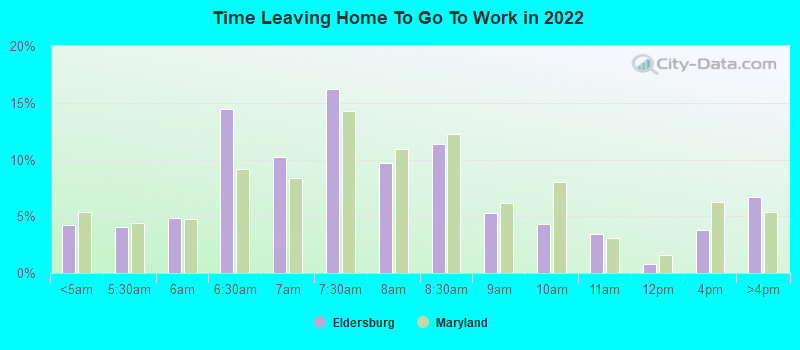
Means of transportation to work:
- Drove a car alone: 5,839 (55.3%)
- Carpooled: 946 (9.0%)
- Bus: 30 (0.3%)
- Long-distance train or commuter rail: 5 (0.0%)
- Taxi: 63 (0.6%)
- Walked: 149 (1.4%)
- Worked at home: 4,098 (38.8%)
- Unemployment by race in 2022
- Unemployment rate for White non-Hispanic residents
- 1.6%Males
- 3.1%Females
- Unemployment rate for Black residents
- 7.1%Males
- 5.9%Females
- Unemployment rate for Asian residents
- 5.2%Females
- Unemployment rate for other race residents
- 1.8%Males
- 1.8%Females
- Unemployment rate for two or more race residents
- 4.5%Males
- Unemployment rate for Hispanic or Latino residents
- 6.3%Males
- 7.5%Females
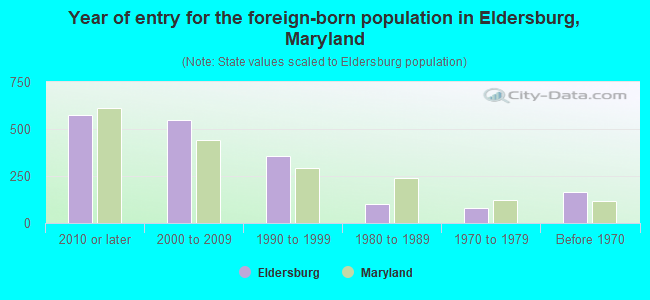
- Year of entry for the foreign-born population in Eldersburg, Maryland
- 5752010 or later
- 5502000 to 2009
- 3581990 to 1999
- 1011980 to 1989
- 781970 to 1979
- 165Before 1970
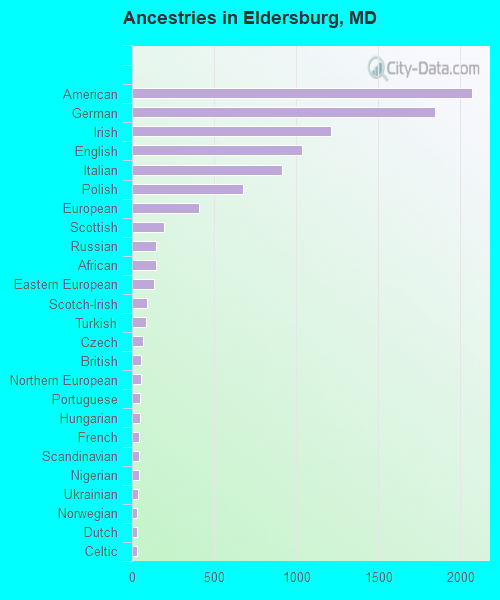
First ancestries reported:
- American: 2,073 (15.4%)
- German: 1,848 (13.8%)
- Irish: 1,216 (9.1%)
- English: 1,038 (7.7%)
- Italian: 916 (6.8%)
- Polish: 677 (5.0%)
- European: 411 (3.1%)
- Scottish: 193 (1.4%)
- Russian: 149 (1.1%)
- African: 149 (1.1%)
- Eastern European: 137 (1.0%)
- Scotch-Irish: 89 (0.7%)
- Turkish: 83 (0.6%)
- Czech: 68 (0.5%)
- British: 55 (0.4%)
- Northern European: 54 (0.4%)
- Portuguese: 51 (0.4%)
- Hungarian: 47 (0.4%)
- French: 45 (0.3%)
- Scandinavian: 40 (0.3%)
- Nigerian: 40 (0.3%)
- Ukrainian: 38 (0.3%)
- Norwegian: 30 (0.2%)
- Dutch: 29 (0.2%)
- Celtic: 29 (0.2%)
- Canadian: 28 (0.2%)
- French Canadian: 28 (0.2%)
- Lithuanian: 28 (0.2%)
- Swedish: 26 (0.2%)
- Greek: 24 (0.2%)
- Armenian: 22 (0.2%)
- Afghan: 21 (0.2%)
- South African: 19 (0.1%)
- Slavic: 18 (0.1%)
- Jamaican: 18 (0.1%)
- Slovak: 17 (0.1%)
- Danish: 17 (0.1%)
- Finnish: 14 (0.1%)
- Haitian: 14 (0.1%)
- Czechoslovakian: 11 (0.08%)
- Romanian: 11 (0.08%)
- Lebanese: 10 (0.07%)
- Serbian: 5 (0.04%)
- Welsh: 5 (0.04%)
- Israeli: 4 (0.03%)
- Latvian: 4 (0.03%)
Most common places of birth for foreign-born residents (%):
| Eldersburg: | 14.2% (286) |
| Maryland: | 6.4% (61,725) |
| Eldersburg: | 9.9% (199) |
| Maryland: | 4.6% (44,742) |
| Eldersburg: | 9.4% (190) |
| Maryland: | 3.8% (36,698) |
| Eldersburg: | 7.9% (160) |
| Maryland: | 3.4% (32,635) |
| Eldersburg: | 4.6% (92) |
| Maryland: | 12.0% (115,412) |
| Eldersburg: | 3.9% (79) |
| Maryland: | 0.9% (8,603) |
| Eldersburg: | 3.9% (79) |
| Maryland: | 4.6% (44,825) |
| Eldersburg: | 3.9% (79) |
| Maryland: | 1.0% (9,481) |
| Eldersburg: | 3.4% (69) |
| Maryland: | 0.6% (5,828) |
| Eldersburg: | 3.4% (69) |
| Maryland: | 1.8% (17,037) |
| Eldersburg: | 2.4% (49) |
| Maryland: | 0.3% (2,631) |
| Eldersburg: | 2.1% (43) |
| Maryland: | 0.7% (6,326) |
| Eldersburg: | 2.1% (42) |
| Maryland: | 0.2% (1,473) |
| Eldersburg: | 1.9% (38) |
| Maryland: | 0.5% (4,414) |
| Eldersburg: | 1.9% (38) |
| Maryland: | 1.2% (11,265) |
| Eldersburg: | 1.8% (36) |
| Maryland: | 2.5% (23,969) |
| Eldersburg: | 1.7% (34) |
| Maryland: | 0.5% (4,901) |
| Eldersburg: | 1.5% (31) |
| Maryland: | 1.3% (12,074) |
Place of birth for U.S.-born residents:
- This state: 18,970
- Other state: 9,159
- Northeast: 4,180
- Midwest: 1,533
- South: 2,777
- West: 689
91.4% of Eldersburg residents lived in the same house 1 years ago.
Out of people who lived in different houses, 24.6% lived in this county.
Out of people who lived in different counties, 81.6% lived in Maryland.
| Eldersburg: | 91.4% |
| State average: | 88.5% |
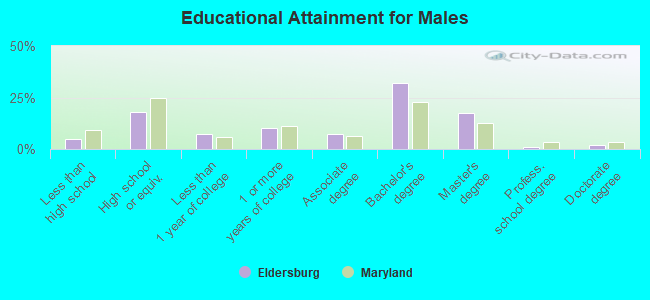
Education attainment for males 25 years and older:
- No schooling: 74
- Nursery to 4th grade: 0
- 5th and 6th grade: 10
- 7th and 8th grade: 55
- 9th grade: 38
- 10th grade: 58
- 11th grade: 81
- 12th grade, no diploma: 186
- High school graduate (or equivalency): 1,891
- Less than 1 year of college: 761
- Some college more than 1 year, no degree: 1,048
- Associate degree: 770
- Bachelor's degree: 3,354
- Master's degree: 1,831
- Professional school degree: 110
- Doctorate degree: 204
Education attainment for females 25 years and older:
- No schooling: 78
- Nursery to 4th grade: 0
- 5th and 6th grade: 16
- 7th and 8th grade: 73
- 9th grade: 84
- 10th grade: 66
- 11th grade: 88
- 12th grade, no diploma: 40
- High school graduate (or equivalency): 2,065
- Less than 1 year of college: 783
- Some college more than 1 year, no degree: 773
- Associate degree: 834
- Bachelor's degree: 3,574
- Master's degree: 1,890
- Professional school degree: 321
- Doctorate degree: 198


Housing units in structures:
- One, detached: 9,046
- One, attached: 971
- Two: 44
- 3 or 4: 136
- 5 to 9: 134
- 10 to 19: 450
- 20 to 49: 67
- 50 or more: 155
- Mobile homes: 21
Housing units lacking complete kitchen facilities in 2022: 0.3%
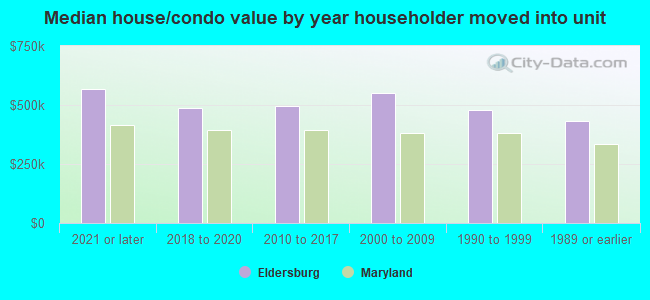
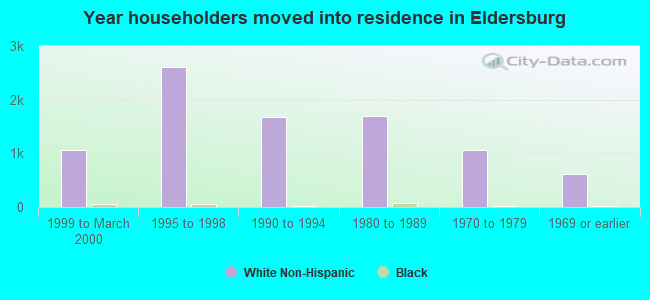
House/condo owner moved in on average 11 years ago
Renter moved in on average 4 years ago
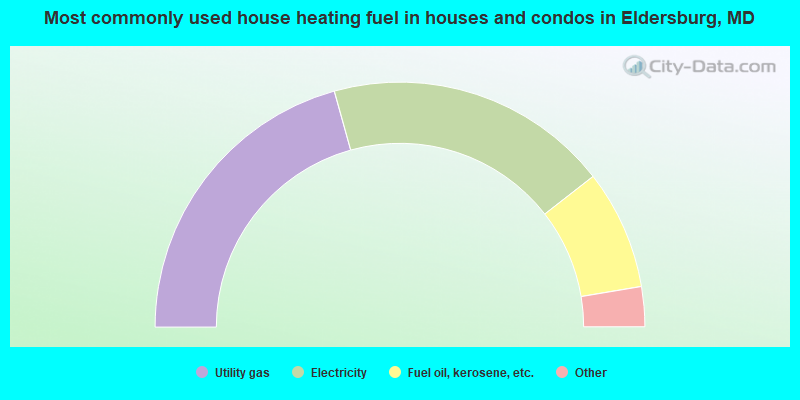
- 41.4%Utility gas
- 37.6%Electricity
- 15.8%Fuel oil, kerosene, etc.
- 3.0%Bottled, tank, or LP gas
- 1.3%Wood
- 0.5%Solar energy
- 0.4%Other fuel
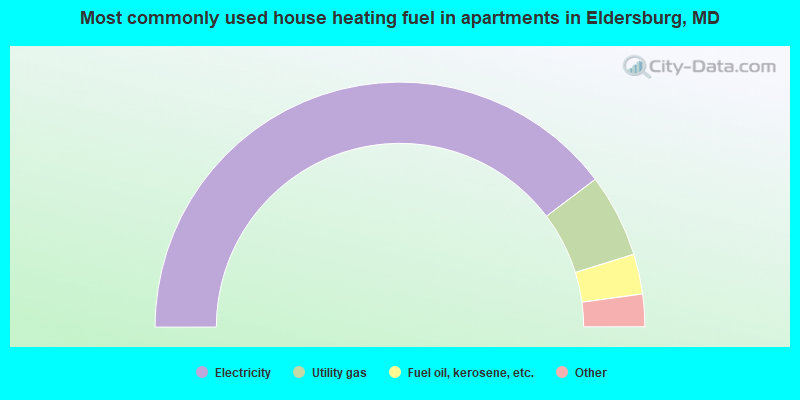
- 79.5%Electricity
- 11.0%Utility gas
- 5.3%Fuel oil, kerosene, etc.
- 2.9%Wood
- 1.3%No fuel used
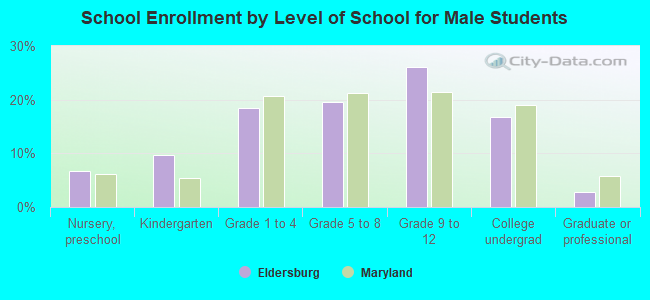
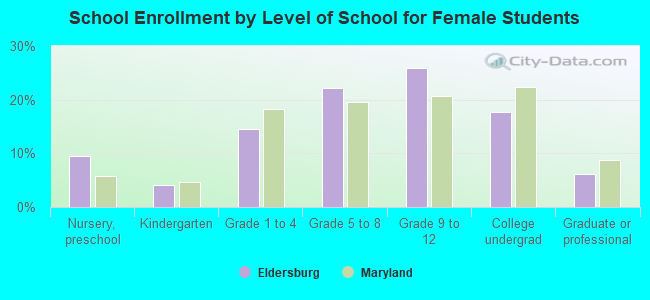
Private vs. public school enrollment:
| Here: | 12.4% |
| Maryland: | 15.2% |
| Here: | 9.7% |
| Maryland: | 14.4% |
| Here: | 18.0% |
| Maryland: | 20.2% |