El Monte, CA (California) Houses and Residents
| El Monte: | $633,400 |
| California: | $715,900 |
Mean price in 2022:
Detached houses: $898,573
Here: $898,573 State: $988,808 Townhouses or other attached units: $619,394
Here: $619,394 State: $838,546 In 5-or-more-unit structures: $744,208
Here: $744,208 State: $730,996 Mobile homes: $81,161
Here: $81,161 State: $184,506
Total population: 116,631 (Urban population: 116,249, Rural population: 0)
Houses: 31,499 (30,181 occupied: 10,948 owner occupied, 19,233 renter occupied)
| % of renters here: | 64% |
| State: | 44% |
Housing density: 3,297 houses/condos per square mile
Median price asked for vacant for-sale houses and condos in 2022: $579,814.
Median contract rent in 2022: $1,410 (lower quartile is $1,074, upper quartile is $1,788)
Median rent asked for vacant for-rent units in 2022: $2,812
Median gross rent in El Monte, CA in 2022: $1,613
Housing units in El Monte with a mortgage: 6,521 (703 second mortgage, 133 home equity loan, 438 both second mortgage and home equity loan)
Houses without a mortgage: 0
Median household income for houses/condos with a mortgage: $103,521
Median household income for apartments without a mortgage: $59,644
Median monthly housing costs: $1,622
Compare current foreclosures in El Monte, CA:
| Photo | Address | Area | Beds / Baths | Price | Details |
|---|---|---|---|---|---|

|
#1
Ranger Ave
El Monte, CA 91731
|
1,039 sq. feet
|
1 baths 3 beds |
show details | |

|
#2
Rockwell Ave
El Monte, CA 91731
|
1,169 sq. feet
|
2 baths 2 beds |
show details | |

|
#3
Lansdale Ave
El Monte, CA 91732
|
1,866 sq. feet
|
3 baths 6 beds |
show details | |

|
#4
Mcgirk Ave
El Monte, CA 91732
|
832 sq. feet
|
1 baths 2 beds |
show details | |

|
#5
Cogswell Rd
El Monte, CA 91732
|
1,168 sq. feet
|
2 baths 3 beds |
show details | |

|
#6
De Garmo Ave
El Monte, CA 91731
|
1,066 sq. feet
|
2 baths 3 beds |
show details | |

|
#7
Iris Ln
El Monte, CA 91731
|
1,505 sq. feet
|
3 baths 3 beds |
show details | |

|
#8
Esmeralda Ave
El Monte, CA 91731
|
1,098 sq. feet
|
2 baths 4 beds |
show details | |

|
#9
Basye St Unit F
El Monte, CA 91731
|
3,205 sq. feet
|
4 baths 4 beds |
show details | |

|
#10
Rio Hondo Pkwy
El Monte, CA 91732
|
1,082 sq. feet
|
2 baths 3 beds |
show details |
| Photo | Address | Area | Beds / Baths | Price | Details |
|---|---|---|---|---|---|

|
#11
Burkett Rd
El Monte, CA 91732
|
1,812 sq. feet
|
2 baths 4 beds |
show details | |

|
#12
Magnolia St
El Monte, CA 91732
|
2,343 sq. feet
|
3 baths 4 beds |
show details | |

|
#13
Lee Ln
El Monte, CA 91731
|
908 sq. feet
|
1 baths 2 beds |
show details | |

|
#14
Lexington Ave
El Monte, CA 91731
|
2,312 sq. feet
|
3 baths 4 beds |
show details | |

|
#15
Bryant Rd
El Monte, CA 91731
|
1,080 sq. feet
|
1 baths 2 beds |
show details | |

|
#16
Maxson Rd
El Monte, CA 91732
|
2,310 sq. feet
|
2 baths 4 beds |
show details | |

|
#17
Ranchito St
El Monte, CA 91732
|
2,114 sq. feet
|
3 baths 4 beds |
show details | |

|
#18
Pineville St
El Monte, CA 91732
|
1,330 sq. feet
|
2 baths 4 beds |
show details | |

|
#19
Rio Hondo Pkwy
El Monte, CA 91732
|
664 sq. feet
|
2 baths 3 beds |
show details | |

|
#20
Killian St
El Monte, CA 91732
|
1,032 sq. feet
|
1 baths 2 beds |
show details |
| Photo | Address | Area | Beds / Baths | Price | Details |
|---|---|---|---|---|---|

|
#21
Pine Ave
El Monte, CA 91731
|
1,423 sq. feet
|
2 baths 7 beds |
show details | |

|
#22
Buffington Rd
El Monte, CA 91732
|
2,852 sq. feet
|
5 baths 5 beds |
show details | |

|
#23
Meadowlark St
El Monte, CA 91732
|
1,408 sq. feet
|
3 baths 3 beds |
show details | |

|
#24
Olney St
El Monte, CA 91731
|
732 sq. feet
|
1 baths 2 beds |
show details | |

|
#25
San Ignacio Dr
El Monte, CA 91732
|
1,016 sq. feet
|
2 baths 3 beds |
show details | |

|
#26
Hallwood Dr
El Monte, CA 91732
|
1,167 sq. feet
|
2 baths 3 beds |
show details | |

|
#27
Mulhall St Unit 13
El Monte, CA 91731
|
1,206 sq. feet
|
3 baths 3 beds |
show details | |

|
#28
Celine St
El Monte, CA 91732
|
840 sq. feet
|
1 baths 2 beds |
show details | |

|
#29
Whitney Dr
El Monte, CA 91731
|
1,392 sq. feet
|
2 baths 4 beds |
show details | |

|
#30
Lexington Ave
El Monte, CA 91731
|
978 sq. feet
|
1 baths 2 beds |
show details |
| Photo | Address | Area | Beds / Baths | Price | Details |
|---|---|---|---|---|---|

|
#31
Elmcrest St
El Monte, CA 91731
|
1,192 sq. feet
|
2 baths 3 beds |
show details | |

|
#32
Tamarack St
El Monte, CA 91732
|
1,408 sq. feet
|
3 baths 3 beds |
show details | |

|
#33
Mcgirk Ave
El Monte, CA 91732
|
2,325 sq. feet
|
3 baths 5 beds |
show details | |

|
#34
Bryant Rd
El Monte, CA 91731
|
1,080 sq. feet
|
1 baths 2 beds |
show details | |

|
#35
Elliott Ave Spc 158
El Monte, CA 91732
|
- sq. feet
|
- baths - beds |
show details | |

|
#36
Maxson Rd Apt G
El Monte, CA 91732
|
- sq. feet
|
- baths - beds |
show details | |

|
#37
1/2 Durfee Ave
El Monte, CA 91732
|
- sq. feet
|
- baths - beds |
show details | |

|
#38
Meeker Ave Apt 2
El Monte, CA 91731
|
- sq. feet
|
- baths - beds |
show details | |

|
#39
1/2 Eunice Ave
El Monte, CA 91731
|
- sq. feet
|
- baths - beds |
show details | |

|
#40
Lansdale Ave Apt 1
El Monte, CA 91732
|
- sq. feet
|
- baths - beds |
show details |
| Photo | Address | Area | Beds / Baths | Price | Details |
|---|---|---|---|---|---|

|
#41
Maxson Rd Apt D
El Monte, CA 91732
|
- sq. feet
|
- baths - beds |
show details | |

|
#42
Lower Azusa Rd Unit C
El Monte, CA 91732
|
- sq. feet
|
- baths - beds |
show details | |

|
#43
Gilman Rd Apt 20
El Monte, CA 91732
|
- sq. feet
|
- baths - beds |
show details | |

|
#44
Santa Fe Dr, Unit 330
El Monte, CA 91731
|
- sq. feet
|
- baths - beds |
show details | |

|
#45
Basye St
El Monte, CA 91731
|
- sq. feet
|
- baths - beds |
show details | |

|
#46
Elliott Ave Spc 425
El Monte, CA 91732
|
- sq. feet
|
- baths - beds |
show details | |

|
#47
Lower Azusa Rd
El Monte, CA 91732
|
- sq. feet
|
- baths - beds |
show details | |

|
#48
Gibson Rd Apt G
El Monte, CA 91731
|
- sq. feet
|
- baths - beds |
show details | |

|
#49
Montecito Dr
El Monte, CA 91731
|
- sq. feet
|
- baths - beds |
show details | |

|
Check over 1 million property listings on Foreclosure.com!
|
browse all offers | |||


 | Asians find homes in historically Latino El Monte (33 replies) |
| CA Cities(Pop 65,000+) by Median Household Income, 2019 (8 replies) |
| The Los Angeles Homeless Containment Thread (9137 replies) |
| Apartment hunting in Los Angeles (20 replies) |
| Can we afford a house and which neighborhood? (19 replies) |
| Homes in Inland empire : Corona, CA (10 replies) |

Median year apartment built: 1966
Household type by relationship:
Households: 105,307- Male householders: 15,844 (2,709 living alone), Female householders: 14,337 (1,935 living alone)
13,846 spouses (13,761 opposite-sex spouses), 2,156 unmarried partners, (2,049 opposite-sex unmarried partners), 33,649 children (32,645 natural, 52 adopted, 952 stepchildren), 2,815 grandchildren, 5,416 brothers or sisters, 4,777 parents, 0 foster children, 7,088 other relatives, 3,800 non-relatives
- In group quarters: 1,579
Size of family households: 6,115 2-persons, 5,661 3-persons, 5,854 4-persons, 3,700 5-persons, 1,869 6-persons, 1,290 7-or-more-persons.
Size of nonfamily households: 4,644 1-person, 632 2-persons, 382 3-persons, 34 7-or-more-persons.
10,464 married couples with children.
9,084 single-parent households (2,610 men, 6,474 women).
17.3% of residents of El Monte speak English at home.
54.0% of residents speak Spanish at home (56% speak English very well, 14% speak English well, 19% speak English not well, 12% don't speak English at all).
0.6% of residents speak other Indo-European language at home (66% speak English very well, 25% speak English well, 6% speak English not well, 2% don't speak English at all).
26.7% of residents speak Asian or Pacific Island language at home (30% speak English very well, 21% speak English well, 31% speak English not well, 18% don't speak English at all).
0.3% of residents speak other language at home (27% speak English very well, 73% don't speak English at all).
Foreign born population: 55,085 (52.3%)
(49.0% of them are naturalized citizens)
| Here: | 5.3 |
| State: | 6.0 |
| Here: | 4.0 |
| State: | 3.9 |

- Bedrooms in owner-occupied houses and condos in El Monte, California
- 79no bedroom
- 1591 bedroom
- 1,7542 bedrooms
- 6,4453 bedrooms
- 2,2174 bedrooms
- 2945+ bedrooms

- Bedrooms in renter-occupied apartments in El Monte, California
- 1,109no bedroom
- 4,5871 bedroom
- 8,8482 bedrooms
- 3,5033 bedrooms
- 9094 bedrooms
- 2775+ bedrooms

- Cars and other vehicles available in El Monte in owner-occupied houses/condos
- 571no vehicle
- 1,8631 vehicle
- 3,9332 vehicles
- 2,1313 vehicles
- 1,3474 vehicles
- 1,1035+ vehicles

- Cars and other vehicles available in El Monte in renter-occupied apartments
- 2,691no vehicle
- 6,3501 vehicle
- 5,9432 vehicles
- 3,0613 vehicles
- 7644 vehicles
- 4245+ vehicles

- Rooms in owner-occupied houses in El Monte, California
- 791 room
- 1052 rooms
- 5503 rooms
- 1,9624 rooms
- 3,2815 rooms
- 2,8296 rooms
- 7937 rooms
- 9158 rooms
- 4349+ rooms

- Rooms in renter-occupied apartments in El Monte, California
- 9441 room
- 1,0972 rooms
- 3,5273 rooms
- 7,3894 rooms
- 3,1295 rooms
- 2,1806 rooms
- 6257 rooms
- 2308 rooms
- 1129+ rooms


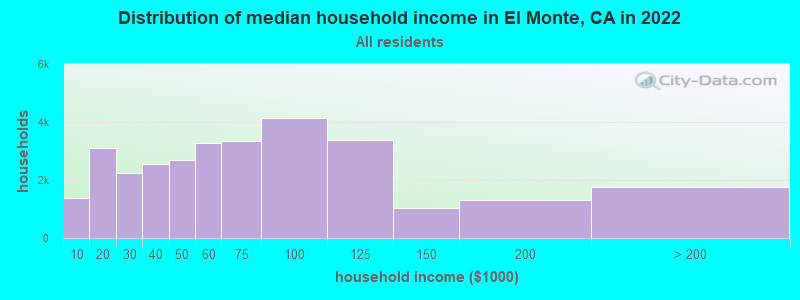
El Monte, CA household income distribution

- 1,376Less than $10,000
- 3,094$10,000 to $19,999
- 2,250$20,000 to $29,999
- 2,553$30,000 to $39,999
- 2,703$40,000 to $49,999
- 3,263$50,000 to $59,999
- 3,341$60,000 to $74,999
- 4,138$75,000 to $99,999
- 3,368$100,000 to $124,999
- 1,027$125,000 to $149,999
- 1,305$150,000 to $199,999
- 1,763$200,000 or more
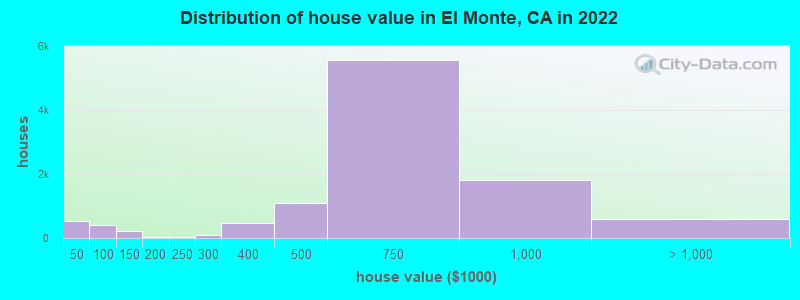
Home value of owner - occupied houses in 2022 in El Monte, CA
-
- 224Less than $10,000
- 100$10,000 to $14,999
- 35$15,000 to $19,999
- 26$20,000 to $24,999
- 7$25,000 to $29,999
- 95$30,000 to $34,999
- 50$40,000 to $49,999
- 55$50,000 to $59,999
- 90$60,000 to $69,999
- 51$70,000 to $79,999
- 59$80,000 to $89,999
- 84$90,000 to $99,999
- 182$100,000 to $124,999
- 45$125,000 to $149,999
- 9$150,000 to $174,999
- 16$175,000 to $199,999
- 22$200,000 to $249,999
- 78$250,000 to $299,999
- 479$300,000 to $399,999
- 1,099$400,000 to $499,999
- 5,546$500,000 to $749,999
- 1,807$750,000 to $999,999
- 437$1,000,000 to $1,499,999
- 33$1,500,000 to $1,999,999
- 137$2,000,000 or more
Rent paid by renters in 2022 in El Monte, CA
-
- 60Less than $100
- 8$100 to $149
- 265$200 to $249
- 258$250 to $299
- 48$300 to $349
- 33$350 to $399
- 77$400 to $449
- 275$450 to $499
- 97$500 to $549
- 76$550 to $599
- 269$600 to $649
- 66$650 to $699
- 150$700 to $749
- 138$750 to $799
- 726$800 to $899
- 687$900 to $999
- 2,478$1,000 to $1,249
- 4,016$1,250 to $1,499
- 5,706$1,500 to $1,999
- 1,926$2,000 to $2,499
- 440$2,500 to $2,999
- 33$3,000 to $3,499
- 23$3,500 or more
- 446No cash rent


Percentage of workers working in this county: 93.5%
Number of people working at home: 1,888 (4.0% of all workers)
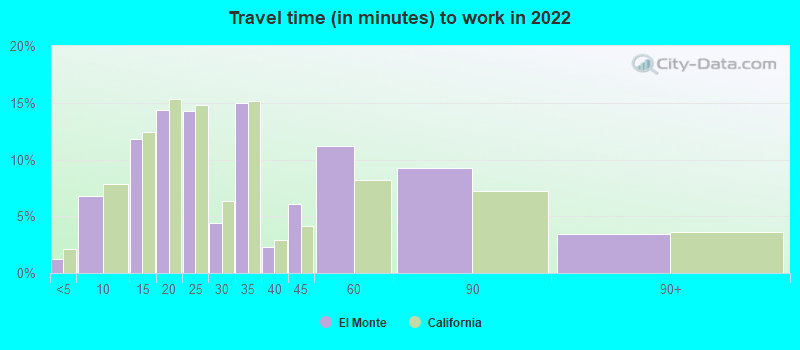
Travel time to work (commute)
- Less than 5 minutes: 687
- 5 to 9 minutes: 2,550
- 10 to 14 minutes: 4,470
- 15 to 19 minutes: 7,863
- 20 to 24 minutes: 8,426
- 25 to 29 minutes: 1,531
- 30 to 34 minutes: 9,757
- 35 to 39 minutes: 1,224
- 40 to 44 minutes: 1,546
- 45 to 59 minutes: 3,737
- 60 to 89 minutes: 2,331
- 90 or more minutes: 1,460
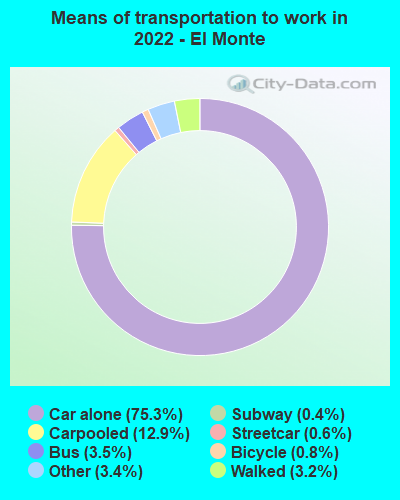
Means of transportation to work:
- Drove a car alone: 24,400 (71.1%)
- Carpooled: 4,196 (12.2%)
- Bus: 1,129 (3.3%)
- Subway or elevated rail: 182 (0.5%)
- Long-distance train or commuter rail: 117 (0.3%)
- Taxi: 1,113 (3.2%)
- Bicycle: 257 (0.7%)
- Walked: 1,026 (3.0%)
- Worked at home: 1,888 (5.5%)

- Unemployment by race in 2022
- Unemployment rate for White non-Hispanic residents
- 8.7%Males
- 6.9%Females
- Unemployment rate for Black residents
- 34.4%Males
- 50.3%Females
- Unemployment rate for American Indian and Alaska Native residents
- 9.4%Males
- Unemployment rate for Asian residents
- 3.7%Males
- 1.9%Females
- Unemployment rate for other race residents
- 1.6%Males
- 9.3%Females
- Unemployment rate for two or more race residents
- 2.3%Males
- 2.0%Females
- Unemployment rate for Hispanic or Latino residents
- 1.7%Males
- 6.7%Females

- Year of entry for the foreign-born population in El Monte, California
- 9,1272010 or later
- 10,6332000 to 2009
- 12,9291990 to 1999
- 20,9381980 to 1989
- 10,3661970 to 1979
- 3,938Before 1970

First ancestries reported:
- American: 435 (0.5%)
- English: 212 (0.3%)
- European: 125 (0.2%)
- German: 125 (0.2%)
- Italian: 113 (0.1%)
- Irish: 107 (0.1%)
- French Canadian: 45 (0.06%)
- Brazilian: 34 (0.04%)
- Ukrainian: 30 (0.04%)
- Australian: 26 (0.03%)
- Norwegian: 21 (0.03%)
- Polish: 18 (0.02%)
- Scotch-Irish: 17 (0.02%)
- Belgian: 15 (0.02%)
- Scandinavian: 14 (0.02%)
- Scottish: 14 (0.02%)
- Nigerian: 14 (0.02%)
- Armenian: 13 (0.02%)
- Belizean: 13 (0.02%)
- Swedish: 11 (0.01%)
- Dutch: 10 (0.01%)
- Arab: 9 (0.01%)
- British: 9 (0.01%)
- French: 9 (0.01%)
- Greek: 8 (0.01%)
- Danish: 5 (0.01%)
- Egyptian: 4 (0.01%)
- Northern European: 4 (0.01%)
Most common places of birth for foreign-born residents (%):
| El Monte: | 45.2% (23,488) |
| California: | 37.2% (3,881,193) |
| El Monte: | 20.9% (10,889) |
| California: | 4.9% (512,335) |
| El Monte: | 16.2% (8,413) |
| California: | 6.6% (684,672) |
| El Monte: | 3.0% (1,550) |
| California: | 4.2% (440,287) |
| El Monte: | 2.6% (1,363) |
| California: | 2.8% (290,436) |
| El Monte: | 2.5% (1,284) |
| California: | 7.8% (818,297) |
| El Monte: | 1.5% (796) |
| California: | 1.7% (176,274) |
Place of birth for U.S.-born residents:
- This state: 46,700
- Other state: 2,314
- Northeast: 476
- Midwest: 341
- South: 1,107
- West: 390
93.5% of El Monte residents lived in the same house 1 years ago.
Out of people who lived in different houses, 46.0% lived in this county.
Out of people who lived in different counties, 64.7% lived in California.
| El Monte: | 93.5% |
| State average: | 88.9% |
Education attainment for males 25 years and older:
- No schooling: 3,123
- Nursery to 4th grade: 896
- 5th and 6th grade: 2,451
- 7th and 8th grade: 1,234
- 9th grade: 1,209
- 10th grade: 1,016
- 11th grade: 320
- 12th grade, no diploma: 1,369
- High school graduate (or equivalency): 11,629
- Less than 1 year of college: 1,458
- Some college more than 1 year, no degree: 3,496
- Associate degree: 2,343
- Bachelor's degree: 3,593
- Master's degree: 926
- Professional school degree: 156
- Doctorate degree: 205

Education attainment for females 25 years and older:
- No schooling: 3,772
- Nursery to 4th grade: 1,061
- 5th and 6th grade: 1,498
- 7th and 8th grade: 1,637
- 9th grade: 2,132
- 10th grade: 616
- 11th grade: 536
- 12th grade, no diploma: 1,211
- High school graduate (or equivalency): 11,180
- Less than 1 year of college: 2,199
- Some college more than 1 year, no degree: 3,363
- Associate degree: 2,091
- Bachelor's degree: 3,488
- Master's degree: 729
- Professional school degree: 191
- Doctorate degree: 132


Housing units in structures:
- One, detached: 16,593
- One, attached: 2,706
- Two: 714
- 3 or 4: 1,658
- 5 to 9: 1,678
- 10 to 19: 1,674
- 20 to 49: 2,534
- 50 or more: 2,847
- Mobile homes: 1,095
Median worth of mobile homes: $67,517
Housing units lacking complete kitchen facilities in 2022: 3.1%
House/condo owner moved in on average 17 years ago
Renter moved in on average 7 years ago

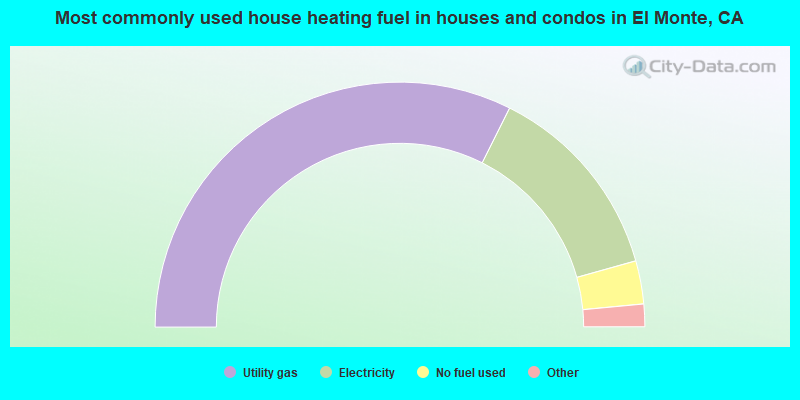
- 64.8%Utility gas
- 26.5%Electricity
- 5.7%No fuel used
- 2.1%Bottled, tank, or LP gas
- 0.5%Solar energy
- 0.1%Wood
- 0.1%Fuel oil, kerosene, etc.
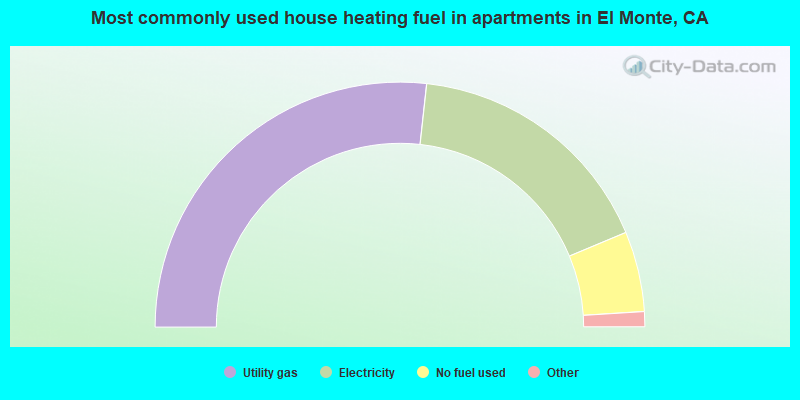
- 53.5%Utility gas
- 33.9%Electricity
- 10.6%No fuel used
- 1.7%Bottled, tank, or LP gas
- 0.1%Solar energy
Private vs. public school enrollment:
| Here: | 2.2% |
| California: | 10.5% |
| Here: | 10.8% |
| California: | 8.5% |
| Here: | 22.2% |
| California: | 15.9% |


