Egypt Lake-Leto, FL (Florida) Houses and Residents
Estimated median house or condo value in 2022: $328,705 (it was $81,100 in 2000 )
Egypt Lake-Leto:
$328,705Florida:
$354,100
Lower value quartile - upper value quartile: $215,009 - $440,537Mean price in 2022: Detached houses: $367,504 Here:
$367,504State:
$500,941
Townhouses or other attached units: $182,160 Here:
$182,160State:
$370,869
In 3-to-4-unit structures: $129,491 Here:
$129,491State:
$309,944
In 5-or-more-unit structures: $135,962 Here:
$135,962State:
$447,145
Mobile homes: $75,687 Here:
$75,687State:
$113,202
Total population: 35,282 (Urban population: 32,792, Rural population: 0)
Houses: 15,564 (14,897 occupied: 6,907 owner occupied, 8,051 renter occupied )
% of renters here:
54%State:
33%
Housing density: 2,607 houses/condos per square mile
Median price asked for vacant for-sale houses and condos in 2022 in this county: $333,299.
Median contract rent in 2022: $1,241 (lower quartile is $1,015, upper quartile is $1,504)
Median rent asked for vacant for-rent units in 2022: $1,832
Median gross rent in Egypt Lake-Leto, FL in 2022: $1,345
Housing units in Egypt Lake-Leto with a mortgage: 4,520 (237 second mortgage, 15 home equity loan, 201 both second mortgage and home equity loan )Houses without a mortgage: 100
Median household income for houses/condos with a mortgage: $69,063
Median household income for apartments without a mortgage: $51,636
Median monthly housing costs: $1,260
Data:
Median house or condo value ($)
Median house or condo value ($ change since 2000)
Median house or condo value ($) - White
Median house or condo value ($) - Black or African American
Median house or condo value ($) - Asian
Median house or condo value ($) - Hispanic or Latino
Median house or condo value ($) - American Indian and Alaska Native
Median house or condo value ($) - Multirace
Median house or condo value ($) - Other Race
Median price asked for mobile homes ($)
Household density (households per square mile)
Mean house or condo value by units in structure - 1, detached ($)
Mean house or condo value by units in structure - 1, attached ($)
Mean house or condo value by units in structure - 2 ($)
Mean house or condo value by units in structure by units in structure - 3 or 4 ($)
Mean house or condo value by units in structure - 5 or more ($)
Mean house or condo value by units in structure - Boat, RV, van, etc. ($)
Mean house or condo value by units in structure - Mobile home ($)
Median contract rent ($)
Median contract rent - Lower quartile ($)
Median contract rent - Upper quartile ($)
Median gross rent ($)
Urban houses (%)
Rural houses (%)
Houses occupied (%)
Houses occupied (% change since 2000)
Houses owner occupied (%)
Houses owner occupied (% change since 2000)
Houses renter occupied (%)
Houses renter occupied (% change since 2000)
Vacant housing units - For rent (%)
Vacant housing units - For rent (% change since 2000)
Vacant housing units - For sale only (%)
Vacant housing units - For sale only (% change since 2000)
Vacant housing units - Rented or sold, not occupied (%)
Vacant housing units - Rented or sold, not occupied (% change since 2000)
Vacant housing units - For seasonal, recreational, or occasional use (%)
Vacant housing units - For seasonal, recreational, or occasional use (% change since 2000)
Vacant housing units - For migrant workers (%)
Vacant housing units - For migrant workers (% change since 2000)
Vacant housing units - Other vacant (%)
Vacant housing units - Other vacant (% change since 2000)
Median monthly housing costs ($)
Median household income for houses/condos with a mortgage ($)
Median household income for houses/condos without a mortgage ($)
Median household income ($)
Median household income ($) - White
Median household income ($) - Black or African American
Median household income ($) - Asian
Median household income ($) - Hispanic or Latino
Median household income ($) - American Indian and Alaska Native
Median household income ($) - Multirace
Median household income ($) - Other Race
Mortgage status - with mortgage (%)
Mortgage status - with second mortgage (%)
Mortgage status - with home equity loan (%)
Mortgage status - with both second mortgage and home equity loan (%)
Mortgage status - without a mortgage (%)
Median year house/condo built
Median year apartment built
Household type by relationship - Male householder living alone (%)
Household type by relationship - Male householder not living alone (%)
Household type by relationship - Female householder living alone (%)
Household type by relationship - Female householder not living alone (%)
Household type by relationship - Opposite-Sex spouse (%)
Household type by relationship - Same-Sex spouse (%)
Household type by relationship - Opposite-Sex unmarried partner (%)
Household type by relationship - Same-Sex unmarried partner (%)
Household type by relationship - In group quarters (%)
Size of family households - 2-person household (%)
Size of family households - 3-person household (%)
Size of family households - 4-person household (%)
Size of family households - 5-person household (%)
Size of family households - 6-person household (%)
Size of family households - 7-or-more-person household (%)
Size of nonfamily households - 1-person household (%)
Size of nonfamily households - 2-person household (%)
Size of nonfamily households - 3-person household (%)
Size of nonfamily households - 4-person household (%)
Size of nonfamily households - 5-person household (%)
Size of nonfamily households - 6-person household (%)
Size of nonfamily households - 7-or-moreperson household (%)
Year house built - Built 2010 or later (%)
Year house built - Built 2000 to 2009 (%)
Year house built - Built 1990 to 1999 (%)
Year house built - Built 1980 to 1989 (%)
Year house built - Built 1970 to 1979 (%)
Year house built - Built 1960 to 1969 (%)
Year house built - Built 1950 to 1959 (%)
Year house built - Built 1940 to 1949 (%)
Year house built - Built 1939 or earlier (%)
Median number of rooms in houses and condos
Median number of rooms in apartments
Median number of bedrooms in owner occupied houses
Mean number of bedrooms in owner occupied houses
Median number of bedrooms in renter occupied houses
Mean number of bedrooms in renter occupied houses
Median number of vehichles in owner occupied houses
Mean number of vehichles in owner occupied houses
Median number of vehichles in renter occupied houses
Mean number of vehichles in renter occupied houses
Rooms in owner-occupied houses - 1 room (%)
Rooms in owner-occupied houses - 2 rooms (%)
Rooms in owner-occupied houses - 3 rooms (%)
Rooms in owner-occupied houses - 4 rooms (%)
Rooms in owner-occupied houses - 5 rooms (%)
Rooms in owner-occupied houses - 6 rooms (%)
Rooms in owner-occupied houses - 7 rooms (%)
Rooms in owner-occupied houses - 8 rooms (%)
Rooms in owner-occupied houses - 9+ rooms (%)
Rooms in renter-occupied houses - 1 room (%)
Rooms in renter-occupied houses - 2 rooms (%)
Rooms in renter-occupied houses - 3 rooms (%)
Rooms in renter-occupied houses - 4 rooms (%)
Rooms in renter-occupied houses - 5 rooms (%)
Rooms in renter-occupied houses - 6 rooms (%)
Rooms in renter-occupied houses - 7 rooms (%)
Rooms in renter-occupied houses - 8 rooms (%)
Rooms in renter-occupied houses - 9+ rooms (%)
Bedrooms in owner-occupied houses - no bedrooms (%)
Bedrooms in owner-occupied houses - 1 bedroom (%)
Bedrooms in owner-occupied houses - 2 bedrooms (%)
Bedrooms in owner-occupied houses - 3 bedrooms (%)
Bedrooms in owner-occupied houses - 4 bedrooms (%)
Bedrooms in owner-occupied houses - 5+ bedrooms (%)
Bedrooms in renter-occupied houses - no bedrooms (%)
Bedrooms in renter-occupied houses - 1 bedroom (%)
Bedrooms in renter-occupied houses - 2 bedrooms (%)
Bedrooms in renter-occupied houses - 3 bedrooms (%)
Bedrooms in renter-occupied houses - 4 bedrooms (%)
Bedrooms in renter-occupied houses - 5+ bedrooms (%)
Vehicles available in owner-occupied houses - no vehicle available (%)
Vehicles available in owner-occupied houses - 1 vehicle available(%)
Vehicles available in owner-occupied houses - 2 Vehicles available (%)
Vehicles available in owner-occupied houses - 3 Vehicles available (%)
Vehicles available in owner-occupied houses - 4 Vehicles available (%)
Vehicles available in owner-occupied houses - 5+ Vehicles available (%)
Vehicles available in renter-occupied houses - no vehicle available (%)
Vehicles available in renter-occupied houses - 1 vehicle available (%)
Vehicles available in renter-occupied houses - 2 Vehicles available (%)
Vehicles available in renter-occupied houses - 3 Vehicles available (%)
Vehicles available in renter-occupied houses - 4 Vehicles available (%)
Vehicles available in renter-occupied houses - 5+ Vehicles available (%)
Housing units in structures - 1, detached (%)
Housing units in structures - 1, attached (%)
Housing units in structures - 2 (%)
Housing units in structures - 3 or 4 (%)
Housing units in structures - 5 to 9 (%)
Housing units in structures - 10 to 19 (%)
Housing units in structures - 20 to 49 (%)
Housing units in structures - 50 or more (%)
Housing units in structures - Mobile home (%)
Housing units in structures - Boat, RV, van, etc. (%)
Housing units in structures - Owners - 1, detached (%)
Housing units in structures - Owners - 1, attached (%)
Housing units in structures - Owners - 2 (%)
Housing units in structures - Owners - 3 or 4 (%)
Housing units in structures - Owners - 5 to 9 (%)
Housing units in structures - Owners - 10 to 19 (%)
Housing units in structures - Owners - 20 to 49 (%)
Housing units in structures - Owners - 50 or more (%)
Housing units in structures - Owners - Mobile home (%)
Housing units in structures - Owners - Boat, RV, van, etc. (%)
Housing units in structures - Renters - 1, detached (%)
Housing units in structures - Renters - 1, attached (%)
Housing units in structures - Renters - 2 (%)
Housing units in structures - Renters - 3 or 4 (%)
Housing units in structures - Renters - 5 to 9 (%)
Housing units in structures - Renters - 10 to 19 (%)
Housing units in structures - Renters - 20 to 49 (%)
Housing units in structures - Renters - 50 or more (%)
Housing units in structures - Renters - Mobile home (%)
Housing units in structures - Renters - Boat, RV, van, etc. (%)
House/condo owner moved in on average (years ago)
Renter moved in on average (years ago)
Year householder moved into unit - Moved in 1999 to March 2000 (%)
Year householder moved into unit - Moved in 1999 to March 2000 (%) - White
Year householder moved into unit - Moved in 1999 to March 2000 (%) - Black or African American
Year householder moved into unit - Moved in 1999 to March 2000 (%) - Asian
Year householder moved into unit - Moved in 1999 to March 2000 (%) - Hispanic or Latino
Year householder moved into unit - Moved in 1999 to March 2000 (%) - American Indian and Alaska Native
Year householder moved into unit - Moved in 1999 to March 2000 (%) - Multirace
Year householder moved into unit - Moved in 1999 to March 2000 (%) - Other Race
Year householder moved into unit - Moved in 1995 to 1998 (%)
Year householder moved into unit - Moved in 1995 to 1998 (%) - White
Year householder moved into unit - Moved in 1995 to 1998 (%) - Black or African American
Year householder moved into unit - Moved in 1995 to 1998 (%) - Asian
Year householder moved into unit - Moved in 1995 to 1998 (%) - Hispanic or Latino
Year householder moved into unit - Moved in 1995 to 1998 (%) - American Indian and Alaska Native
Year householder moved into unit - Moved in 1995 to 1998 (%) - Multirace
Year householder moved into unit - Moved in 1995 to 1998 (%) - Other Race
Year householder moved into unit - Moved in 1990 to 1994 (%)
Year householder moved into unit - Moved in 1990 to 1994 (%) - White
Year householder moved into unit - Moved in 1990 to 1994 (%) - Black or African American
Year householder moved into unit - Moved in 1990 to 1994 (%) - Asian
Year householder moved into unit - Moved in 1990 to 1994 (%) - Hispanic or Latino
Year householder moved into unit - Moved in 1990 to 1994 (%) - American Indian and Alaska Native
Year householder moved into unit - Moved in 1990 to 1994 (%) - Multirace
Year householder moved into unit - Moved in 1990 to 1994 (%) - Other Race
Year householder moved into unit - Moved in 1980 to 1989 (%)
Year householder moved into unit - Moved in 1980 to 1989 (%) - White
Year householder moved into unit - Moved in 1980 to 1989 (%) - Black or African American
Year householder moved into unit - Moved in 1980 to 1989 (%) - Asian
Year householder moved into unit - Moved in 1980 to 1989 (%) - Hispanic or Latino
Year householder moved into unit - Moved in 1980 to 1989 (%) - American Indian and Alaska Native
Year householder moved into unit - Moved in 1980 to 1989 (%) - Multirace
Year householder moved into unit - Moved in 1980 to 1989 (%) - Other Race
Year householder moved into unit - Moved in 1970 to 1979 (%)
Year householder moved into unit - Moved in 1970 to 1979 (%) - White
Year householder moved into unit - Moved in 1970 to 1979 (%) - Black or African American
Year householder moved into unit - Moved in 1970 to 1979 (%) - Asian
Year householder moved into unit - Moved in 1970 to 1979 (%) - Hispanic or Latino
Year householder moved into unit - Moved in 1970 to 1979 (%) - American Indian and Alaska Native
Year householder moved into unit - Moved in 1970 to 1979 (%) - Multirace
Year householder moved into unit - Moved in 1970 to 1979 (%) - Other Race
Year householder moved into unit - Moved in 1969 or earlier (%)
Year householder moved into unit - Moved in 1969 or earlier (%) - White
Year householder moved into unit - Moved in 1969 or earlier (%) - Black or African American
Year householder moved into unit - Moved in 1969 or earlier (%) - Asian
Year householder moved into unit - Moved in 1969 or earlier (%) - Hispanic or Latino
Year householder moved into unit - Moved in 1969 or earlier (%) - American Indian and Alaska Native
Year householder moved into unit - Moved in 1969 or earlier (%) - Multirace
Year householder moved into unit - Moved in 1969 or earlier (%) - Other Race
Housing units lacking complete plumbing facilities (%)
Housing units lacking complete kitchen facilities (%)
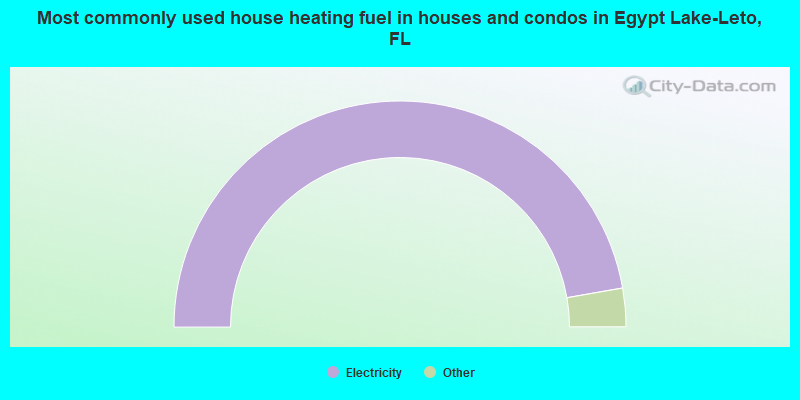
House heating fuel used in houses and condos - Utility gas (%)
House heating fuel used in houses and condos - Bottled, tank, or LP gas (%)
House heating fuel used in houses and condos - Electricity (%)
House heating fuel used in houses and condos - Fuel oil, kerosene, etc. (%)
House heating fuel used in houses and condos - Coal or coke (%)
House heating fuel used in houses and condos - Wood (%)
House heating fuel used in houses and condos - Solar energy (%)
House heating fuel used in houses and condos - Other fuel (%)
House heating fuel used in houses and condos - No fuel used (%)
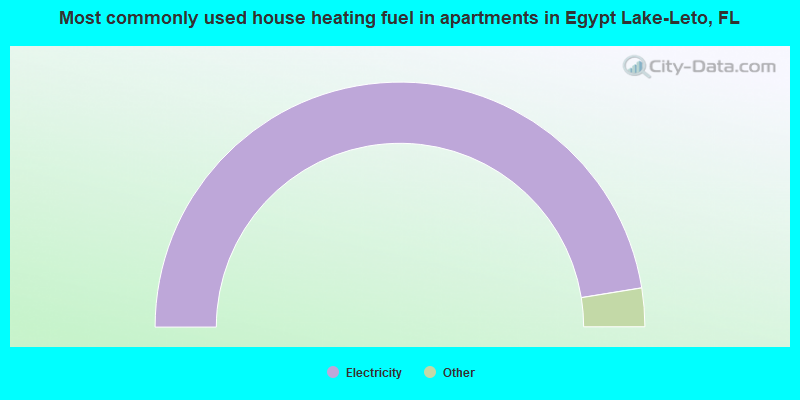
House heating fuel used in apartments - Utility gas (%)
House heating fuel used in apartments - Bottled, tank, or LP gas (%)
House heating fuel used in apartments - Electricity (%)
House heating fuel used in apartments - Fuel oil, kerosene, etc. (%)
House heating fuel used in apartments - Coal or coke (%)
House heating fuel used in apartments - Wood (%)
House heating fuel used in apartments - Solar energy (%)
House heating fuel used in apartments - Other fuel (%)
House heating fuel used in apartments - No fuel used (%)
Median year house/condo built: 1972Median year apartment built: 1983Household type by relationship:
Households: 37,096
Male householders: 7,212 (2,202 living alone ), Female householders: 7,598 (2,392 living alone )4,783 spouses (4,737 opposite-sex spouses ), 1,570 unmarried partners , (1,441 opposite-sex unmarried partners ), 9,734 children (8,864 natural , 191 adopted , 679 stepchildren ), 818 grandchildren , 938 brothers or sisters , 1,518 parents , 0 foster children , 893 other relatives , 1,872 non-relatives In group quarters: 155
Size of family households: 3,701 2-persons , 2,477 3-persons , 1,925 4-persons , 589 5-persons , 257 6-persons , 89 7-or-more-persons .
Size of nonfamily households: 4,419 1-person , 1,243 2-persons , 98 3-persons , 62 4-persons .
2,341 married couples with children. single-parent households (547 men , 1,736 women ).
34.6% of residents of Egypt Lake-Leto speak English at home. of residents speak Spanish at home (32% speak English very well , 19% speak English well , 24% speak English not well , 25% don't speak English at all ).of residents speak other Indo-European language at home (62% speak English very well , 20% speak English well , 12% speak English not well , 6% don't speak English at all ).of residents speak Asian or Pacific Island language at home (45% speak English very well , 31% speak English well , 20% speak English not well , 3% don't speak English at all ).of residents speak other language at home (68% speak English very well , 32% speak English well ).
Foreign born population: 16,872 (45.5%)of them are naturalized citizens )
Median number of rooms in houses and condos:
Median number of rooms in apartments
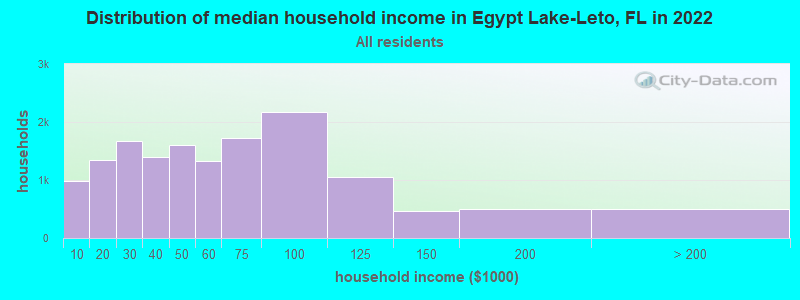
Egypt Lake-Leto, FL household income distribution 987 Less than $10,0001,349 $10,000 to $19,9991,674 $20,000 to $29,9991,398 $30,000 to $39,9991,600 $40,000 to $49,9991,328 $50,000 to $59,9991,731 $60,000 to $74,9992,173 $75,000 to $99,9991,058 $100,000 to $124,999458 $125,000 to $149,999494 $150,000 to $199,999501 $200,000 or more
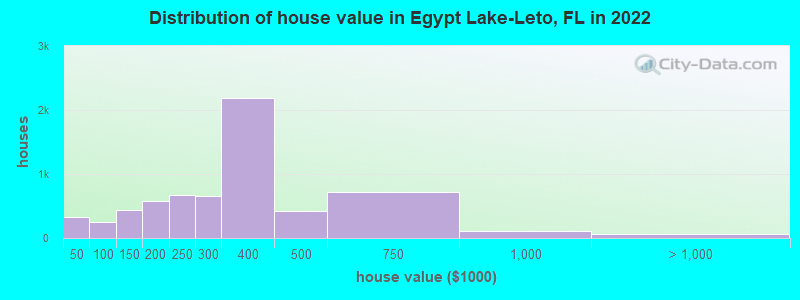
Home value of owner - occupied houses in 2022 in Egypt Lake-Leto, FL 112 Less than $10,0008 $15,000 to $19,999122 $25,000 to $29,99925 $35,000 to $39,99954 $40,000 to $49,99928 $60,000 to $69,99974 $70,000 to $79,99974 $80,000 to $89,99920 $90,000 to $99,999283 $100,000 to $124,999153 $125,000 to $149,999279 $150,000 to $174,999294 $175,000 to $199,999671 $200,000 to $249,999658 $250,000 to $299,9992,193 $300,000 to $399,999420 $400,000 to $499,999722 $500,000 to $749,999108 $750,000 to $999,99922 $1,000,000 to $1,499,99946 $1,500,000 to $1,999,999Rent paid by renters in 2022 in Egypt Lake-Leto, FL 26 $150 to $19911 $250 to $29914 $300 to $3499 $350 to $39922 $400 to $449130 $500 to $54925 $550 to $59971 $600 to $64911 $650 to $69955 $700 to $749443 $750 to $799577 $800 to $899567 $900 to $9992,507 $1,000 to $1,2491,078 $1,250 to $1,4991,429 $1,500 to $1,99927 $2,000 to $2,49919 $2,500 to $2,999147 No cash rent
Percentage of workers working in this county: 89.3%Number of people working at home: 2,430 (11.9% of all workers )
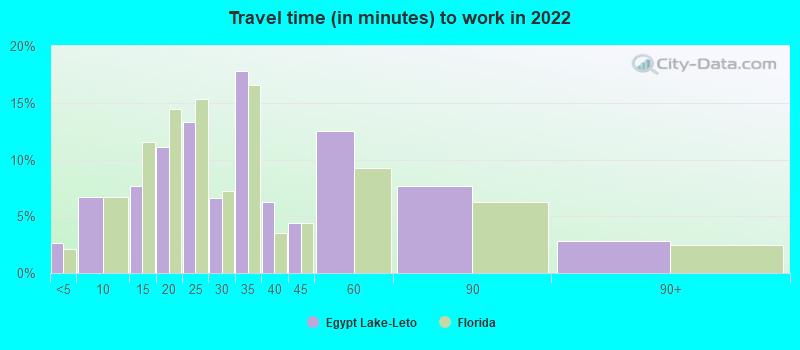
Travel time to work (commute)
Less than 5 minutes: 3265 to 9 minutes: 1,12810 to 14 minutes: 2,36415 to 19 minutes: 2,36620 to 24 minutes: 2,76025 to 29 minutes: 1,55930 to 34 minutes: 2,82535 to 39 minutes: 62740 to 44 minutes: 64845 to 59 minutes: 1,53760 to 89 minutes: 64090 or more minutes: 453
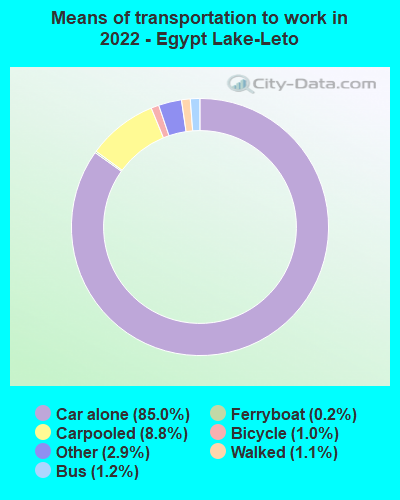
Means of transportation to work:
Drove a car alone: 8,798 (67.8%)Carpooled: 1,037 (8.0%)Bus : 85 (0.7%)Ferryboat: 19 (0.1%)Taxi: 343 (2.6%)Bicycle: 113 (0.9%)Walked: 103 (0.8%)Worked at home: 2,430 (18.7%)
Unemployment by race in 2022
Unemployment rate for White non-Hispanic residents 3.6% Males13.9% FemalesUnemployment rate for Black residents 0.3% Males4.2% FemalesUnemployment rate for other race residents 2.5% Males7.3% FemalesUnemployment rate for two or more race residents 1.9% Males5.9% FemalesUnemployment rate for Hispanic or Latino residents 4.9% Males6.5% Females
Year of entry for the foreign-born population in Egypt Lake-Leto, Florida
8,516 2010 or later 3,796 2000 to 2009 1,924 1990 to 1999 1,964 1980 to 1989 947 1970 to 1979 1,585 Before 1970
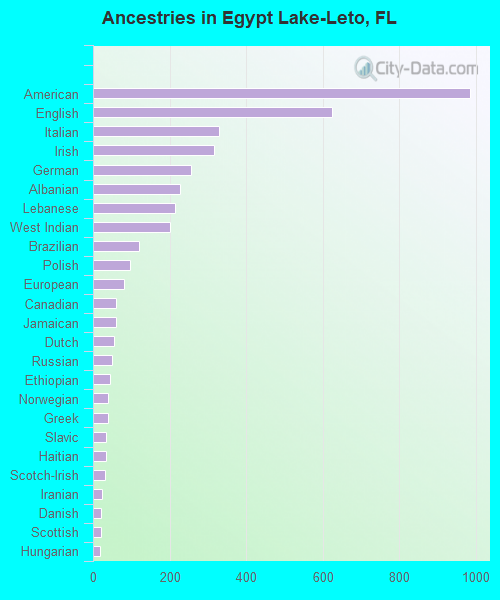
First ancestries reported:
American: 985 (4.2%)
English: 624 (2.6%)
Italian: 329 (1.4%)
Irish: 316 (1.3%)
German: 256 (1.1%)
Albanian: 227 (1.0%)
Lebanese: 213 (0.9%)
West Indian: 201 (0.9%)
Brazilian: 121 (0.5%)
Polish: 96 (0.4%)
European: 82 (0.3%)
Canadian: 60 (0.3%)
Jamaican: 60 (0.3%)
Dutch: 54 (0.2%)
Russian: 50 (0.2%)
Ethiopian: 45 (0.2%)
Norwegian: 39 (0.2%)
Greek: 38 (0.2%)
Slavic: 34 (0.1%)
Haitian: 33 (0.1%)
Scotch-Irish: 31 (0.1%)
Iranian: 24 (0.1%)
Danish: 20 (0.08%)
Scottish: 20 (0.08%)
Hungarian: 17 (0.07%)
Welsh: 12 (0.05%)
Armenian: 10 (0.04%) Most common places of birth for foreign-born residents (%): Cuba Egypt Lake-Leto:
59.1% (9,576)Florida:
22.0% (1,006,576)
Colombia Egypt Lake-Leto:
7.4% (1,195)Florida:
6.5% (298,669)
Venezuela Egypt Lake-Leto:
5.1% (826)Florida:
5.7% (262,042)
Dominican Republic Egypt Lake-Leto:
4.5% (737)Florida:
3.0% (137,727)
Vietnam Egypt Lake-Leto:
4.0% (650)Florida:
1.3% (60,604)
Mexico Egypt Lake-Leto:
2.3% (366)Florida:
5.6% (257,152)
Peru Egypt Lake-Leto:
1.6% (252)Florida:
2.1% (96,693)
Place of birth for U.S.-born residents:
This state: 10,523Other state: 6,764Northeast: 3,300Midwest: 1,355South: 1,426West: 746 85.3% of Egypt Lake-Leto residents lived in the same house 1 years ago.
Out of people who lived in different houses, 37.5% lived in this county.
Out of people who lived in different counties, 62.8% lived in Florida.
Egypt Lake-Leto:
85.3%State average:
86.3%
Education attainment for males 25 years and older:
No schooling: 631Nursery to 4th grade: 505th and 6th grade: 3227th and 8th grade: 5239th grade: 46810th grade: 24811th grade: 21912th grade, no diploma: 722High school graduate (or equivalency): 4,866Less than 1 year of college: 616Some college more than 1 year, no degree: 1,308Associate degree: 829Bachelor's degree: 2,229Master's degree: 479Professional school degree: 177Doctorate degree: 135
Education attainment for females 25 years and older:
No schooling: 175Nursery to 4th grade: 1315th and 6th grade: 3617th and 8th grade: 2369th grade: 21810th grade: 38711th grade: 15212th grade, no diploma: 620High school graduate (or equivalency): 4,679Less than 1 year of college: 550Some college more than 1 year, no degree: 1,430Associate degree: 1,163Bachelor's degree: 2,624Master's degree: 618Professional school degree: 186Doctorate degree: 196
Housing units in structures:
One, detached: 6,793One, attached: 1,034Two: 753 or 4: 1,6445 to 9: 1,98910 to 19: 2,01620 to 49: 79850 or more: 897Mobile homes: 264Boats, RVs, vans, etc.: 50Housing units lacking complete plumbing facilities in 2022: 0.6%Housing units lacking complete kitchen facilities in 2022: 0.4%House/condo owner moved in on average 11 years ago
Renter moved in on average 3 years ago
Private vs. public school enrollment:
Students in private schools in grades 1 to 8 (elementary and middle school): 349 Students in private schools in grades 9 to 12 (high school): 79 Students in private undergraduate colleges: 333