East St. Louis, IL (Illinois) Houses and Residents
| East St. Louis: | $59,133 |
| Illinois: | $251,600 |
Total population: 26,672 (All urban)
Houses: 10,931 (7,700 occupied: 4,065 owner occupied, 3,699 renter occupied)
| % of renters here: | 48% |
| State: | 33% |
Housing density: 777 houses/condos per square mile
Median price asked for vacant for-sale houses and condos in 2022: $297,327.
Median contract rent in 2022: $395 (lower quartile is $199, upper quartile is $651)
Median rent asked for vacant for-rent units in 2022: $469
Median gross rent in East St. Louis, IL in 2022: $577
Housing units in East St. Louis with a mortgage: 1,292 (55 second mortgage, 0 home equity loan, 42 both second mortgage and home equity loan)
Houses without a mortgage: 39
Median household income for houses/condos with a mortgage: $42,651
Median household income for apartments without a mortgage: $53,045
Median monthly housing costs: $597
Compare current foreclosures near East St. Louis, IL:
| Photo | Address | Area | Beds / Baths | Price | Details |
|---|---|---|---|---|---|

|
#1
E Milton Ave
Saint Louis, MO 63114
|
1,325 sq. feet
|
1 baths 2 beds |
$184,900
|
show details |

|
#2
N 46th St
East Saint Louis, IL 62204
|
1,218 sq. feet
|
1 baths 3 beds |
$1
|
show details |

|
#3
Bagley Dr
Saint Louis, MO 63136
|
982 sq. feet
|
1 baths 2 beds |
$119,900
|
show details |

|
#4
Saint Charles St Apt 801
Saint Louis, MO 63101
|
1,688 sq. feet
|
2 baths 1 beds |
$154,900
|
show details |

|
#5
N New Florissant Roa
Florissant, MO 63031
|
840 sq. feet
|
1 baths 2 beds |
$167,000
|
show details |

|
#6
N 15th St
Belleville, IL 62220
|
1,467 sq. feet
|
1 baths 4 beds |
$154,900
|
show details |

|
#7
Rosewood Ave
Saint Louis, MO 63120
|
1,152 sq. feet
|
1 baths 2 beds |
$125,000
|
show details |

|
#8
Jerries Ln
Saint Louis, MO 63136
|
1,380 sq. feet
|
1 baths 3 beds |
$219,900
|
show details |

|
#9
Grimshaw Ave
Saint Louis, MO 63120
|
914 sq. feet
|
1 baths 1 beds |
$16,000
|
show details |

|
#10
Lucinda Dr
Fairview Heights, IL 62208
|
1,040 sq. feet
|
2 baths 2 beds |
$157,900
|
show details |
| Photo | Address | Area | Beds / Baths | Price | Details |
|---|---|---|---|---|---|

|
#11
Aqueduct Dr
Florissant, MO 63033
|
1,197 sq. feet
|
2 baths 3 beds |
$259,000
|
show details |

|
#12
W Saint Anthony Ln
Florissant, MO 63031
|
1,224 sq. feet
|
1 baths 3 beds |
$207,000
|
show details |

|
#13
Hodiamont Ave # E4
Saint Louis, MO 63112
|
1 sq. feet
|
2 baths 2 beds |
$167,000
|
show details |

|
#14
Cunniff Pl
Saint Louis, MO 63135
|
1,596 sq. feet
|
1 baths 3 beds |
$84,900
|
show details |

|
#15
Partridge Run Dr
Florissant, MO 63033
|
1,140 sq. feet
|
1 baths 2 beds |
$113,000
|
show details |

|
#16
Concord Pl
Saint Louis, MO 63147
|
768 sq. feet
|
1 baths 2 beds |
$59,900
|
show details |

|
#17
Hillcrest Dr
Glen Carbon, IL 62034
|
1,425 sq. feet
|
2 baths 3 beds |
$265,000
|
show details |

|
#18
Sims Ave
Saint Louis, MO 63114
|
1,278 sq. feet
|
1 baths 3 beds |
$195,000
|
show details |

|
#19
Deer St
Saint Louis, MO 63113
|
1,646 sq. feet
|
1 baths 3 beds |
$250,000
|
show details |

|
#20
Fort Henry Rd
Belleville, IL 62221
|
1,800 sq. feet
|
2 baths 3 beds |
$229,000
|
show details |
| Photo | Address | Area | Beds / Baths | Price | Details |
|---|---|---|---|---|---|

|
#21
N 55th St
East Saint Louis, IL 62204
|
672 sq. feet
|
1 baths 2 beds |
$1
|
show details |

|
#22
Burgen Ave
Saint Louis, MO 63116
|
960 sq. feet
|
1 baths 2 beds |
$83,200
|
show details |

|
#23
West Blvd
Belleville, IL 62221
|
1,462 sq. feet
|
2 baths 2 beds |
$187,900
|
show details |

|
#24
W Adams St
O Fallon, IL 62269
|
905 sq. feet
|
1 baths 2 beds |
$172,000
|
show details |

|
#25
Velma Ave
South Roxana, IL 62087
|
1,008 sq. feet
|
1 baths 3 beds |
$29,900
|
show details |

|
#26
Idaho Ave
Saint Louis, MO 63111
|
979 sq. feet
|
1 baths 2 beds |
$129,900
|
show details |

|
#27
State Route 159
Smithton, IL 62285
|
1,916 sq. feet
|
2 baths 3 beds |
$261,000
|
show details |

|
#28
Louisiana Ave
Saint Louis, MO 63118
|
2,360 sq. feet
|
2 baths 2 beds |
$187,000
|
show details |

|
#29
Frey Ln
Fairview Heights, IL 62208
|
1,258 sq. feet
|
2 baths 3 beds |
$165,000
|
show details |

|
#30
Ridge Ave
Saint Louis, MO 63113
|
1,868 sq. feet
|
2 baths 6 beds |
$114,900
|
show details |
| Photo | Address | Area | Beds / Baths | Price | Details |
|---|---|---|---|---|---|

|
#31
Lothian Cir
Saint Louis, MO 63137
|
1,044 sq. feet
|
1 baths 2 beds |
$99,900
|
show details |

|
#32
S 18th St
Belleville, IL 62226
|
- sq. feet
|
1 baths 4 beds |
$47,250
|
show details |

|
#33
Washington Ave
Saint Louis, MO 63101
|
- sq. feet
|
2 baths 2 beds |
$229,900
|
show details |

|
#34
Hamilton Ave
Saint Louis, MO 63136
|
832 sq. feet
|
1 baths 2 beds |
$17,900
|
show details |

|
#35
Oregon Ave
Saint Louis, MO 63118
|
1,782 sq. feet
|
2 baths - beds |
$12,000
|
show details |

|
#36
Optimist Dr
Belleville, IL 62220
|
- sq. feet
|
1 baths 3 beds |
$57,200
|
show details |

|
#37
Marshall Ave
Saint Louis, MO 63114
|
- sq. feet
|
1 baths 2 beds |
$62,400
|
show details |

|
#38
Northland Pl
Saint Louis, MO 63113
|
1,736 sq. feet
|
1 baths - beds |
$23,900
|
show details |

|
#39
Edwards St
Granite City, IL 62040
|
828 sq. feet
|
- baths 2 beds |
$39,900
|
show details |

|
#40
Grover St
Saint Louis, MO 63112
|
792 sq. feet
|
1 baths - beds |
$12,000
|
show details |
| Photo | Address | Area | Beds / Baths | Price | Details |
|---|---|---|---|---|---|

|
#41
Summit Pl
Saint Louis, MO 63136
|
1,039 sq. feet
|
1 baths - beds |
$15,900
|
show details |

|
#42
Paris Ave
Saint Louis, MO 63115
|
1,650 sq. feet
|
1 baths - beds |
$24,900
|
show details |

|
#43
Lafayette Ave Unit 116
Saint Louis, MO 63104
|
1,017 sq. feet
|
2 baths 2 beds |
show details | |

|
#44
Bellefontaine Rd
Saint Louis, MO 63137
|
1,152 sq. feet
|
1 baths 2 beds |
show details | |

|
#45
Mcclintock Ave
Belleville, IL 62221
|
1,000 sq. feet
|
2 baths 2 beds |
show details | |

|
#46
Virginia Ave
Saint Louis, MO 63111
|
2,220 sq. feet
|
2 baths 3 beds |
show details | |

|
#47
Enright Ave
Saint Louis, MO 63108
|
2,122 sq. feet
|
2 baths 3 beds |
show details | |

|
#48
Westminster Pl
Saint Louis, MO 63112
|
1,974 sq. feet
|
3 baths 4 beds |
show details | |

|
#49
Belaire Pl
Saint Louis, MO 63121
|
1,519 sq. feet
|
1 baths 4 beds |
show details | |

|
Check over 1 million property listings on Foreclosure.com!
|
browse all offers | |||


 | East St. Louis... what happened there? (79 replies) |
| Thinking of moving to Illinois (77 replies) |
| Liberal Southern Illinois Cities? (23 replies) |
| Belleville vs Edwardsville vs O'Fallon (14 replies) |
| Medical professional working at Loyola hosp. needs advice regarding loctation and purchase vs. renting (155 replies) |
| How bad does the ‘Illinois Exodus’ have to get? (260 replies) |

Median year apartment built: 1969
Household type by relationship:
Households: 18,494- Male householders: 2,406 (1,228 living alone), Female householders: 5,146 (2,473 living alone)
1,021 spouses (1,005 opposite-sex spouses), 345 unmarried partners, (328 opposite-sex unmarried partners), 5,457 children (5,070 natural, 280 adopted, 106 stepchildren), 1,227 grandchildren, 640 brothers or sisters, 87 parents, 0 foster children, 1,381 other relatives, 647 non-relatives
- In group quarters: 132
Size of family households: 1,621 2-persons, 1,008 3-persons, 609 4-persons, 247 5-persons, 77 6-persons, 76 7-or-more-persons.
Size of nonfamily households: 3,449 1-person, 411 2-persons, 23 3-persons, 17 7-or-more-persons.
138 married couples with children.
2,195 single-parent households (235 men, 1,960 women).
98.5% of residents of East St. Louis speak English at home.
0.6% of residents speak Spanish at home (66% speak English very well, 23% speak English well, 11% speak English not well).
0.5% of residents speak other Indo-European language at home (100% speak English well).
Foreign born population: 215 (1.2%)
(79.5% of them are naturalized citizens)
| Here: | 5.6 |
| State: | 6.4 |
| Here: | 4.1 |
| State: | 4.1 |

- Bedrooms in owner-occupied houses and condos in East St. Louis, Illinois
- 15no bedroom
- 2101 bedroom
- 1,3842 bedrooms
- 1,7663 bedrooms
- 3894 bedrooms
- 3005+ bedrooms

- Bedrooms in renter-occupied apartments in East St. Louis, Illinois
- 308no bedroom
- 1,0511 bedroom
- 1,2162 bedrooms
- 8413 bedrooms
- 1594 bedrooms
- 1255+ bedrooms

- Cars and other vehicles available in East St. Louis in owner-occupied houses/condos
- 319no vehicle
- 1,9361 vehicle
- 1,0552 vehicles
- 4443 vehicles
- 2314 vehicles
- 815+ vehicles

- Cars and other vehicles available in East St. Louis in renter-occupied apartments
- 1,437no vehicle
- 1,8821 vehicle
- 3542 vehicles
- 263 vehicles
- 04 vehicles
- 05+ vehicles

- Rooms in owner-occupied houses in East St. Louis, Illinois
- 151 room
- 02 rooms
- 613 rooms
- 7354 rooms
- 9545 rooms
- 1,0996 rooms
- 5597 rooms
- 2728 rooms
- 3709+ rooms

- Rooms in renter-occupied apartments in East St. Louis, Illinois
- 3081 room
- 1042 rooms
- 8523 rooms
- 9834 rooms
- 7315 rooms
- 3886 rooms
- 657 rooms
- 618 rooms
- 2079+ rooms


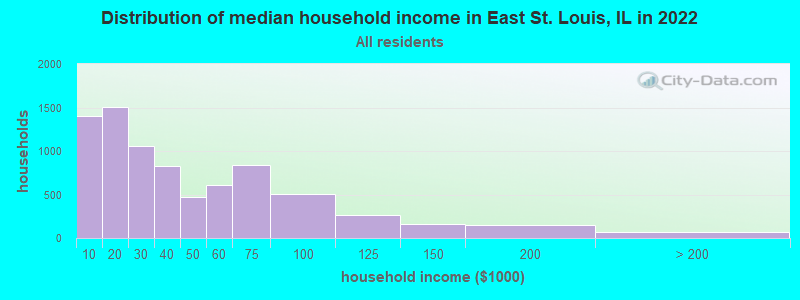
East St. Louis, IL household income distribution

- 1,405Less than $10,000
- 1,509$10,000 to $19,999
- 1,058$20,000 to $29,999
- 831$30,000 to $39,999
- 477$40,000 to $49,999
- 607$50,000 to $59,999
- 837$60,000 to $74,999
- 505$75,000 to $99,999
- 263$100,000 to $124,999
- 164$125,000 to $149,999
- 153$150,000 to $199,999
- 72$200,000 or more
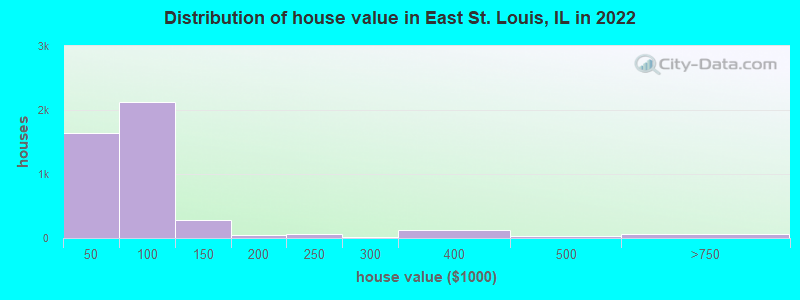
Home value of owner - occupied houses in 2022 in East St. Louis, IL
-
- 135Less than $10,000
- 261$10,000 to $14,999
- 118$15,000 to $19,999
- 59$20,000 to $24,999
- 56$25,000 to $29,999
- 343$30,000 to $34,999
- 110$35,000 to $39,999
- 551$40,000 to $49,999
- 478$50,000 to $59,999
- 393$60,000 to $69,999
- 239$70,000 to $79,999
- 331$80,000 to $89,999
- 123$90,000 to $99,999
- 211$100,000 to $124,999
- 72$125,000 to $149,999
- 8$150,000 to $174,999
- 34$175,000 to $199,999
- 64$200,000 to $249,999
- 14$250,000 to $299,999
- 122$300,000 to $399,999
- 28$400,000 to $499,999
- 38$500,000 to $749,999
- 7$750,000 to $999,999
- 19$2,000,000 or more
Rent paid by renters in 2022 in East St. Louis, IL
-
- 297Less than $100
- 136$100 to $149
- 323$150 to $199
- 248$200 to $249
- 181$250 to $299
- 21$300 to $349
- 198$350 to $399
- 511$400 to $449
- 152$450 to $499
- 366$500 to $549
- 107$550 to $599
- 242$600 to $649
- 47$650 to $699
- 34$700 to $749
- 117$750 to $799
- 199$800 to $899
- 45$900 to $999
- 135$1,000 to $1,249
- 12$1,500 to $1,999
- 192No cash rent


Percentage of workers working in this county: 64.2%
Number of people working at home: 626 (9.5% of all workers)
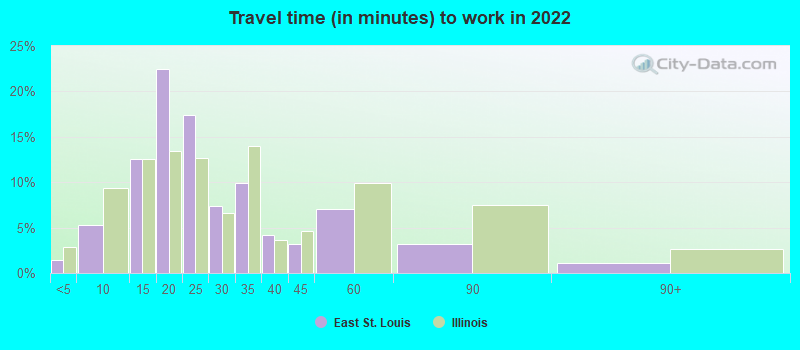
Travel time to work (commute)
- Less than 5 minutes: 20
- 5 to 9 minutes: 298
- 10 to 14 minutes: 849
- 15 to 19 minutes: 1,692
- 20 to 24 minutes: 1,092
- 25 to 29 minutes: 196
- 30 to 34 minutes: 921
- 35 to 39 minutes: 120
- 40 to 44 minutes: 70
- 45 to 59 minutes: 168
- 60 to 89 minutes: 216
- 90 or more minutes: 67
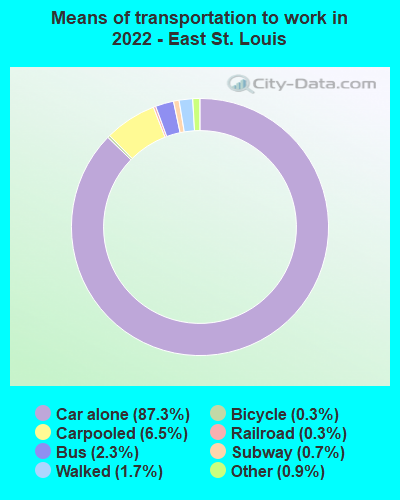
Means of transportation to work:
- Drove a car alone: 5,119 (74.3%)
- Carpooled: 463 (6.7%)
- Bus: 86 (1.2%)
- Long-distance train or commuter rail: 46 (0.7%)
- Light rail, streetcar or trolley: 37 (0.5%)
- Taxi: 83 (1.2%)
- Bicycle: 20 (0.3%)
- Walked: 190 (2.8%)
- Worked at home: 626 (9.1%)

- Unemployment by race in 2022
- Unemployment rate for Black residents
- 36.0%Males
- 12.8%Females
- Unemployment rate for two or more race residents
- 9.9%Males

- Year of entry for the foreign-born population in East St. Louis, Illinois
- 482010 or later
- 1152000 to 2009
- 241990 to 1999
- 81980 to 1989
- 241970 to 1979
- 27Before 1970
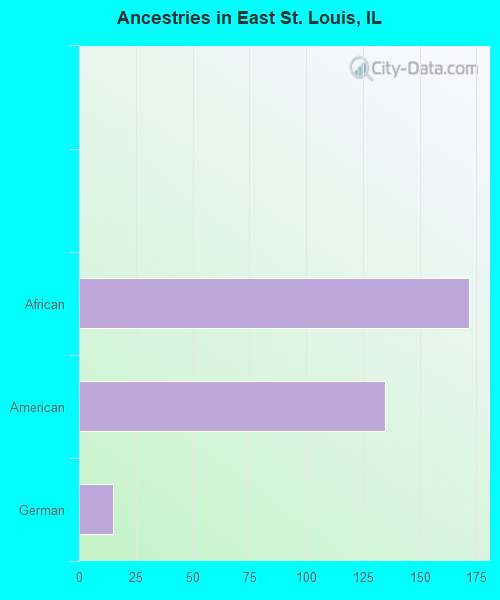
First ancestries reported:
- African: 172 (1.4%)
- American: 135 (1.1%)
- German: 15 (0.1%)
- Dutch: 1 (0.01%)
Most common places of birth for foreign-born residents (%):
| East St. Louis: | 35.8% (82) |
| Illinois: | 9.2% (166,409) |
| East St. Louis: | 22.3% (51) |
| Illinois: | 0.1% (2,412) |
| East St. Louis: | 19.2% (44) |
| Illinois: | 1.6% (29,519) |
| East St. Louis: | 10.5% (24) |
| Illinois: | 34.7% (626,958) |
| East St. Louis: | 9.2% (21) |
| Illinois: | 2.2% (40,393) |
| East St. Louis: | 3.9% (9) |
| Illinois: | 1.0% (18,753) |
| East St. Louis: | 3.1% (7) |
| Illinois: | 0.3% (4,775) |
Place of birth for U.S.-born residents:
- This state: 10,882
- Other state: 7,378
- Northeast: 11
- Midwest: 3,629
- South: 2,891
- West: 656
93.6% of East St. Louis residents lived in the same house 1 years ago.
Out of people who lived in different houses, 22.3% lived in this county.
Out of people who lived in different counties, 28.3% lived in Illinois.
| East St. Louis: | 93.6% |
| State average: | 88.3% |
Education attainment for males 25 years and older:
- No schooling: 165
- Nursery to 4th grade: 0
- 5th and 6th grade: 10
- 7th and 8th grade: 32
- 9th grade: 50
- 10th grade: 80
- 11th grade: 232
- 12th grade, no diploma: 236
- High school graduate (or equivalency): 2,389
- Less than 1 year of college: 445
- Some college more than 1 year, no degree: 734
- Associate degree: 290
- Bachelor's degree: 577
- Master's degree: 254
- Professional school degree: 161
- Doctorate degree: 0

Education attainment for females 25 years and older:
- No schooling: 218
- Nursery to 4th grade: 38
- 5th and 6th grade: 54
- 7th and 8th grade: 255
- 9th grade: 104
- 10th grade: 174
- 11th grade: 412
- 12th grade, no diploma: 571
- High school graduate (or equivalency): 2,830
- Less than 1 year of college: 639
- Some college more than 1 year, no degree: 1,119
- Associate degree: 863
- Bachelor's degree: 445
- Master's degree: 274
- Professional school degree: 12
- Doctorate degree: 18


Housing units in structures:
- One, detached: 6,789
- One, attached: 176
- Two: 533
- 3 or 4: 1,032
- 5 to 9: 1,221
- 10 to 19: 139
- 20 to 49: 362
- 50 or more: 628
- Mobile homes: 47
Housing units lacking complete kitchen facilities in 2022: 11.2%
House/condo owner moved in on average 31 years ago
Renter moved in on average 6 years ago

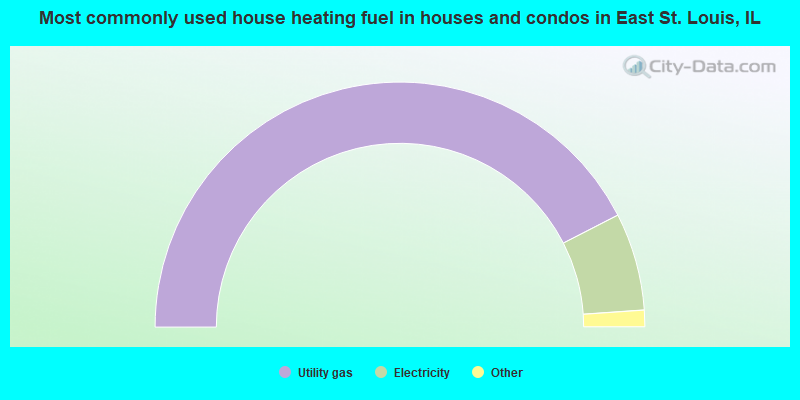
- 85.0%Utility gas
- 12.9%Electricity
- 1.1%Fuel oil, kerosene, etc.
- 0.7%No fuel used
- 0.3%Bottled, tank, or LP gas
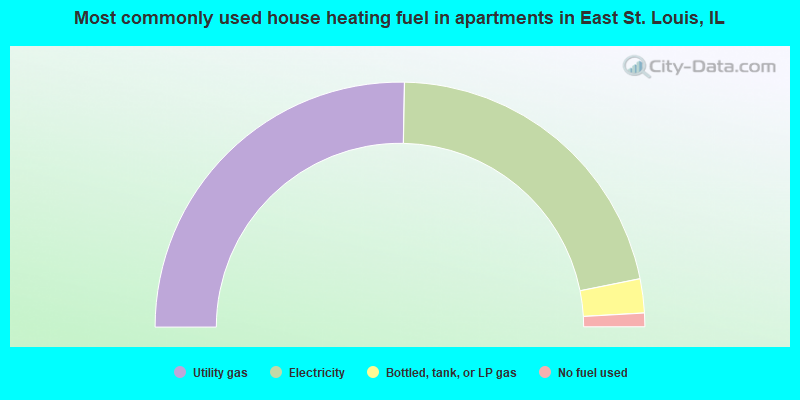
- 50.6%Utility gas
- 43.1%Electricity
- 4.5%Bottled, tank, or LP gas
- 1.8%No fuel used
Private vs. public school enrollment:
| Here: | 10.5% |
| Illinois: | 13.3% |
| Here: | 2.1% |
| Illinois: | 9.9% |
| Here: | 11.3% |
| Illinois: | 27.4% |


