Housing density: 921 houses/condos per square mile
Median price asked for vacant for-sale houses and condos in 2022 in this county: $843,880.
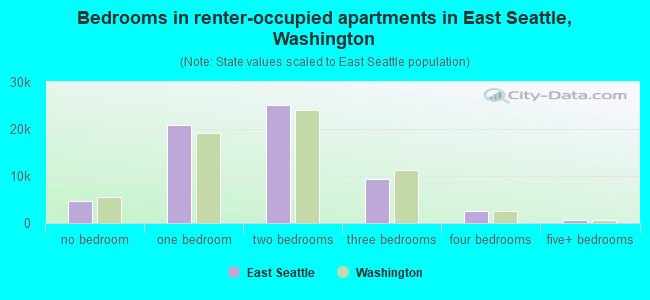
Median contract rent in 2022: over $2,000 (lower quartile is $1,617, upper quartile is over $2,000)
Median rent asked for vacant for-rent units in 2022: $2,412
Median gross rent in East Seattle, WA in 2022: over $2,000
Housing units in East Seattle with a mortgage: 85,751 (9,796 second mortgage, 11,674 home equity loan, 352 both second mortgage and home equity loan) Houses without a mortgage: 22,582
Compare current foreclosures near East Seattle, WA:
In family households: 1,455,162 (324,509 male householders, 137,001 female householders)
357,491 spouses, 491,900 children (462,739 natural, 12,743 adopted, 16,418 stepchildren), 22,208 grandchildren, 21,116 brothers or sisters, 17,956 parents, foster children, 25,527 other relatives, 45,636 non-relatives
In nonfamily households: 438,956 (162,683 male householders (115,616 living alone)), 165,039 female householders (129,083 living alone)), 111,234 nonrelatives
In group quarters: 37,131 (10,490 institutionalized population)
277,933 married couples with children.
81,653 single-parent households (19,170 men, 62,483 women).
81.6% of residents of East Seattle speak English at home.
3.8% of residents speak Spanish at home (53% speak English very well, 21% speak English well, 20% speak English not well, 5% don't speak English at all).
5.7% of residents speak other Indo-European language at home (66% speak English very well, 21% speak English well, 9% speak English not well, 3% don't speak English at all).
8.3% of residents speak Asian or Pacific Island language at home (52% speak English very well, 30% speak English well, 15% speak English not well, 3% don't speak English at all).
0.7% of residents speak other language at home (71% speak English very well, 22% speak English well, 6% speak English not well, 1% don't speak English at all).
Foreign born population: 171,099 (27.3%)
(48.6% of them are naturalized citizens)
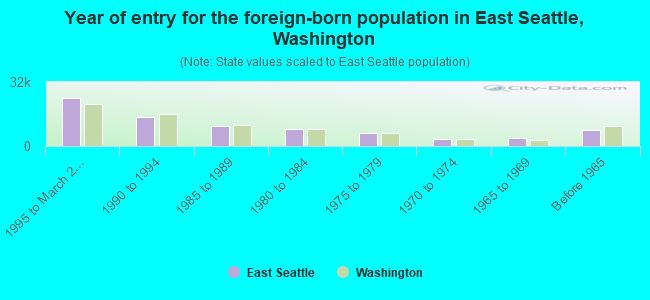
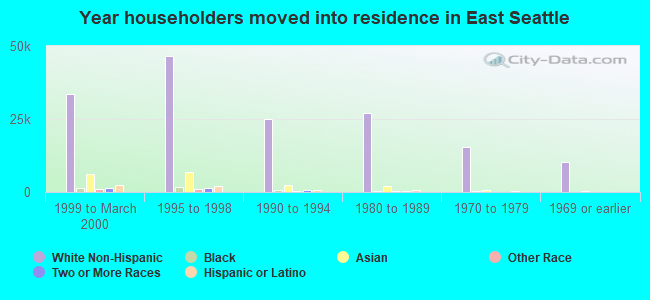
Year of entry for the foreign-born population in East Seattle, Washington
24,2261995 to March 2000
14,4681990 to 1994
10,1591985 to 1989
8,3011980 to 1984
6,6531975 to 1979
3,2881970 to 1974
4,0711965 to 1969
7,951Before 1965
Most common places of birth for foreign-born residents (%):
Mexico
East Seattle:
9.3% (7,384)
Washington:
24.1% (148,115)
Canada
East Seattle:
8.6% (6,794)
Washington:
7.7% (47,568)
Vietnam
East Seattle:
7.0% (5,521)
Washington:
6.7% (40,879)
China, excluding Hong Kong and Taiwan
East Seattle:
6.7% (5,262)
Washington:
3.3% (20,530)
Korea
East Seattle:
5.6% (4,463)
Washington:
6.2% (38,172)
India
East Seattle:
5.6% (4,425)
Washington:
2.4% (14,714)
Philippines
East Seattle:
5.3% (4,210)
Washington:
7.6% (46,733)
United Kingdom
East Seattle:
4.6% (3,636)
Washington:
3.3% (20,321)
Japan
East Seattle:
4.3% (3,373)
Washington:
2.8% (16,936)
Taiwan
East Seattle:
3.6% (2,872)
Washington:
1.4% (8,353)
Germany
East Seattle:
2.7% (2,133)
Washington:
3.4% (21,167)
Hong Kong
East Seattle:
2.6% (2,058)
Washington:
1.0% (6,263)
Russia
East Seattle:
2.4% (1,877)
Washington:
2.5% (15,491)
Iran
East Seattle:
2.3% (1,852)
Washington:
0.7% (4,573)
Ukraine
East Seattle:
2.1% (1,678)
Washington:
3.0% (18,572)
Romania
East Seattle:
1.8% (1,420)
Washington:
0.7% (4,345)
Other Eastern Europe
East Seattle:
1.6% (1,237)
Washington:
1.2% (7,645)
Place of birth for U.S.-born residents:
This state: 195,786
Other state: 198,773
Northeast: 26,250
Midwest: 56,420
South: 28,547
West: 87,556
52% of East Seattle residents lived in the same house 5 years ago. Out of people who lived in different houses, 62% lived in this county. Out of people who lived in different counties, 31% lived in Washington.
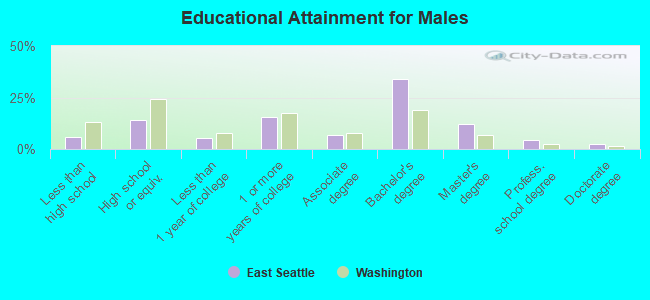
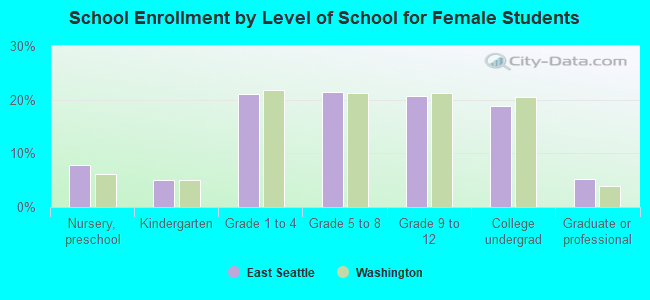
Education attainment for males 25 years and older:
No schooling: 727
Nursery to 4th grade: 242
5th and 6th grade: 771
7th and 8th grade: 1,197
9th grade: 816
10th grade: 1,244
11th grade: 1,270
12th grade, no diploma: 2,877
High school graduate (or equivalency): 22,399
Less than 1 year of college: 8,371
Some college more than 1 year, no degree: 24,895
Associate degree: 10,655
Bachelor's degree: 54,045
Master's degree: 19,380
Professional school degree: 6,675
Doctorate degree: 4,123
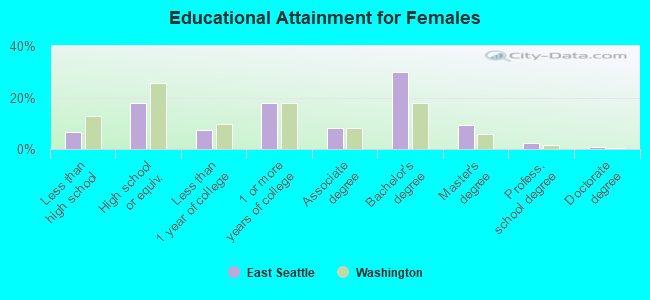
Education attainment for females 25 years and older:
No schooling: 1,106
Nursery to 4th grade: 460
5th and 6th grade: 836
7th and 8th grade: 1,504
9th grade: 1,024
10th grade: 1,669
11th grade: 1,293
12th grade, no diploma: 2,997
High school graduate (or equivalency): 30,050
Less than 1 year of college: 12,334
Some college more than 1 year, no degree: 30,417
Associate degree: 14,104
Bachelor's degree: 50,663
Master's degree: 15,515
Professional school degree: 3,649
Doctorate degree: 1,437
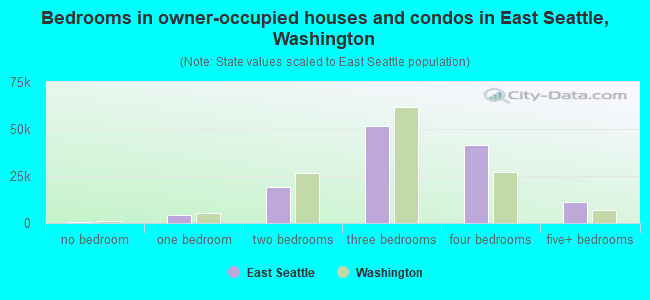
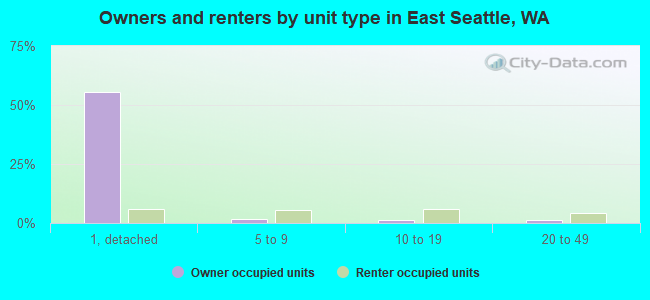
Housing units in structures:
One, detached: 120,349
One, attached: 9,021
Two: 1,995
3 or 4: 7,574
5 to 9: 14,733
10 to 19: 15,251
20 to 49: 11,512
50 or more: 15,791
Mobile homes: 3,598
Boats, RVs, vans, etc.: 109
Median worth of mobile homes: $124,102
Housing units lacking complete plumbing facilities: 0.3%
Housing units lacking complete kitchen facilities: 0.8%