East San Gabriel Valley, CA (California) Houses and Residents
| East San Gabriel Valley: | $719,200 |
| California: | $715,900 |
Total population: 952,352 (Urban population: 931,192, Rural population: 2,365 (15 farm, 2,350 nonfarm))
Houses: 270,240 (263,338 occupied: 180,683 owner occupied, 82,655 renter occupied)
| % of renters here: | 31% |
| State: | 44% |
Housing density: 1,271 houses/condos per square mile
Median price asked for vacant for-sale houses and condos in 2022 in this county: $1,291,802.
Median contract rent in 2022: $1,841 (lower quartile is $1,322, upper quartile is over $2,000)
Median rent asked for vacant for-rent units in 2022: $2,031
Median gross rent in East San Gabriel Valley, CA in 2022: $1,994
Housing units in East San Gabriel Valley with a mortgage: 136,243 (21,150 second mortgage, 11,429 home equity loan, 515 both second mortgage and home equity loan)
Houses without a mortgage: 26,635
Compare current foreclosures near East San Gabriel Valley, CA:
| Photo | Address | Area | Beds / Baths | Price | Details |
|---|---|---|---|---|---|

|
#1
Millbury Ave
Baldwin Park, CA 91706
|
1,632 sq. feet
|
2 baths 4 beds |
$850,000
|
show details |

|
#2
E Norma Ave
West Covina, CA 91791
|
1,134 sq. feet
|
2 baths 3 beds |
$599,000
|
show details |

|
#3
Victoria St
Rancho Cucamonga, CA 91701
|
3,412 sq. feet
|
2 baths 4 beds |
$951,600
|
show details |

|
#4
E Holton St
West Covina, CA 91791
|
- sq. feet
|
2 baths 3 beds |
$450,000
|
show details |

|
#5
Celebration St
Chino, CA 91708
|
1,644 sq. feet
|
2 baths 3 beds |
show details | |

|
#6
E Jackson Ave Unit C
Anaheim, CA 92806
|
1,266 sq. feet
|
2 baths 3 beds |
show details | |

|
#7
Talbot Dr
La Mirada, CA 90638
|
505 sq. feet
|
1 baths 1 beds |
show details | |

|
#8
Richards Pl
Upland, CA 91784
|
2,863 sq. feet
|
4 baths 4 beds |
show details | |

|
#9
Cinnamon Ln # 71
Duarte, CA 91010
|
993 sq. feet
|
2 baths 2 beds |
show details | |

|
#10
Hermanos St
Pasadena, CA 91107
|
1,679 sq. feet
|
1 baths 2 beds |
show details |
| Photo | Address | Area | Beds / Baths | Price | Details |
|---|---|---|---|---|---|

|
#11
Paseo Panorama
Yorba Linda, CA 92887
|
2,278 sq. feet
|
3 baths 4 beds |
show details | |

|
#12
Cumberland Ln
Pomona, CA 91766
|
1,152 sq. feet
|
2 baths 3 beds |
show details | |

|
#13
La Subida Dr Apt 4
Hacienda Heights, CA 91745
|
1,379 sq. feet
|
2 baths 2 beds |
show details | |

|
#14
Daroca Ave
San Gabriel, CA 91775
|
1,318 sq. feet
|
2 baths 2 beds |
show details | |

|
#15
Pamela Kay Ln
La Puente, CA 91746
|
1,040 sq. feet
|
2 baths 3 beds |
show details | |

|
#16
Simon St
Fullerton, CA 92833
|
3,202 sq. feet
|
2 baths 5 beds |
show details | |

|
#17
E I St
Ontario, CA 91764
|
1,200 sq. feet
|
2 baths 4 beds |
show details | |

|
#18
Scripps Dr
Claremont, CA 91711
|
1,568 sq. feet
|
2 baths 3 beds |
show details | |

|
#19
Fonseca Ave
La Mirada, CA 90638
|
1,316 sq. feet
|
2 baths 3 beds |
show details | |

|
#20
Sierra Crest Way
Hacienda Heights, CA 91745
|
1,611 sq. feet
|
3 baths 3 beds |
show details |
| Photo | Address | Area | Beds / Baths | Price | Details |
|---|---|---|---|---|---|

|
#21
N Vera Cruz St
Montebello, CA 90640
|
1,701 sq. feet
|
2 baths 3 beds |
show details | |

|
#22
S Indian Hill Blvd Apt B
Claremont, CA 91711
|
1,088 sq. feet
|
2 baths 2 beds |
show details | |

|
#23
Ravenna Ct
Chino Hills, CA 91709
|
2,571 sq. feet
|
3 baths 4 beds |
show details | |

|
#24
Ledgestone Ln
Pomona, CA 91767
|
1,618 sq. feet
|
3 baths 3 beds |
show details | |

|
#25
Malvern Ave
Fullerton, CA 92832
|
1,532 sq. feet
|
1 baths 3 beds |
show details | |

|
#26
Valley View Ave
Pasadena, CA 91107
|
2,504 sq. feet
|
3 baths 4 beds |
show details | |

|
#27
S Calaveras Pl
Ontario, CA 91761
|
1,502 sq. feet
|
2 baths 4 beds |
show details | |

|
#28
Molokai Dr
Placentia, CA 92870
|
1,300 sq. feet
|
3 baths 2 beds |
show details | |

|
#29
N Lincoln Ave
Fullerton, CA 92831
|
774 sq. feet
|
1 baths 1 beds |
show details | |

|
#30
N Humboldt Ave
Ontario, CA 91764
|
1,084 sq. feet
|
1 baths 2 beds |
show details |
| Photo | Address | Area | Beds / Baths | Price | Details |
|---|---|---|---|---|---|

|
#31
Rosemead Blvd
Pico Rivera, CA 90660
|
3,121 sq. feet
|
2 baths 5 beds |
show details | |

|
#32
Valle Dr
La Habra, CA 90631
|
2,485 sq. feet
|
2 baths 3 beds |
show details | |

|
#33
Goetz Pl
Placentia, CA 92870
|
754 sq. feet
|
1 baths 1 beds |
show details | |

|
#34
Bequette Ave
Pico Rivera, CA 90660
|
2,766 sq. feet
|
2 baths 3 beds |
show details | |

|
#35
Gabbett Dr
La Mirada, CA 90638
|
1,764 sq. feet
|
3 baths 4 beds |
show details | |

|
#36
Rolling Hills Ln
Yorba Linda, CA 92887
|
4,332 sq. feet
|
4 baths 5 beds |
show details | |

|
#37
Mitony Ave
Whittier, CA 90605
|
1,561 sq. feet
|
2 baths 3 beds |
show details | |

|
#38
Valor Ln
Pomona, CA 91767
|
2,110 sq. feet
|
4 baths 3 beds |
show details | |

|
#39
Crimson Way
Pomona, CA 91767
|
1,940 sq. feet
|
4 baths 3 beds |
show details | |

|
#40
Sutterhome Pl
Rancho Cucamonga, CA 91730
|
1,395 sq. feet
|
3 baths 3 beds |
show details |
| Photo | Address | Area | Beds / Baths | Price | Details |
|---|---|---|---|---|---|

|
#41
N 2nd St
Montebello, CA 90640
|
2,684 sq. feet
|
4 baths 6 beds |
show details | |

|
#42
Durango Ct
La Verne, CA 91750
|
2,915 sq. feet
|
3 baths 3 beds |
show details | |

|
#43
Salazar Dr
Hacienda Heights, CA 91745
|
1,760 sq. feet
|
2 baths 3 beds |
show details | |

|
#44
Terryview Ave
Pomona, CA 91767
|
1,304 sq. feet
|
2 baths 4 beds |
show details | |

|
#45
Daybreak Ln
Pomona, CA 91767
|
1,070 sq. feet
|
3 baths 2 beds |
show details | |

|
#46
N Montebello Blvd
Montebello, CA 90640
|
1,509 sq. feet
|
2 baths 2 beds |
show details | |

|
#47
E La Verne Ave
Pomona, CA 91767
|
1,264 sq. feet
|
2 baths 4 beds |
show details | |

|
#48
Telechron Ave
Whittier, CA 90605
|
1,195 sq. feet
|
1 baths 3 beds |
show details | |

|
#49
Short St
Whittier, CA 90606
|
1,360 sq. feet
|
2 baths 3 beds |
show details | |

|
Check over 1 million property listings on Foreclosure.com!
|
browse all offers | |||

Household type by relationship:
Households: 9,646,924- In family households: 8,234,154 (1,430,848 male householders, 763,232 female householders)
1,480,665 spouses, 3,033,524 children (2,872,074 natural, 53,496 adopted, 107,954 stepchildren), 308,856 grandchildren, 205,746 brothers or sisters, 184,807 parents, foster children, 318,669 other relatives, 372,007 non-relatives
- In nonfamily households: 1,412,770 (510,532 male householders (360,530 living alone)), 536,592 female householders (424,398 living alone)), 365,646 nonrelatives
- In group quarters: 171,681 (68,682 institutionalized population)
1,648,001 married couples with children.
626,289 single-parent households (146,085 men, 480,204 women).
44.4% of residents of East San Gabriel Valley speak English at home.
37.5% of residents speak Spanish at home (52% speak English very well, 22% speak English well, 18% speak English not well, 9% don't speak English at all).
2.5% of residents speak other Indo-European language at home (73% speak English very well, 19% speak English well, 7% speak English not well, 1% don't speak English at all).
14.8% of residents speak Asian or Pacific Island language at home (46% speak English very well, 31% speak English well, 19% speak English not well, 4% don't speak English at all).
0.9% of residents speak other language at home (68% speak English very well, 22% speak English well, 8% speak English not well, 2% don't speak English at all).
Foreign born population: 296,586 (31.1%)
(64.5% of them are naturalized citizens)
| Here: | 5.8 |
| State: | 6.0 |
| Here: | 3.7 |
| State: | 3.9 |

- Bedrooms in owner-occupied houses and condos in East San Gabriel Valley, California
- 5,791no bedroom
- 10,2161 bedroom
- 31,1612 bedrooms
- 76,7343 bedrooms
- 49,0534 bedrooms
- 7,7285+ bedrooms

- Bedrooms in renter-occupied apartments in East San Gabriel Valley, California
- 10,094no bedroom
- 25,2751 bedroom
- 26,6032 bedrooms
- 15,0453 bedrooms
- 5,0464 bedrooms
- 5925+ bedrooms

- Cars and other vehicles available in East San Gabriel Valley in owner-occupied houses/condos
- 6,351no vehicle
- 37,4991 vehicle
- 77,8262 vehicles
- 39,0793 vehicles
- 13,9134 vehicles
- 6,0155+ vehicles

- Cars and other vehicles available in East San Gabriel Valley in renter-occupied apartments
- 11,497no vehicle
- 34,5921 vehicle
- 26,4832 vehicles
- 7,3413 vehicles
- 2,0784 vehicles
- 6645+ vehicles

- Rooms in owner-occupied houses in East San Gabriel Valley, California
- 4911 room
- 4,8462 rooms
- 20,8883 rooms
- 12,5854 rooms
- 38,0255 rooms
- 43,6176 rooms
- 31,3447 rooms
- 17,4558 rooms
- 11,4329+ rooms

- Rooms in renter-occupied apartments in East San Gabriel Valley, California
- 7,0821 room
- 15,5622 rooms
- 17,2303 rooms
- 16,5404 rooms
- 13,1655 rooms
- 7,6616 rooms
- 3,3477 rooms
- 1,2858 rooms
- 7839+ rooms


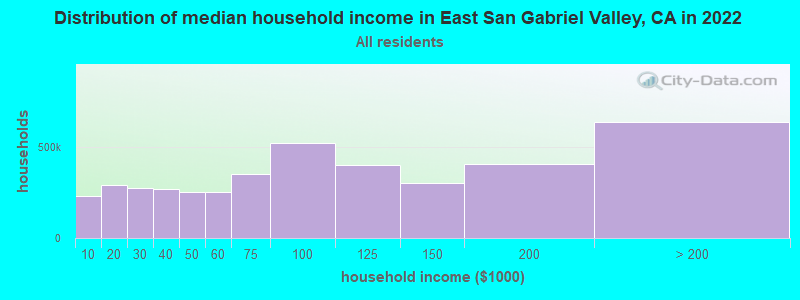
East San Gabriel Valley, CA household income distribution

- 231,214Less than $10,000
- 291,471$10,000 to $19,999
- 273,467$20,000 to $29,999
- 269,868$30,000 to $39,999
- 255,155$40,000 to $49,999
- 255,359$50,000 to $59,999
- 351,754$60,000 to $74,999
- 519,198$75,000 to $99,999
- 403,363$100,000 to $124,999
- 304,292$125,000 to $149,999
- 407,628$150,000 to $199,999
- 637,321$200,000 or more
Percentage of workers working in this county: 83.4%
Number of people working at home: 79,501 (17.0% of all workers)
Travel time to work (commute)
- Less than 5 minutes: 6,345
- 5 to 9 minutes: 27,411
- 10 to 14 minutes: 41,618
- 15 to 19 minutes: 49,194
- 20 to 24 minutes: 46,909
- 25 to 29 minutes: 18,733
- 30 to 34 minutes: 56,550
- 35 to 39 minutes: 10,604
- 40 to 44 minutes: 18,135
- 45 to 59 minutes: 43,387
- 60 to 89 minutes: 36,252
- 90 or more minutes: 14,352
Means of transportation to work:
- Drove a car alone: 277,369 (73.3%)
- Carpooled: 64,621 (17.1%)
- Bus or trolley bus: 10,809 (2.9%)
- Streetcar or trolley car: 133 (0.0%)
- Subway or elevated: 332 (0.1%)
- Railroad: 2,233 (0.6%)
- Ferryboat: 27 (0.0%)
- Taxi: 142 (0.0%)
- Motorcycle: 610 (0.2%)
- Bicycle: 2,389 (0.6%)
- Walked: 8,222 (2.2%)
- Other means: 2,603 (0.7%)
- Worked at home: 9,037 (2.4%)


- Year of entry for the foreign-born population in East San Gabriel Valley, California
- 50,3891995 to March 2000
- 47,6571990 to 1994
- 56,6431985 to 1989
- 50,4821980 to 1984
- 42,3061975 to 1979
- 29,8111970 to 1974
- 16,9611965 to 1969
- 23,387Before 1965
Most common places of birth for foreign-born residents (%):
| East San Gabriel Valley: | 46.6% (148,134) |
| California: | 44.3% (3,928,701) |
| East San Gabriel Valley: | 9.0% (28,718) |
| California: | 7.5% (664,935) |
| East San Gabriel Valley: | 6.9% (21,878) |
| California: | 1.7% (151,775) |
| East San Gabriel Valley: | 5.2% (16,636) |
| California: | 3.7% (327,611) |
| East San Gabriel Valley: | 4.2% (13,456) |
| California: | 3.0% (268,452) |
| East San Gabriel Valley: | 3.7% (11,635) |
| California: | 4.7% (418,249) |
| East San Gabriel Valley: | 3.3% (10,422) |
| California: | 4.1% (359,673) |
| East San Gabriel Valley: | 1.8% (5,758) |
| California: | 2.4% (211,458) |
| East San Gabriel Valley: | 1.6% (5,192) |
| California: | 2.2% (198,201) |
| East San Gabriel Valley: | 1.6% (5,190) |
| California: | 1.0% (91,101) |
Place of birth for U.S.-born residents:
- This state: 472,659
- Other state: 134,118
- Northeast: 27,416
- Midwest: 44,873
- South: 36,825
- West: 25,004
59% of East San Gabriel Valley residents lived in the same house 5 years ago.
Out of people who lived in different houses, 80% lived in this county.
Out of people who lived in different counties, 72% lived in California.
Education attainment for males 25 years and older:
- No schooling: 9,321
- Nursery to 4th grade: 5,136
- 5th and 6th grade: 13,377
- 7th and 8th grade: 8,560
- 9th grade: 7,381
- 10th grade: 6,102
- 11th grade: 7,575
- 12th grade, no diploma: 15,800
- High school graduate (or equivalency): 50,846
- Less than 1 year of college: 16,744
- Some college more than 1 year, no degree: 39,021
- Associate degree: 18,764
- Bachelor's degree: 41,275
- Master's degree: 14,240
- Professional school degree: 5,339
- Doctorate degree: 3,668

Education attainment for females 25 years and older:
- No schooling: 11,191
- Nursery to 4th grade: 5,792
- 5th and 6th grade: 15,246
- 7th and 8th grade: 9,329
- 9th grade: 8,632
- 10th grade: 6,906
- 11th grade: 8,744
- 12th grade, no diploma: 15,545
- High school graduate (or equivalency): 63,719
- Less than 1 year of college: 21,477
- Some college more than 1 year, no degree: 40,593
- Associate degree: 22,151
- Bachelor's degree: 41,927
- Master's degree: 12,400
- Professional school degree: 3,498
- Doctorate degree: 1,540


Housing units in structures:
- One, detached: 185,028
- One, attached: 22,164
- Two: 2,796
- 3 or 4: 10,542
- 5 to 9: 8,032
- 10 to 19: 6,358
- 20 to 49: 7,610
- 50 or more: 17,628
- Mobile homes: 9,851
- Boats, RVs, vans, etc.: 231
Median worth of mobile homes: $121,832
Housing units lacking complete kitchen facilities: 1.0%

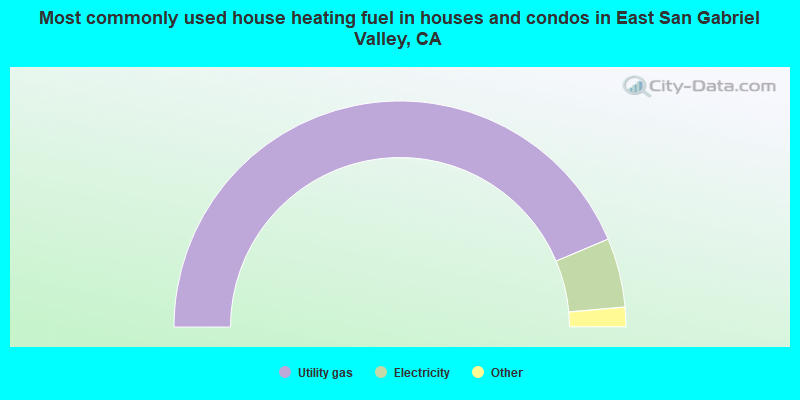
- 87.3%Utility gas
- 9.9%Electricity
- 1.2%No fuel used
- 1.1%Bottled, tank, or LP gas
- 0.3%Wood
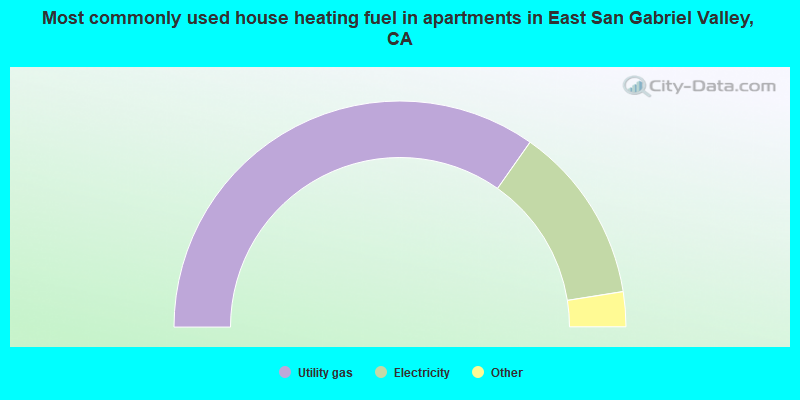
- 69.6%Utility gas
- 25.5%Electricity
- 2.9%No fuel used
- 1.4%Bottled, tank, or LP gas
- 0.3%Solar energy
- 0.2%Wood
Private vs. public school enrollment:
| Here: | 9.2% |
| California: | 9.9% |
| Here: | 7.7% |
| California: | 7.8% |
| Here: | 23.4% |
| California: | 15.4% |


