East Rutherford, NJ (New Jersey) Houses and Residents
| East Rutherford: | $460,510 |
| New Jersey: | $428,900 |
Mean price in 2022:
Detached houses: $487,060
Here: $487,060 State: $537,591 Townhouses or other attached units: $1,289,241
Here: $1,289,241 State: $381,113 In 2-unit structures: $542,774
Here: $542,774 State: $444,476 In 3-to-4-unit structures: $413,432
Here: $413,432 State: $457,463 In 5-or-more-unit structures: $397,490
Here: $397,490 State: $368,745
Total population: 9,798 (Urban population: 8,716, Rural population: 0)
Houses: 4,567 (4,284 occupied: 1,460 owner occupied, 2,846 renter occupied)
| % of renters here: | 66% |
| State: | 35% |
Housing density: 1,199 houses/condos per square mile
Median price asked for vacant for-sale houses and condos in 2022 in this county: $777,739.
Median contract rent in 2022: $1,577 (lower quartile is $1,205, upper quartile is $1,967)
Median rent asked for vacant for-rent units in 2022: $2,509
Median gross rent in East Rutherford, NJ in 2022: $1,684
Housing units in East Rutherford with a mortgage: 1,023 (105 second mortgage, 0 home equity loan, 99 both second mortgage and home equity loan)
Houses without a mortgage: 77
Median household income for houses/condos with a mortgage: $134,136
Median household income for apartments without a mortgage: $61,012
Median monthly housing costs: $1,766
Compare current foreclosures near East Rutherford, NJ:
| Photo | Address | Area | Beds / Baths | Price | Details |
|---|---|---|---|---|---|

|
#1
Oak St # 303
East Rutherford, NJ 07073
|
- sq. feet
|
- baths - beds |
show details | |

|
#2
Paterson Ave
East Rutherford, NJ 07073
|
- sq. feet
|
- baths - beds |
show details | |

|
#3
Paterson Ave
East Rutherford, NJ 07073
|
- sq. feet
|
- baths - beds |
show details | |

|
#4
Boiling Springs Ave
East Rutherford, NJ 07073
|
4,191 sq. feet
|
- baths - beds |
show details | |

|
#5
Prospect Ter
East Rutherford, NJ 07073
|
2,136 sq. feet
|
- baths - beds |
show details | |

|
#6
River St
East Rutherford, NJ 07073
|
- sq. feet
|
- baths - beds |
show details | |

|
#7
Boiling Springs Ave
East Rutherford, NJ 07073
|
4,282 sq. feet
|
- baths - beds |
show details | |

|
#8
Boiling Springs Ave
East Rutherford, NJ 07073
|
- sq. feet
|
- baths - beds |
show details | |

|
#9
Grove St # 2
East Rutherford, NJ 07073
|
- sq. feet
|
- baths - beds |
show details | |

|
#10
High St
East Rutherford, NJ 07073
|
1,382 sq. feet
|
- baths - beds |
show details |
| Photo | Address | Area | Beds / Baths | Price | Details |
|---|---|---|---|---|---|

|
#11
Hoboken Rd
East Rutherford, NJ 07073
|
995 sq. feet
|
- baths - beds |
show details | |

|
#12
River St
East Rutherford, NJ 07073
|
2,278 sq. feet
|
- baths - beds |
show details | |

|
#13
Vreeland Ave
East Rutherford, NJ 07073
|
1,013 sq. feet
|
- baths - beds |
show details | |

|
#14
River Renaissance
East Rutherford, NJ 07073
|
- sq. feet
|
- baths - beds |
show details | |

|
#15
Boiling Springs Ave
East Rutherford, NJ 07073
|
2,058 sq. feet
|
- baths - beds |
show details | |

|
#16
Oak St # 204
East Rutherford, NJ 07073
|
- sq. feet
|
- baths - beds |
show details | |

|
#17
Union Ave
East Rutherford, NJ 07073
|
- sq. feet
|
- baths - beds |
show details | |

|
#18
Carlton Ave
East Rutherford, NJ 07073
|
2,148 sq. feet
|
- baths - beds |
show details | |

|
#19
E Union Ave # 100
East Rutherford, NJ 07073
|
- sq. feet
|
- baths - beds |
show details | |

|
#20
E 32nd St Apt C7
Brooklyn, NY 11210
|
670 sq. feet
|
1 baths 1 beds |
$299,900
|
show details |
| Photo | Address | Area | Beds / Baths | Price | Details |
|---|---|---|---|---|---|

|
#21
Park Ave Apt 12
North Bergen, NJ 07047
|
835 sq. feet
|
1 baths 2 beds |
$379,900
|
show details |

|
#22
E 36th St Apt 9f
New York, NY 10016
|
700 sq. feet
|
1 baths 1 beds |
$499,900
|
show details |

|
#23
17th Ave 1st Floor
Whitestone, NY 11357
|
610 sq. feet
|
1 baths 1 beds |
$229,900
|
show details |

|
#24
Ashland Ave
East Orange, NJ 07017
|
2,254 sq. feet
|
1 baths 5 beds |
$272,000
|
show details |

|
#25
Midland Ave Apt 4h
Bronxville, NY 10708
|
900 sq. feet
|
1 baths 1 beds |
$184,000
|
show details |

|
#26
Jersey Ave
Fairview, NJ 07022
|
1,073 sq. feet
|
1 baths 3 beds |
$414,900
|
show details |

|
#27
W Sidney Ave
Mount Vernon, NY 10550
|
2,800 sq. feet
|
3 baths 8 beds |
$454,900
|
show details |

|
#28
90th St Apt 5d
Jackson Heights, NY 11372
|
1,000 sq. feet
|
1 baths 2 beds |
$269,900
|
show details |

|
#29
E 73rd St
New York, NY 10021
|
1,253 sq. feet
|
2 baths 2 beds |
$699,900
|
show details |

|
#30
Forest Ave
Paramus, NJ 07652
|
2,428 sq. feet
|
3 baths 5 beds |
$749,900
|
show details |
| Photo | Address | Area | Beds / Baths | Price | Details |
|---|---|---|---|---|---|

|
#31
Fordham Hill Oval Apt 12d
Bronx, NY 10468
|
850 sq. feet
|
1 baths 1 beds |
$179,900
|
show details |

|
#32
Huntington Rd
Union, NJ 07083
|
1,532 sq. feet
|
2 baths 3 beds |
$539,900
|
show details |

|
#33
Fordham Hill Oval
Bronx, NY 10468
|
700 sq. feet
|
1 baths 1 beds |
$154,900
|
show details |

|
#34
Horizon Rd Apt 803
Fort Lee, NJ 07024
|
843 sq. feet
|
1 baths 1 beds |
$178,900
|
show details |

|
#35
S Orange Ave
Newark, NJ 07103
|
989 sq. feet
|
1 baths 2 beds |
$289,900
|
show details |

|
#36
Woodside Ave
Newark, NJ 07104
|
2,188 sq. feet
|
3 baths 4 beds |
$649,900
|
show details |

|
#37
N Broadway Apt A6
Yonkers, NY 10701
|
950 sq. feet
|
2 baths 2 beds |
$219,900
|
show details |

|
#38
Central Park Ave Apt 9m
Yonkers, NY 10710
|
1,300 sq. feet
|
2 baths 3 beds |
$319,900
|
show details |

|
#39
Willow St
Bloomfield, NJ 07003
|
1,092 sq. feet
|
1 baths 3 beds |
$499,900
|
show details |

|
#40
Olinville Ave Apt 11c
Bronx, NY 10467
|
1,000 sq. feet
|
2 baths 3 beds |
$385,000
|
show details |
| Photo | Address | Area | Beds / Baths | Price | Details |
|---|---|---|---|---|---|

|
#41
Grand Concourse Apt 3c
Bronx, NY 10452
|
700 sq. feet
|
1 baths 1 beds |
$184,500
|
show details |

|
#42
Bloomfield Ave
Caldwell, NJ 07006
|
1,216 sq. feet
|
2 baths 2 beds |
$400,000
|
show details |

|
#43
Bay 19th St
Brooklyn, NY 11214
|
880 sq. feet
|
1 baths 2 beds |
$425,000
|
show details |

|
#44
E 81st St Apt 4c
New York, NY 10028
|
696 sq. feet
|
1 baths 1 beds |
$745,000
|
show details |

|
#45
Ackerman St
Maywood, NJ 07607
|
1,914 sq. feet
|
4 baths 5 beds |
$525,200
|
show details |

|
#46
2nd Ave # 5c
New York, NY 10029
|
550 sq. feet
|
1 baths 1 beds |
$429,900
|
show details |

|
#47
E 52nd St Apt 4f
New York, NY 10022
|
700 sq. feet
|
1 baths 1 beds |
$689,900
|
show details |

|
#48
7th St
Ridgefield Park, NJ 07660
|
1,382 sq. feet
|
1 baths 3 beds |
$539,900
|
show details |

|
#49
Swinton Ave
Bronx, NY 10465
|
1,938 sq. feet
|
2 baths 3 beds |
$789,900
|
show details |

|
Check over 1 million property listings on Foreclosure.com!
|
browse all offers | |||


Median year apartment built: 1971
Household type by relationship:
Households: 10,017- Male householders: 1,969 (509 living alone), Female householders: 2,287 (958 living alone)
1,688 spouses (1,675 opposite-sex spouses), 341 unmarried partners, (341 opposite-sex unmarried partners), 2,524 children (2,340 natural, 77 adopted, 105 stepchildren), 152 grandchildren, 221 brothers or sisters, 333 parents, 0 foster children, 106 other relatives, 372 non-relatives
- In group quarters: 16
Size of family households: 968 2-persons, 895 3-persons, 339 4-persons, 251 5-persons, 42 6-persons, 51 7-or-more-persons.
Size of nonfamily households: 1,518 1-person, 208 2-persons, 40 3-persons, 12 4-persons.
1,232 married couples with children.
269 single-parent households (40 men, 229 women).
48.6% of residents of East Rutherford speak English at home.
17.5% of residents speak Spanish at home (74% speak English very well, 19% speak English well, 7% speak English not well).
14.1% of residents speak other Indo-European language at home (67% speak English very well, 22% speak English well, 11% speak English not well).
19.0% of residents speak Asian or Pacific Island language at home (62% speak English very well, 26% speak English well, 12% speak English not well).
0.7% of residents speak other language at home (26% speak English very well, 74% speak English not well).
Foreign born population: 3,539 (35.3%)
(55.8% of them are naturalized citizens)
| Here: | 5.4 |
| State: | 6.8 |
| Here: | 3.8 |
| State: | 3.9 |

- Bedrooms in owner-occupied houses and condos in East Rutherford, New Jersey
- 0no bedroom
- 1091 bedroom
- 4112 bedrooms
- 5413 bedrooms
- 3344 bedrooms
- 665+ bedrooms

- Bedrooms in renter-occupied apartments in East Rutherford, New Jersey
- 133no bedroom
- 1,1611 bedroom
- 1,1852 bedrooms
- 2953 bedrooms
- 294 bedrooms
- 445+ bedrooms

- Cars and other vehicles available in East Rutherford in owner-occupied houses/condos
- 100no vehicle
- 4821 vehicle
- 5792 vehicles
- 2653 vehicles
- 234 vehicles
- 125+ vehicles

- Cars and other vehicles available in East Rutherford in renter-occupied apartments
- 397no vehicle
- 1,4531 vehicle
- 7742 vehicles
- 2243 vehicles
- 04 vehicles
- 05+ vehicles

- Rooms in owner-occupied houses in East Rutherford, New Jersey
- 01 room
- 112 rooms
- 1163 rooms
- 2554 rooms
- 3395 rooms
- 2376 rooms
- 797 rooms
- 2418 rooms
- 1839+ rooms

- Rooms in renter-occupied apartments in East Rutherford, New Jersey
- 1091 room
- 4222 rooms
- 5143 rooms
- 9444 rooms
- 5225 rooms
- 1766 rooms
- 747 rooms
- 638 rooms
- 239+ rooms


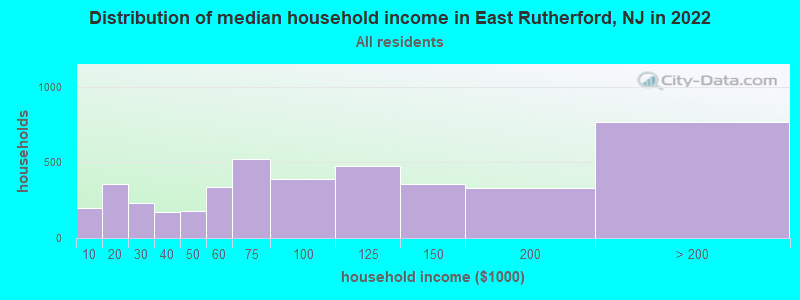
East Rutherford, NJ household income distribution

- 196Less than $10,000
- 357$10,000 to $19,999
- 234$20,000 to $29,999
- 170$30,000 to $39,999
- 176$40,000 to $49,999
- 340$50,000 to $59,999
- 519$60,000 to $74,999
- 389$75,000 to $99,999
- 474$100,000 to $124,999
- 355$125,000 to $149,999
- 327$150,000 to $199,999
- 766$200,000 or more
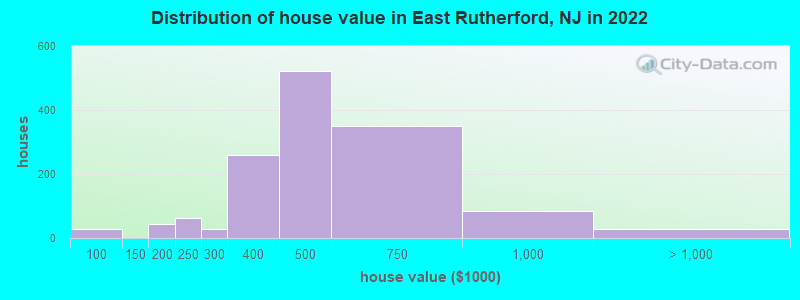
Home value of owner - occupied houses in 2022 in East Rutherford, NJ
-
- 26$60,000 to $69,999
- 45$175,000 to $199,999
- 64$200,000 to $249,999
- 26$250,000 to $299,999
- 259$300,000 to $399,999
- 522$400,000 to $499,999
- 350$500,000 to $749,999
- 84$750,000 to $999,999
- 29$2,000,000 or more
Rent paid by renters in 2022 in East Rutherford, NJ
-
- 235$200 to $249
- 8$250 to $299
- 25$400 to $449
- 27$450 to $499
- 37$700 to $749
- 60$800 to $899
- 93$900 to $999
- 364$1,000 to $1,249
- 502$1,250 to $1,499
- 877$1,500 to $1,999
- 331$2,000 to $2,499
- 290$2,500 to $2,999
- 47$3,000 to $3,499
- 6No cash rent


Percentage of workers working in this county: 61.7%
Number of people working at home: 953 (16.9% of all workers)
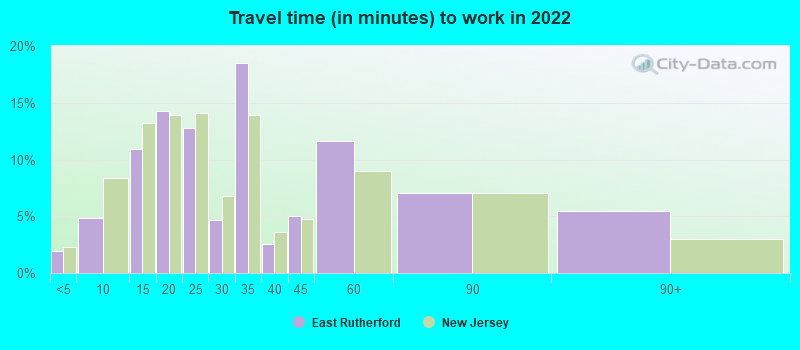
Travel time to work (commute)
- Less than 5 minutes: 57
- 5 to 9 minutes: 422
- 10 to 14 minutes: 447
- 15 to 19 minutes: 854
- 20 to 24 minutes: 400
- 25 to 29 minutes: 246
- 30 to 34 minutes: 735
- 35 to 39 minutes: 182
- 40 to 44 minutes: 218
- 45 to 59 minutes: 392
- 60 to 89 minutes: 570
- 90 or more minutes: 146
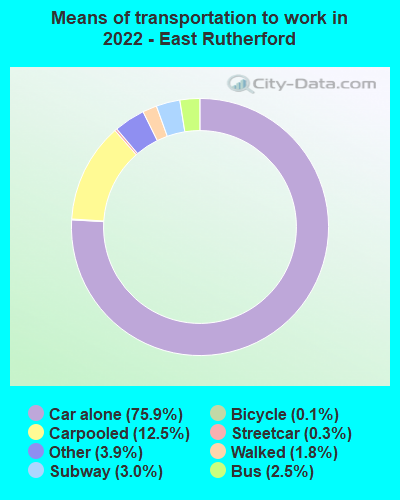
Means of transportation to work:
- Drove a car alone: 6,168 (65.1%)
- Carpooled: 1,218 (12.9%)
- Bus: 188 (2.0%)
- Subway or elevated rail: 20 (0.2%)
- Long-distance train or commuter rail: 149 (1.6%)
- Taxi: 362 (3.8%)
- Bicycle: 7 (0.1%)
- Walked: 154 (1.6%)
- Worked at home: 953 (10.1%)

- Unemployment by race in 2022
- Unemployment rate for White non-Hispanic residents
- 3.4%Males
- 5.9%Females
- Unemployment rate for Asian residents
- 1.2%Males
- Unemployment rate for two or more race residents
- 10.0%Males
- 3.9%Females
- Unemployment rate for Hispanic or Latino residents
- 1.4%Females

- Year of entry for the foreign-born population in East Rutherford, New Jersey
- 1,2292010 or later
- 8982000 to 2009
- 5511990 to 1999
- 4751980 to 1989
- 3551970 to 1979
- 445Before 1970

First ancestries reported:
- Polish: 500 (9.1%)
- Turkish: 425 (7.7%)
- Italian: 413 (7.5%)
- Irish: 165 (3.0%)
- American: 98 (1.8%)
- Portuguese: 70 (1.3%)
- Jordanian: 54 (1.0%)
- Slovak: 51 (0.9%)
- German: 50 (0.9%)
- Armenian: 34 (0.6%)
- Ukrainian: 30 (0.5%)
- Scotch-Irish: 28 (0.5%)
- Brazilian: 25 (0.5%)
- Croatian: 24 (0.4%)
- Macedonian: 23 (0.4%)
- Welsh: 23 (0.4%)
- English: 21 (0.4%)
- Swedish: 21 (0.4%)
- European: 20 (0.4%)
- Scottish: 16 (0.3%)
- Greek: 12 (0.2%)
- Scandinavian: 12 (0.2%)
- Moroccan: 10 (0.2%)
- Hungarian: 9 (0.2%)
- Syrian: 8 (0.1%)
- Eastern European: 8 (0.1%)
- French Canadian: 4 (0.07%)
- Maltese: 1 (0.02%)
- Slavic: 1 (0.02%)
Most common places of birth for foreign-born residents (%):
| East Rutherford: | 21.2% (750) |
| New Jersey: | 12.8% (274,609) |
| East Rutherford: | 10.0% (355) |
| New Jersey: | 0.8% (16,778) |
| East Rutherford: | 9.0% (319) |
| New Jersey: | 2.3% (48,811) |
| East Rutherford: | 8.7% (308) |
| New Jersey: | 3.3% (70,512) |
| East Rutherford: | 8.2% (290) |
| New Jersey: | 4.8% (102,527) |
| East Rutherford: | 7.8% (276) |
| New Jersey: | 4.0% (85,934) |
| East Rutherford: | 7.2% (255) |
| New Jersey: | 9.7% (209,055) |
| East Rutherford: | 5.3% (189) |
| New Jersey: | 3.7% (78,969) |
| East Rutherford: | 4.0% (141) |
| New Jersey: | 2.7% (58,563) |
| East Rutherford: | 2.1% (75) |
| New Jersey: | 0.1% (2,903) |
| East Rutherford: | 1.9% (67) |
| New Jersey: | 4.2% (90,817) |
| East Rutherford: | 1.8% (64) |
| New Jersey: | 0.2% (4,399) |
Place of birth for U.S.-born residents:
- This state: 4,682
- Other state: 1,558
- Northeast: 1,233
- Midwest: 117
- South: 142
- West: 52
80.8% of East Rutherford residents lived in the same house 1 years ago.
Out of people who lived in different houses, 35.2% lived in this county.
Out of people who lived in different counties, 60.6% lived in New Jersey.
| East Rutherford: | 80.8% |
| State average: | 90.4% |
Education attainment for males 25 years and older:
- No schooling: 131
- Nursery to 4th grade: 0
- 5th and 6th grade: 54
- 7th and 8th grade: 46
- 9th grade: 13
- 10th grade: 0
- 11th grade: 7
- 12th grade, no diploma: 118
- High school graduate (or equivalency): 561
- Less than 1 year of college: 202
- Some college more than 1 year, no degree: 423
- Associate degree: 241
- Bachelor's degree: 1,228
- Master's degree: 336
- Professional school degree: 67
- Doctorate degree: 0

Education attainment for females 25 years and older:
- No schooling: 142
- Nursery to 4th grade: 10
- 5th and 6th grade: 36
- 7th and 8th grade: 41
- 9th grade: 5
- 10th grade: 78
- 11th grade: 74
- 12th grade, no diploma: 112
- High school graduate (or equivalency): 909
- Less than 1 year of college: 226
- Some college more than 1 year, no degree: 363
- Associate degree: 443
- Bachelor's degree: 970
- Master's degree: 451
- Professional school degree: 83
- Doctorate degree: 60


Housing units in structures:
- One, detached: 795
- One, attached: 285
- Two: 1,414
- 3 or 4: 433
- 5 to 9: 141
- 10 to 19: 408
- 20 to 49: 304
- 50 or more: 781
House/condo owner moved in on average 17 years ago
Renter moved in on average 2 years ago

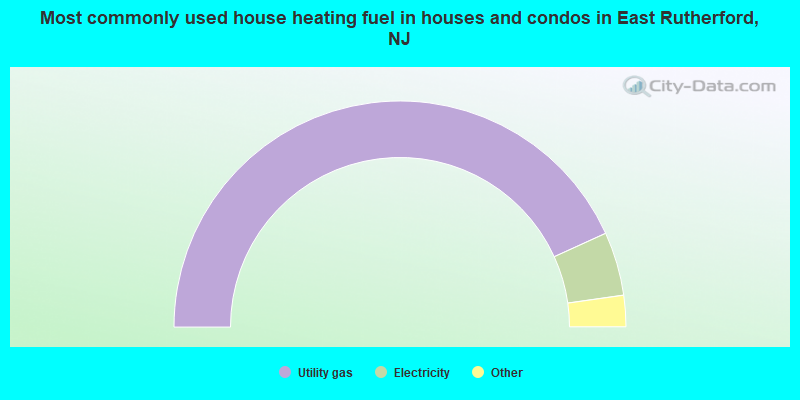
- 86.4%Utility gas
- 9.1%Electricity
- 3.1%Fuel oil, kerosene, etc.
- 0.8%No fuel used
- 0.6%Bottled, tank, or LP gas
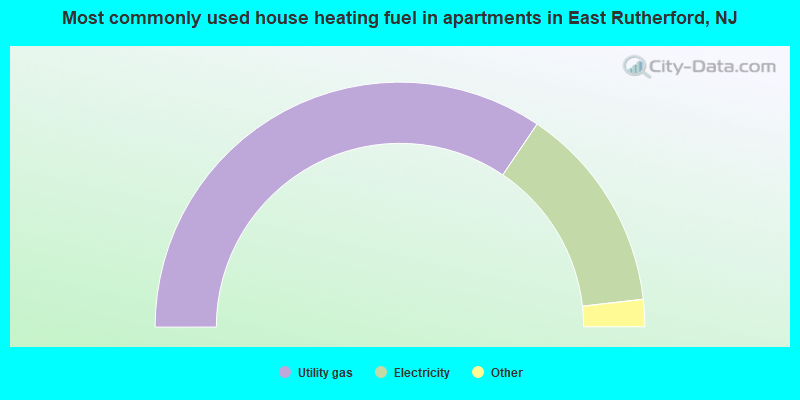
- 69.0%Utility gas
- 27.5%Electricity
- 3.3%Bottled, tank, or LP gas
- 0.2%No fuel used
Private vs. public school enrollment:
| Here: | 4.0% |
| New Jersey: | 12.3% |
| Here: | 13.3% |
| New Jersey: | 13.1% |
| Here: | 66.0% |
| New Jersey: | 33.2% |


