East Orange, NJ (New Jersey) Houses and Residents
| East Orange: | $349,700 |
| New Jersey: | $428,900 |
Mean price in 2022:
Detached houses: $351,364
Here: $351,364 State: $537,591 Townhouses or other attached units: $385,266
Here: $385,266 State: $381,113 In 2-unit structures: $450,324
Here: $450,324 State: $444,476 In 3-to-4-unit structures: $280,701
Here: $280,701 State: $457,463 In 5-or-more-unit structures: $154,516
Here: $154,516 State: $368,745
Total population: 65,078 (All urban)
Houses: 29,117 (27,653 occupied: 7,424 owner occupied, 20,229 renter occupied)
| % of renters here: | 73% |
| State: | 35% |
Housing density: 7,413 houses/condos per square mile
Median price asked for vacant for-sale houses and condos in 2022: $104,848.
Median contract rent in 2022: $1,074 (lower quartile is $729, upper quartile is $1,380)
Median rent asked for vacant for-rent units in 2022: $1,191
Median gross rent in East Orange, NJ in 2022: $1,166
Housing units in East Orange with a mortgage: 5,505 (299 second mortgage, 0 home equity loan, 137 both second mortgage and home equity loan)
Houses without a mortgage: 97
Median household income for houses/condos with a mortgage: $126,504
Median household income for apartments without a mortgage: $61,279
Median monthly housing costs: $1,308
Compare current foreclosures in East Orange, NJ:
| Photo | Address | Area | Beds / Baths | Price | Details |
|---|---|---|---|---|---|

|
#1
Ashland Ave
East Orange, NJ 07017
|
2,254 sq. feet
|
1 baths 5 beds |
$272,000
|
show details |

|
#2
Midland Ave
East Orange, NJ 07017
|
1,558 sq. feet
|
1 baths 3 beds |
show details | |

|
#3
Springdale Ave
East Orange, NJ 07017
|
1,688 sq. feet
|
1 baths 4 beds |
show details | |

|
#4
S Grove St 1-E
East Orange, NJ 07018
|
- sq. feet
|
2 baths 3 beds |
show details | |

|
#5
N Grove St
East Orange, NJ 07017
|
1,178 sq. feet
|
- baths - beds |
show details | |

|
#6
Park Ave
East Orange, NJ 07017
|
3,599 sq. feet
|
- baths - beds |
show details | |

|
#7
S Munn Ave Apt 4b
East Orange, NJ 07018
|
- sq. feet
|
- baths - beds |
show details | |

|
#8
S Burnett St
East Orange, NJ 07018
|
- sq. feet
|
- baths - beds |
show details | |

|
#9
Park Ave
East Orange, NJ 07017
|
1,704 sq. feet
|
- baths - beds |
show details | |

|
#10
Prospect St Apt 9b
East Orange, NJ 07017
|
1,170 sq. feet
|
- baths - beds |
show details |
| Photo | Address | Area | Beds / Baths | Price | Details |
|---|---|---|---|---|---|

|
#11
Lake St
East Orange, NJ 07017
|
968 sq. feet
|
- baths - beds |
show details | |

|
#12
Halsted St # 2
East Orange, NJ 07018
|
- sq. feet
|
- baths - beds |
show details | |

|
#13
Sunnyside Ter
East Orange, NJ 07018
|
- sq. feet
|
- baths - beds |
show details | |

|
#14
Dr Martin Luther King Jr Blvd
East Orange, NJ 07018
|
- sq. feet
|
- baths - beds |
show details | |

|
#15
N Grove St
East Orange, NJ 07017
|
- sq. feet
|
- baths - beds |
show details | |

|
#16
Tremont Ave
East Orange, NJ 07018
|
1,287 sq. feet
|
- baths - beds |
show details | |

|
#17
S Harrison St Apt 15h
East Orange, NJ 07018
|
- sq. feet
|
- baths - beds |
show details | |

|
#18
S Munn Ave # 1
East Orange, NJ 07018
|
3,495 sq. feet
|
- baths - beds |
show details | |

|
#19
N Grove St
East Orange, NJ 07017
|
2,785 sq. feet
|
- baths - beds |
show details | |

|
#20
Shepard Ave
East Orange, NJ 07018
|
- sq. feet
|
- baths - beds |
show details |
| Photo | Address | Area | Beds / Baths | Price | Details |
|---|---|---|---|---|---|

|
#21
Davis Ave
East Orange, NJ 07017
|
1,352 sq. feet
|
- baths - beds |
show details | |

|
#22
N Oraton Pkwy
East Orange, NJ 07017
|
- sq. feet
|
- baths - beds |
show details | |

|
#23
Lincoln St Apt 405
East Orange, NJ 07017
|
- sq. feet
|
- baths - beds |
show details | |

|
#24
Prospect St Apt 4-F
East Orange, NJ 07017
|
899 sq. feet
|
- baths - beds |
show details | |

|
#25
Rhode Island Ave
East Orange, NJ 07018
|
2,788 sq. feet
|
- baths - beds |
show details | |

|
#26
N Arlington Ave
East Orange, NJ 07017
|
- sq. feet
|
- baths - beds |
show details | |

|
#27
N Arlington Ave
East Orange, NJ 07017
|
- sq. feet
|
- baths - beds |
show details | |

|
#28
Eaton Pl
East Orange, NJ 07017
|
- sq. feet
|
- baths - beds |
show details | |

|
#29
Prospect St Apt 6-2b
East Orange, NJ 07017
|
- sq. feet
|
- baths - beds |
show details | |

|
#30
Prospect St Apt 1-Cd
East Orange, NJ 07017
|
- sq. feet
|
- baths - beds |
show details |
| Photo | Address | Area | Beds / Baths | Price | Details |
|---|---|---|---|---|---|

|
#31
Amherst St
East Orange, NJ 07018
|
- sq. feet
|
- baths - beds |
show details | |

|
#32
Tremont Ave
East Orange, NJ 07018
|
1,408 sq. feet
|
- baths - beds |
show details | |

|
#33
N Clinton St
East Orange, NJ 07017
|
2,024 sq. feet
|
- baths - beds |
show details | |

|
#34
Beech St
East Orange, NJ 07018
|
1,896 sq. feet
|
- baths - beds |
show details | |

|
#35
S Walnut St
East Orange, NJ 07018
|
- sq. feet
|
- baths - beds |
show details | |

|
#36
N Park St
East Orange, NJ 07017
|
3,196 sq. feet
|
- baths - beds |
show details | |

|
#37
N Arlington Ave
East Orange, NJ 07017
|
- sq. feet
|
- baths - beds |
show details | |

|
#38
Melmore Gardens
East Orange, NJ 07017
|
864 sq. feet
|
- baths - beds |
show details | |

|
#39
Beech St And 46 S Arlington Ave
East Orange, NJ 07018
|
- sq. feet
|
- baths - beds |
show details | |

|
#40
Glenwood Ave And 363-365 Park Ave
East Orange, NJ 07017
|
- sq. feet
|
- baths - beds |
show details |
| Photo | Address | Area | Beds / Baths | Price | Details |
|---|---|---|---|---|---|

|
#41
N Grove St, 350 Park Ave, 433 Central Ave, 395-99 Dr. Martin Luther King Jr. Blvd
East Orange, NJ Array
|
- sq. feet
|
- baths - beds |
show details | |

|
#42
Morris St
East Orange, NJ 07017
|
1,768 sq. feet
|
- baths - beds |
show details | |

|
#43
Dr. Mlk Jr. Blvd
East Orange, NJ 07018
|
- sq. feet
|
- baths - beds |
show details | |

|
#44
Irving St
East Orange, NJ 07018
|
1,394 sq. feet
|
- baths - beds |
show details | |

|
#45
Elliot Pl
East Orange, NJ 07018
|
- sq. feet
|
- baths - beds |
show details | |

|
#46
S Grove St
East Orange, NJ 07018
|
- sq. feet
|
- baths - beds |
show details | |

|
#47
S Harrison St
East Orange, NJ 07018
|
- sq. feet
|
- baths - beds |
show details | |

|
#48
Norwood St
East Orange, NJ 07018
|
- sq. feet
|
- baths - beds |
show details | |

|
#49
N Arlington Ave
East Orange, NJ 07017
|
- sq. feet
|
- baths - beds |
show details | |

|
Check over 1 million property listings on Foreclosure.com!
|
browse all offers | |||


 | East Orange has Texas price apartments (32 replies) |
| East Orange house from 80 years ago... (14 replies) |
| East Orange or no (66 replies) |
| Moving to Newark area, suggestions for apartments? (16 replies) |
| 1st time renter - med student in NJ considering East Orange/Newark studios: background 2 do 2 not end up a horror story? (10 replies) |
| Future home purchase/condo (8 replies) |

Median year apartment built: 1957
Household type by relationship:
Households: 68,445- Male householders: 12,624 (5,919 living alone), Female householders: 15,029 (6,878 living alone)
6,284 spouses (6,284 opposite-sex spouses), 1,067 unmarried partners, (1,067 opposite-sex unmarried partners), 24,919 children (24,423 natural, 285 adopted, 211 stepchildren), 2,010 grandchildren, 584 brothers or sisters, 2,173 parents, 0 foster children, 1,234 other relatives, 1,399 non-relatives
- In group quarters: 1,122
Size of family households: 5,824 2-persons, 2,000 3-persons, 2,475 4-persons, 1,821 5-persons, 663 6-persons, 1,475 7-or-more-persons.
Size of nonfamily households: 12,797 1-person, 486 2-persons, 112 3-persons.
5,794 married couples with children.
6,516 single-parent households (1,092 men, 5,424 women).
78.7% of residents of East Orange speak English at home.
8.5% of residents speak Spanish at home (52% speak English very well, 19% speak English well, 13% speak English not well, 15% don't speak English at all).
7.7% of residents speak other Indo-European language at home (57% speak English very well, 25% speak English well, 11% speak English not well, 7% don't speak English at all).
0.4% of residents speak Asian or Pacific Island language at home (40% speak English very well, 49% speak English well, 11% speak English not well).
5.2% of residents speak other language at home (82% speak English very well, 15% speak English well, 3% speak English not well).
Foreign born population: 24,256 (35.4%)
(64.4% of them are naturalized citizens)
| Here: | 6.3 |
| State: | 6.8 |
| Here: | 4.0 |
| State: | 3.9 |

- Bedrooms in owner-occupied houses and condos in East Orange, New Jersey
- 71no bedroom
- 01 bedroom
- 1,7082 bedrooms
- 2,9793 bedrooms
- 7754 bedrooms
- 1,8915+ bedrooms

- Bedrooms in renter-occupied apartments in East Orange, New Jersey
- 2,625no bedroom
- 6,1781 bedroom
- 7,5282 bedrooms
- 3,7083 bedrooms
- 1904 bedrooms
- 05+ bedrooms

- Cars and other vehicles available in East Orange in owner-occupied houses/condos
- 101no vehicle
- 2,8341 vehicle
- 2,5272 vehicles
- 1,4613 vehicles
- 3454 vehicles
- 1565+ vehicles

- Cars and other vehicles available in East Orange in renter-occupied apartments
- 7,574no vehicle
- 10,4991 vehicle
- 2,0892 vehicles
- 673 vehicles
- 04 vehicles
- 05+ vehicles

- Rooms in owner-occupied houses in East Orange, New Jersey
- 711 room
- 02 rooms
- 643 rooms
- 1,2364 rooms
- 1,5685 rooms
- 9126 rooms
- 9627 rooms
- 6158 rooms
- 1,9969+ rooms

- Rooms in renter-occupied apartments in East Orange, New Jersey
- 2,2621 room
- 1,1382 rooms
- 5,5043 rooms
- 2,5934 rooms
- 6,0945 rooms
- 2,1506 rooms
- 07 rooms
- 08 rooms
- 4889+ rooms


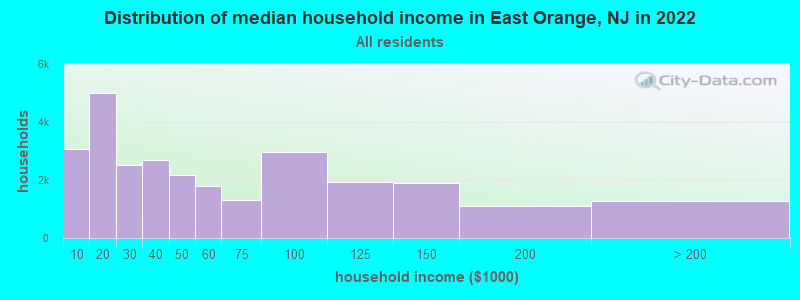
East Orange, NJ household income distribution

- 3,066Less than $10,000
- 5,004$10,000 to $19,999
- 2,501$20,000 to $29,999
- 2,678$30,000 to $39,999
- 2,170$40,000 to $49,999
- 1,784$50,000 to $59,999
- 1,316$60,000 to $74,999
- 2,961$75,000 to $99,999
- 1,922$100,000 to $124,999
- 1,887$125,000 to $149,999
- 1,096$150,000 to $199,999
- 1,268$200,000 or more
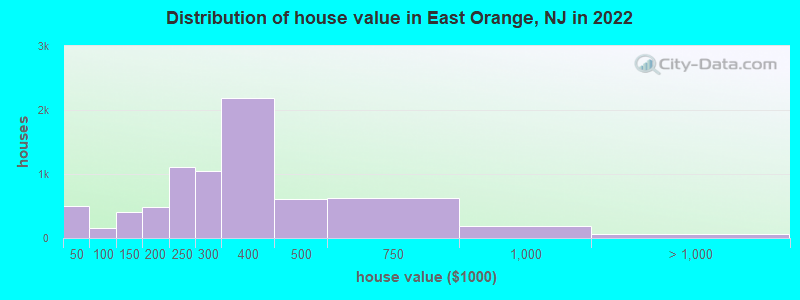
Home value of owner - occupied houses in 2022 in East Orange, NJ
-
- 206Less than $10,000
- 66$10,000 to $14,999
- 27$20,000 to $24,999
- 61$25,000 to $29,999
- 73$30,000 to $34,999
- 9$35,000 to $39,999
- 62$40,000 to $49,999
- 9$50,000 to $59,999
- 28$60,000 to $69,999
- 15$70,000 to $79,999
- 22$80,000 to $89,999
- 16$90,000 to $99,999
- 311$100,000 to $124,999
- 92$125,000 to $149,999
- 252$150,000 to $174,999
- 238$175,000 to $199,999
- 1,102$200,000 to $249,999
- 1,044$250,000 to $299,999
- 2,182$300,000 to $399,999
- 606$400,000 to $499,999
- 632$500,000 to $749,999
- 190$750,000 to $999,999
- 19$1,000,000 to $1,499,999
- 37$2,000,000 or more
Rent paid by renters in 2022 in East Orange, NJ
-
- 173Less than $100
- 78$100 to $149
- 437$150 to $199
- 633$200 to $249
- 464$250 to $299
- 237$300 to $349
- 195$350 to $399
- 186$400 to $449
- 119$450 to $499
- 401$500 to $549
- 105$550 to $599
- 194$600 to $649
- 156$650 to $699
- 173$700 to $749
- 153$750 to $799
- 756$800 to $899
- 1,807$900 to $999
- 4,341$1,000 to $1,249
- 3,017$1,250 to $1,499
- 3,970$1,500 to $1,999
- 570$2,000 to $2,499
- 110$2,500 to $2,999
- 19$3,000 to $3,499
- 4$3,500 or more
- 567No cash rent


Percentage of workers working in this county: 45.7%
Number of people working at home: 2,748 (8.7% of all workers)
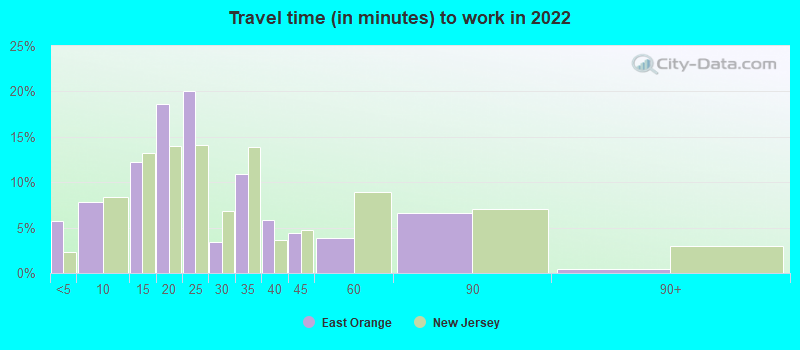
Travel time to work (commute)
- Less than 5 minutes: 788
- 5 to 9 minutes: 1,379
- 10 to 14 minutes: 3,414
- 15 to 19 minutes: 1,403
- 20 to 24 minutes: 3,717
- 25 to 29 minutes: 1,215
- 30 to 34 minutes: 3,534
- 35 to 39 minutes: 459
- 40 to 44 minutes: 1,233
- 45 to 59 minutes: 3,054
- 60 to 89 minutes: 4,124
- 90 or more minutes: 2,434
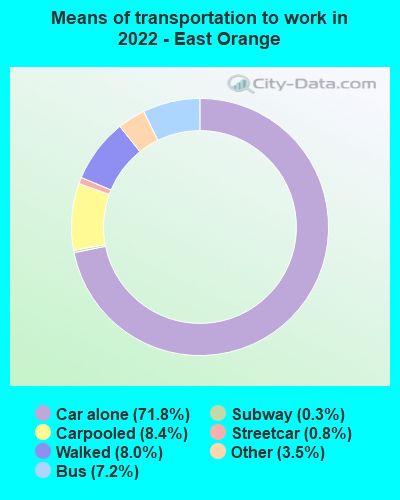
Means of transportation to work:
- Drove a car alone: 8,766 (58.1%)
- Carpooled: 1,335 (8.8%)
- Bus: 795 (5.3%)
- Subway or elevated rail: 86 (0.6%)
- Long-distance train or commuter rail: 30 (0.2%)
- Taxi: 395 (2.6%)
- Walked: 1,077 (7.1%)
- Worked at home: 2,748 (18.2%)

- Unemployment by race in 2022
- Unemployment rate for White non-Hispanic residents
- 7.3%Males
- 10.2%Females
- Unemployment rate for Black residents
- 6.9%Males
- 10.7%Females
- Unemployment rate for American Indian and Alaska Native residents
- 46.4%Females
- Unemployment rate for Asian residents
- 4.8%Females
- Unemployment rate for other race residents
- 3.1%Males
- 17.1%Females
- Unemployment rate for two or more race residents
- 3.0%Males
- 4.5%Females
- Unemployment rate for Hispanic or Latino residents
- 8.1%Males
- 11.6%Females

- Year of entry for the foreign-born population in East Orange, New Jersey
- 5,8062010 or later
- 6,7872000 to 2009
- 3,7731990 to 1999
- 4,4101980 to 1989
- 2,2721970 to 1979
- 784Before 1970
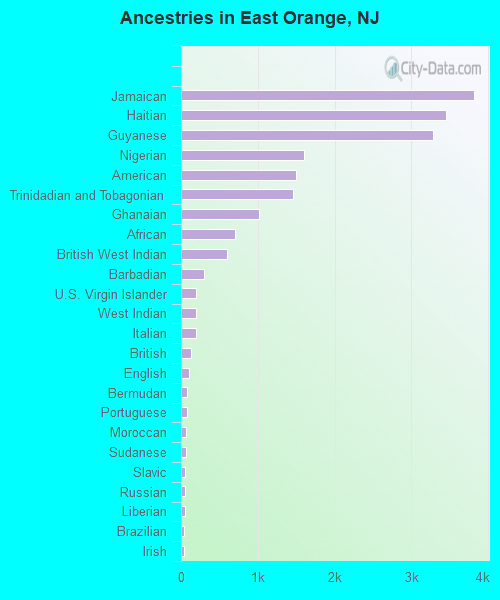
First ancestries reported:
- Jamaican: 3,820 (7.7%)
- Haitian: 3,446 (7.0%)
- Guyanese: 3,281 (6.6%)
- Nigerian: 1,603 (3.2%)
- American: 1,499 (3.0%)
- Trinidadian and Tobagonian: 1,465 (3.0%)
- Ghanaian: 1,015 (2.1%)
- African: 706 (1.4%)
- British West Indian: 597 (1.2%)
- Barbadian: 304 (0.6%)
- U.S. Virgin Islander: 201 (0.4%)
- West Indian: 195 (0.4%)
- Italian: 191 (0.4%)
- British: 124 (0.3%)
- English: 105 (0.2%)
- Bermudan: 75 (0.2%)
- Portuguese: 72 (0.1%)
- Moroccan: 71 (0.1%)
- Sudanese: 64 (0.1%)
- Slavic: 53 (0.1%)
- Russian: 52 (0.1%)
- Liberian: 50 (0.1%)
- Brazilian: 43 (0.09%)
- Irish: 35 (0.07%)
- Belizean: 32 (0.06%)
- French: 30 (0.06%)
- Sierra Leonean: 30 (0.06%)
- Bahamian: 28 (0.06%)
- Ethiopian: 22 (0.04%)
- Arab: 21 (0.04%)
- South African: 19 (0.04%)
- Kenyan: 13 (0.03%)
- Eastern European: 12 (0.02%)
- Polish: 12 (0.02%)
- Cape Verdean: 12 (0.02%)
- Ugandan: 7 (0.01%)
- German: 5 (0.01%)
Most common places of birth for foreign-born residents (%):
| East Orange: | 18.6% (3,909) |
| New Jersey: | 2.2% (47,365) |
| East Orange: | 17.1% (3,605) |
| New Jersey: | 1.2% (26,173) |
| East Orange: | 15.4% (3,234) |
| New Jersey: | 2.3% (49,491) |
| East Orange: | 9.0% (1,887) |
| New Jersey: | 9.7% (209,055) |
| East Orange: | 7.5% (1,580) |
| New Jersey: | 0.7% (15,533) |
| East Orange: | 5.7% (1,201) |
| New Jersey: | 1.2% (25,213) |
| East Orange: | 3.3% (698) |
| New Jersey: | 0.8% (17,949) |
| East Orange: | 2.0% (411) |
| New Jersey: | 0.2% (3,658) |
| East Orange: | 1.9% (394) |
| New Jersey: | 4.4% (95,275) |
| East Orange: | 1.8% (373) |
| New Jersey: | 4.8% (102,527) |
| East Orange: | 1.7% (363) |
| New Jersey: | 0.1% (3,124) |
Place of birth for U.S.-born residents:
- This state: 30,241
- Other state: 12,291
- Northeast: 8,167
- Midwest: 629
- South: 3,407
- West: 88
89.2% of East Orange residents lived in the same house 1 years ago.
Out of people who lived in different houses, 33.8% lived in this county.
Out of people who lived in different counties, 48.6% lived in New Jersey.
| East Orange: | 89.2% |
| State average: | 90.4% |
Education attainment for males 25 years and older:
- No schooling: 684
- Nursery to 4th grade: 466
- 5th and 6th grade: 176
- 7th and 8th grade: 12
- 9th grade: 730
- 10th grade: 145
- 11th grade: 301
- 12th grade, no diploma: 1,558
- High school graduate (or equivalency): 6,846
- Less than 1 year of college: 1,468
- Some college more than 1 year, no degree: 1,880
- Associate degree: 2,402
- Bachelor's degree: 2,891
- Master's degree: 1,155
- Professional school degree: 130
- Doctorate degree: 96

Education attainment for females 25 years and older:
- No schooling: 794
- Nursery to 4th grade: 353
- 5th and 6th grade: 59
- 7th and 8th grade: 353
- 9th grade: 119
- 10th grade: 555
- 11th grade: 394
- 12th grade, no diploma: 237
- High school graduate (or equivalency): 8,594
- Less than 1 year of college: 1,534
- Some college more than 1 year, no degree: 3,629
- Associate degree: 3,040
- Bachelor's degree: 3,050
- Master's degree: 1,304
- Professional school degree: 401
- Doctorate degree: 47


Housing units in structures:
- One, detached: 4,207
- One, attached: 1,176
- Two: 5,425
- 3 or 4: 3,781
- 5 to 9: 1,031
- 10 to 19: 2,243
- 20 to 49: 3,339
- 50 or more: 7,915
Housing units lacking complete kitchen facilities in 2022: 1.0%
House/condo owner moved in on average 8 years ago
Renter moved in on average 6 years ago

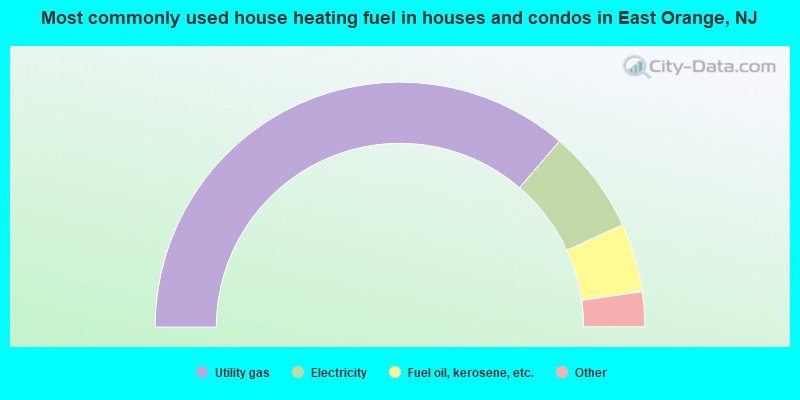
- 72.6%Utility gas
- 13.7%Electricity
- 9.1%Fuel oil, kerosene, etc.
- 2.7%Bottled, tank, or LP gas
- 1.7%Other fuel
- 0.2%Solar energy
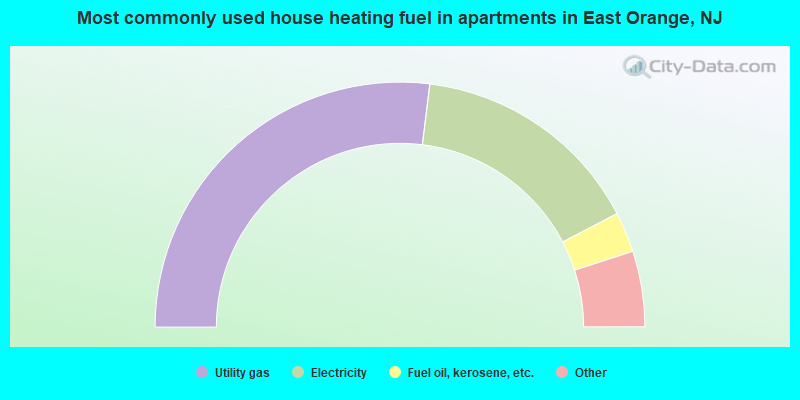
- 53.9%Utility gas
- 30.8%Electricity
- 5.3%Fuel oil, kerosene, etc.
- 3.6%No fuel used
- 3.3%Bottled, tank, or LP gas
- 3.1%Other fuel
Private vs. public school enrollment:
| Here: | 11.6% |
| New Jersey: | 12.3% |
| Here: | 9.8% |
| New Jersey: | 13.1% |
| Here: | 46.2% |
| New Jersey: | 33.2% |


