Dyersburg, TN (Tennessee) Houses and Residents
| Dyersburg: | $200,010 |
| Tennessee: | $284,800 |
Mean price in 2022:
Detached houses: $219,814
Here: $219,814 State: $374,382 Mobile homes: $79,593
Here: $79,593 State: $101,421
Total population: 16,839 (All urban)
Houses: 7,680 (6,838 occupied: 3,519 owner occupied, 3,440 renter occupied)
| % of renters here: | 49% |
| State: | 33% |
Housing density: 510 houses/condos per square mile
Median price asked for vacant for-sale houses and condos in 2022: $369,211.
Median contract rent in 2022: $548 (lower quartile is $431, upper quartile is $732)
Median rent asked for vacant for-rent units in 2022: $561
Median gross rent in Dyersburg, TN in 2022: $757
Housing units in Dyersburg with a mortgage: 1,561 (224 second mortgage, 95 home equity loan, 98 both second mortgage and home equity loan)
Houses without a mortgage: 35
Median household income for houses/condos with a mortgage: $92,236
Median household income for apartments without a mortgage: $70,273
Median monthly housing costs: $724
Compare current foreclosures in Dyersburg, TN:
| Photo | Address | Area | Beds / Baths | Price | Details |
|---|---|---|---|---|---|

|
#1
Lewis Ave
Dyersburg, TN 38024
|
2,293 sq. feet
|
3 baths 4 beds |
$210,000
|
show details |

|
#2
W Harris St
Dyersburg, TN 38024
|
749 sq. feet
|
1 baths 2 beds |
show details | |

|
#3
Kelly Rd
Dyersburg, TN 38024
|
1,344 sq. feet
|
2 baths 3 beds |
show details | |

|
#4
Southview Dr
Dyersburg, TN 38024
|
1,372 sq. feet
|
1 baths - beds |
show details | |

|
#5
Fort Hudson Rd
Dyersburg, TN 38024
|
1,817 sq. feet
|
2 baths - beds |
show details | |

|
#6
Melton Ave
Dyersburg, TN 38024
|
1,442 sq. feet
|
2 baths - beds |
show details | |

|
#7
Harness Rd
Dyersburg, TN 38024
|
2,014 sq. feet
|
1 baths - beds |
show details | |

|
#8
Harris St
Dyersburg, TN 38024
|
744 sq. feet
|
4 baths - beds |
show details | |

|
#9
Keats St
Dyersburg, TN 38024
|
1,062 sq. feet
|
2 baths - beds |
show details | |

|
#10
Auburn Ave
Dyersburg, TN 38024
|
1,295 sq. feet
|
1 baths - beds |
show details |
| Photo | Address | Area | Beds / Baths | Price | Details |
|---|---|---|---|---|---|

|
#11
Us Highway 51 S
Dyersburg, TN 38024
|
1,092 sq. feet
|
2 baths - beds |
show details | |

|
#12
Lenox Nauvoo Rd
Dyersburg, TN 38024
|
4,213 sq. feet
|
6 baths - beds |
show details | |

|
#13
Saint John Ave
Dyersburg, TN 38024
|
1,430 sq. feet
|
2 baths - beds |
show details | |

|
#14
Whitney Young Cv
Dyersburg, TN 38024
|
1,089 sq. feet
|
1 baths - beds |
show details | |

|
#15
Clifton Dr
Dyersburg, TN 38024
|
1,789 sq. feet
|
2 baths - beds |
show details | |

|
#16
Barry Rd
Dyersburg, TN 38024
|
1,075 sq. feet
|
1 baths - beds |
show details | |

|
#17
Ashley Rd
Dyersburg, TN 38024
|
1,772 sq. feet
|
2 baths - beds |
show details | |

|
#18
Phillips St
Dyersburg, TN 38024
|
997 sq. feet
|
1 baths - beds |
show details | |

|
#19
Ridge St
Dyersburg, TN 38024
|
1,290 sq. feet
|
1 baths - beds |
show details | |

|
#20
E Wheeler St
Dyersburg, TN 38024
|
950 sq. feet
|
1 baths - beds |
show details |
| Photo | Address | Area | Beds / Baths | Price | Details |
|---|---|---|---|---|---|

|
#21
Jo Cir
Dyersburg, TN 38024
|
1,456 sq. feet
|
1 baths - beds |
show details | |

|
#22
Copeland Rd
Dyersburg, TN 38024
|
1,137 sq. feet
|
2 baths - beds |
show details | |

|
#23
Sir James Ave
Dyersburg, TN 38024
|
1,418 sq. feet
|
2 baths - beds |
show details | |

|
#24
S Plum Rd
Dyersburg, TN 38024
|
1,008 sq. feet
|
1 baths - beds |
show details | |

|
#25
Lee St
Dyersburg, TN 38024
|
1,746 sq. feet
|
1 baths - beds |
show details | |

|
#26
Carrie Dr
Dyersburg, TN 38024
|
1,123 sq. feet
|
1 baths - beds |
show details | |

|
#27
Christie St
Dyersburg, TN 38024
|
1,040 sq. feet
|
1 baths - beds |
show details | |

|
#28
Circle Dr
Dyersburg, TN 38024
|
1,232 sq. feet
|
1 baths - beds |
show details | |

|
#29
Anderson Rd
Dyersburg, TN 38024
|
2,546 sq. feet
|
2 baths - beds |
show details | |

|
#30
Roellen Newbern Rd
Dyersburg, TN 38024
|
1,552 sq. feet
|
6 baths - beds |
show details |
| Photo | Address | Area | Beds / Baths | Price | Details |
|---|---|---|---|---|---|

|
#31
Allen Ave
Dyersburg, TN 38024
|
1,098 sq. feet
|
2 baths - beds |
show details | |

|
#32
Victory Ave
Dyersburg, TN 38024
|
890 sq. feet
|
1 baths - beds |
show details | |

|
#33
Shelby Dr
Dyersburg, TN 38024
|
1,172 sq. feet
|
1 baths - beds |
show details | |

|
#34
Light St
Dyersburg, TN 38024
|
1,664 sq. feet
|
1 baths - beds |
show details | |

|
#35
Allen Ave
Dyersburg, TN 38024
|
1,098 sq. feet
|
1 baths - beds |
show details | |

|
#36
Highway 104 W
Dyersburg, TN 38024
|
1,250 sq. feet
|
1 baths - beds |
show details | |

|
#37
Christie St
Dyersburg, TN 38024
|
816 sq. feet
|
1 baths - beds |
show details | |

|
#38
Moody Dr
Dyersburg, TN 38024
|
1,632 sq. feet
|
2 baths - beds |
show details | |

|
#39
Eastlawn Dr
Dyersburg, TN 38024
|
832 sq. feet
|
1 baths - beds |
show details | |

|
#40
Lincoln Ave
Dyersburg, TN 38024
|
750 sq. feet
|
2 baths - beds |
show details |
| Photo | Address | Area | Beds / Baths | Price | Details |
|---|---|---|---|---|---|

|
#41
Circle Dr
Dyersburg, TN 38024
|
1,572 sq. feet
|
1 baths - beds |
show details | |

|
#42
Wells Rd
Dyersburg, TN 38024
|
1,148 sq. feet
|
1 baths - beds |
show details | |

|
#43
Light St
Dyersburg, TN 38024
|
1,386 sq. feet
|
1 baths - beds |
show details | |

|
#44
Highway 78 N
Dyersburg, TN 38024
|
1,095 sq. feet
|
1 baths - beds |
show details | |

|
#45
Highway 104 E
Dyersburg, TN 38024
|
2,128 sq. feet
|
2 baths - beds |
show details | |

|
#46
Defoe Rd
Dyersburg, TN 38024
|
1,092 sq. feet
|
1 baths - beds |
show details | |

|
#47
Timothy Dr
Dyersburg, TN 38024
|
2,410 sq. feet
|
2 baths - beds |
show details | |

|
#48
Old Fowlkes Rd
Dyersburg, TN 38024
|
1,834 sq. feet
|
2 baths - beds |
show details | |

|
#49
Andrea Dr
Dyersburg, TN 38024
|
1,280 sq. feet
|
2 baths - beds |
show details | |

|
Check over 1 million property listings on Foreclosure.com!
|
browse all offers | |||

Latest news about housing in Dyersburg, TN collected exclusively by city-data.com from local newspapers, TV, and radio stations

 | Tennessee's 2020 Census results (74 replies) |
| Dyersburg- City Employment, HomeSchooling, Christian Churches (4 replies) |
| Tennessee Urban Areas 2020 (1 reply) |
| Tennessee home values: 2004-15 (5 replies) |
| Best place to live near Nashville and Jackson (5 replies) |
| Moving to Tennessee (12 replies) |

Median year apartment built: 1977
Household type by relationship:
Households: 16,467- Male householders: 2,994 (956 living alone), Female householders: 3,763 (1,647 living alone)
2,396 spouses (2,359 opposite-sex spouses), 266 unmarried partners, (239 opposite-sex unmarried partners), 4,501 children (4,253 natural, 180 adopted, 67 stepchildren), 527 grandchildren, 277 brothers or sisters, 529 parents, 41 foster children, 195 other relatives, 418 non-relatives
- In group quarters: 556
Size of family households: 2,133 2-persons, 757 3-persons, 643 4-persons, 366 5-persons, 62 6-persons, 45 7-or-more-persons.
Size of nonfamily households: 2,649 1-person, 244 2-persons, 38 3-persons.
1,553 married couples with children.
1,812 single-parent households (421 men, 1,391 women).
96.3% of residents of Dyersburg speak English at home.
1.8% of residents speak Spanish at home (71% speak English very well, 29% speak English not well).
0.4% of residents speak other Indo-European language at home (91% speak English very well, 9% speak English well).
0.6% of residents speak Asian or Pacific Island language at home (100% speak English very well).
0.7% of residents speak other language at home (100% speak English very well).
Foreign born population: 400 (2.4%)
(56.8% of them are naturalized citizens)
| Here: | 6.7 |
| State: | 6.5 |
| Here: | 4.4 |
| State: | 4.4 |

- Bedrooms in owner-occupied houses and condos in Dyersburg, Tennessee
- 8no bedroom
- 21 bedroom
- 3682 bedrooms
- 2,2103 bedrooms
- 7494 bedrooms
- 1815+ bedrooms

- Bedrooms in renter-occupied apartments in Dyersburg, Tennessee
- 20no bedroom
- 7511 bedroom
- 1,4452 bedrooms
- 1,0643 bedrooms
- 1224 bedrooms
- 405+ bedrooms

- Cars and other vehicles available in Dyersburg in owner-occupied houses/condos
- 70no vehicle
- 1,2281 vehicle
- 1,5222 vehicles
- 4803 vehicles
- 2184 vehicles
- 05+ vehicles

- Cars and other vehicles available in Dyersburg in renter-occupied apartments
- 669no vehicle
- 1,9261 vehicle
- 6992 vehicles
- 1473 vehicles
- 04 vehicles
- 05+ vehicles

- Rooms in owner-occupied houses in Dyersburg, Tennessee
- 81 room
- 02 rooms
- 283 rooms
- 2134 rooms
- 5215 rooms
- 8876 rooms
- 5627 rooms
- 3888 rooms
- 9119+ rooms

- Rooms in renter-occupied apartments in Dyersburg, Tennessee
- 01 room
- 722 rooms
- 8073 rooms
- 8494 rooms
- 8725 rooms
- 5436 rooms
- 1707 rooms
- 788 rooms
- 509+ rooms


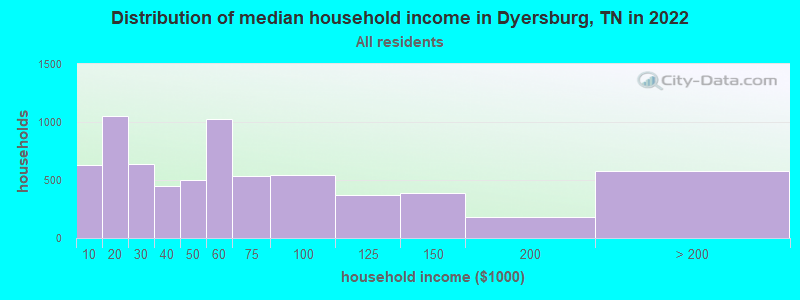
Dyersburg, TN household income distribution

- 629Less than $10,000
- 1,050$10,000 to $19,999
- 642$20,000 to $29,999
- 446$30,000 to $39,999
- 499$40,000 to $49,999
- 1,025$50,000 to $59,999
- 534$60,000 to $74,999
- 545$75,000 to $99,999
- 367$100,000 to $124,999
- 389$125,000 to $149,999
- 185$150,000 to $199,999
- 579$200,000 or more
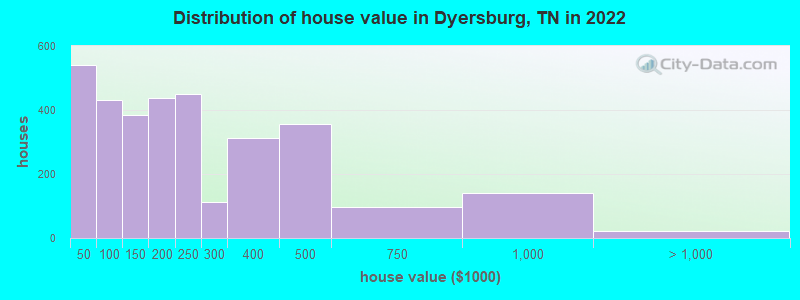
Home value of owner - occupied houses in 2022 in Dyersburg, TN
-
- 8Less than $10,000
- 50$10,000 to $14,999
- 27$15,000 to $19,999
- 26$20,000 to $24,999
- 52$25,000 to $29,999
- 80$30,000 to $34,999
- 181$35,000 to $39,999
- 112$40,000 to $49,999
- 65$50,000 to $59,999
- 84$60,000 to $69,999
- 49$70,000 to $79,999
- 25$80,000 to $89,999
- 92$90,000 to $99,999
- 212$100,000 to $124,999
- 171$125,000 to $149,999
- 233$150,000 to $174,999
- 204$175,000 to $199,999
- 449$200,000 to $249,999
- 114$250,000 to $299,999
- 313$300,000 to $399,999
- 356$400,000 to $499,999
- 96$500,000 to $749,999
- 141$750,000 to $999,999
- 21$1,000,000 to $1,499,999
Rent paid by renters in 2022 in Dyersburg, TN
-
- 61Less than $100
- 21$100 to $149
- 56$150 to $199
- 221$200 to $249
- 12$250 to $299
- 128$300 to $349
- 254$350 to $399
- 321$400 to $449
- 368$450 to $499
- 357$500 to $549
- 110$550 to $599
- 306$600 to $649
- 138$650 to $699
- 74$700 to $749
- 105$750 to $799
- 172$800 to $899
- 127$900 to $999
- 67$1,000 to $1,249
- 42$1,250 to $1,499
- 214$1,500 to $1,999
- 109No cash rent


Percentage of workers working in this county: 80.4%
Number of people working at home: 282 (4.2% of all workers)
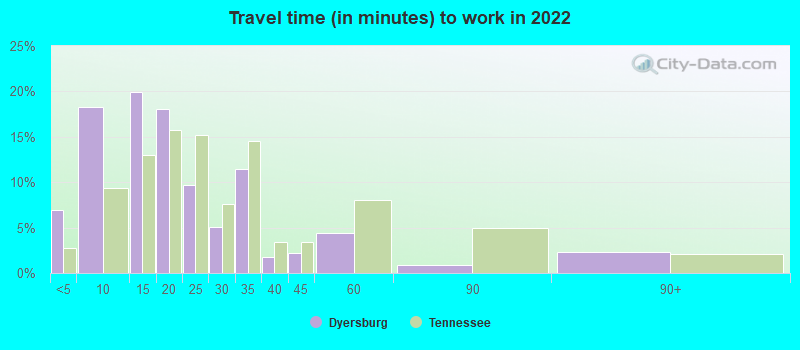
Travel time to work (commute)
- Less than 5 minutes: 649
- 5 to 9 minutes: 1,794
- 10 to 14 minutes: 1,389
- 15 to 19 minutes: 793
- 20 to 24 minutes: 254
- 25 to 29 minutes: 100
- 30 to 34 minutes: 460
- 35 to 39 minutes: 72
- 40 to 44 minutes: 189
- 45 to 59 minutes: 383
- 60 to 89 minutes: 127
- 90 or more minutes: 105
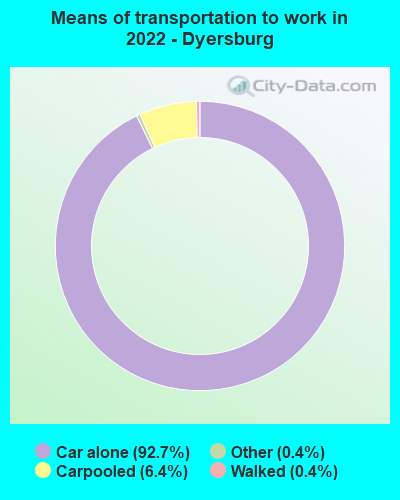
Means of transportation to work:
- Drove a car alone: 10,735 (86.8%)
- Carpooled: 786 (6.4%)
- Taxi: 60 (0.5%)
- Walked: 52 (0.4%)
- Worked at home: 282 (2.3%)

- Unemployment by race in 2022
- Unemployment rate for White non-Hispanic residents
- 1.3%Males
- 2.7%Females
- Unemployment rate for Black residents
- 8.9%Males
- 13.4%Females
- Unemployment rate for American Indian and Alaska Native residents
- 29.2%Males
- 100.0%Females
- Unemployment rate for two or more race residents
- 11.9%Males

- Year of entry for the foreign-born population in Dyersburg, Tennessee
- 1662010 or later
- 562000 to 2009
- 1751990 to 1999
- 371980 to 1989
- 281970 to 1979
- 32Before 1970
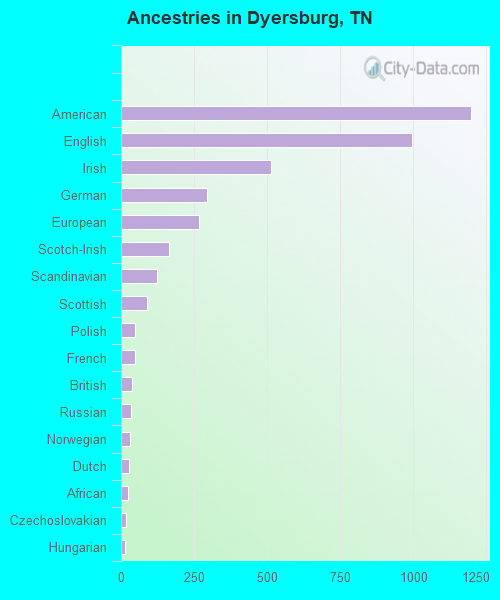
First ancestries reported:
- American: 1,200 (14.2%)
- English: 996 (11.8%)
- Irish: 514 (6.1%)
- German: 293 (3.5%)
- European: 267 (3.2%)
- Scotch-Irish: 164 (1.9%)
- Scandinavian: 122 (1.4%)
- Scottish: 89 (1.1%)
- Polish: 49 (0.6%)
- French: 48 (0.6%)
- British: 38 (0.5%)
- Russian: 35 (0.4%)
- Norwegian: 32 (0.4%)
- Dutch: 28 (0.3%)
- African: 25 (0.3%)
- Czechoslovakian: 18 (0.2%)
- Hungarian: 13 (0.2%)
Most common places of birth for foreign-born residents (%):
| Dyersburg: | 38.5% (154) |
| Tennessee: | 23.0% (86,435) |
| Dyersburg: | 24.8% (99) |
| Tennessee: | 3.1% (11,761) |
| Dyersburg: | 13.8% (55) |
| Tennessee: | 6.1% (23,079) |
| Dyersburg: | 8.8% (35) |
| Tennessee: | 0.1% (442) |
| Dyersburg: | 4.8% (19) |
| Tennessee: | 0.1% (470) |
| Dyersburg: | 3.5% (14) |
| Tennessee: | 2.0% (7,701) |
Place of birth for U.S.-born residents:
- This state: 11,773
- Other state: 4,081
- Northeast: 276
- Midwest: 1,923
- South: 1,297
- West: 563
87.5% of Dyersburg residents lived in the same house 1 years ago.
Out of people who lived in different houses, 40.9% lived in this county.
Out of people who lived in different counties, 56.7% lived in Tennessee.
| Dyersburg: | 87.5% |
| State average: | 87.0% |
Education attainment for males 25 years and older:
- No schooling: 53
- Nursery to 4th grade: 24
- 5th and 6th grade: 29
- 7th and 8th grade: 107
- 9th grade: 60
- 10th grade: 84
- 11th grade: 147
- 12th grade, no diploma: 32
- High school graduate (or equivalency): 2,036
- Less than 1 year of college: 312
- Some college more than 1 year, no degree: 592
- Associate degree: 252
- Bachelor's degree: 743
- Master's degree: 253
- Professional school degree: 61
- Doctorate degree: 140

Education attainment for females 25 years and older:
- No schooling: 30
- Nursery to 4th grade: 118
- 5th and 6th grade: 15
- 7th and 8th grade: 144
- 9th grade: 71
- 10th grade: 64
- 11th grade: 267
- 12th grade, no diploma: 80
- High school graduate (or equivalency): 2,175
- Less than 1 year of college: 414
- Some college more than 1 year, no degree: 815
- Associate degree: 571
- Bachelor's degree: 912
- Master's degree: 494
- Professional school degree: 67
- Doctorate degree: 73


Housing units in structures:
- One, detached: 5,642
- One, attached: 20
- Two: 307
- 3 or 4: 667
- 5 to 9: 463
- 10 to 19: 127
- 20 to 49: 173
- 50 or more: 87
- Mobile homes: 190
Housing units lacking complete kitchen facilities in 2022: 5.2%
House/condo owner moved in on average 14 years ago
Renter moved in on average 4 years ago

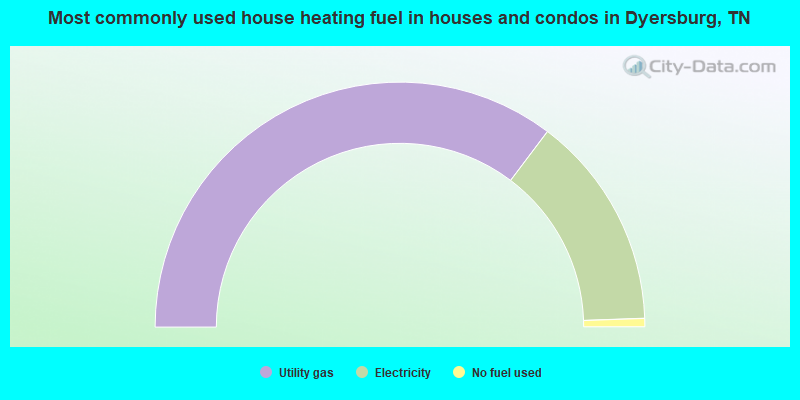
- 70.6%Utility gas
- 28.3%Electricity
- 1.1%No fuel used
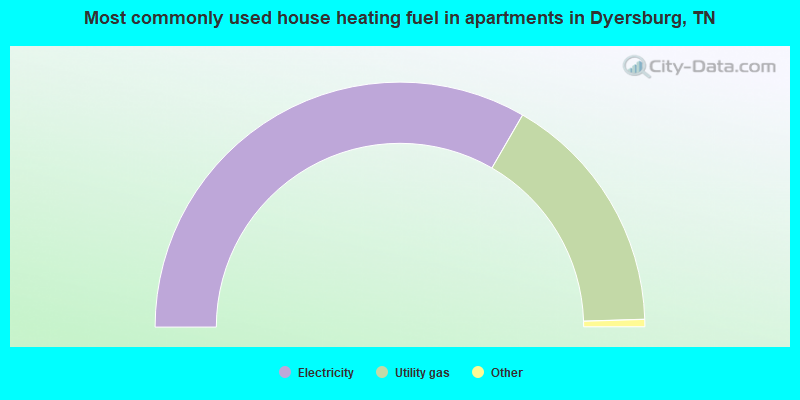
- 66.7%Electricity
- 32.3%Utility gas
- 0.6%Bottled, tank, or LP gas
- 0.3%No fuel used
Private vs. public school enrollment:
| Here: | 21.2% |
| Tennessee: | 15.0% |
| Here: | 16.4% |
| Tennessee: | 16.2% |
| Here: | 19.4% |
| Tennessee: | 23.5% |


