DuBois, PA (Pennsylvania) Houses and Residents
| DuBois: | $117,376 |
| Pennsylvania: | $245,500 |
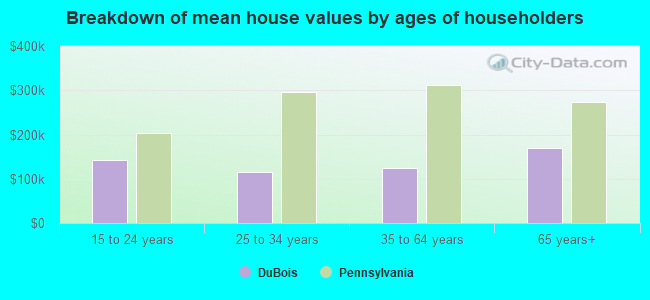
Mean price in 2022:
Detached houses: $155,905
Here: $155,905 State: $317,202 Townhouses or other attached units: $221,367
Here: $221,367 State: $254,369 In 2-unit structures: $114,884
Here: $114,884 State: $249,182
Total population: 7,632 (All urban)
Houses: 3,834 (3,376 occupied: 2,089 owner occupied, 1,384 renter occupied)
| % of renters here: | 40% |
| State: | 31% |
Housing density: 1,147 houses/condos per square mile
Median price asked for vacant for-sale houses and condos in 2022: $71,445.
Median contract rent in 2022: $619 (lower quartile is $500, upper quartile is $701)
Median rent asked for vacant for-rent units in 2022: $603
Median gross rent in DuBois, PA in 2022: $709
Housing units in DuBois with a mortgage: 1,078 (107 second mortgage, 0 home equity loan, 116 both second mortgage and home equity loan)
Houses without a mortgage: 49
Median household income for houses/condos with a mortgage: $69,934
Median household income for apartments without a mortgage: $58,092
Median monthly housing costs: $737
Compare current foreclosures near DuBois, PA:
| Photo | Address | Area | Beds / Baths | Price | Details |
|---|---|---|---|---|---|

|
#1
Jackson St
Reynoldsville, PA 15851
|
797 sq. feet
|
- baths - beds |
$25,900
|
show details |

|
#2
Ridge Ave
Punxsutawney, PA 15767
|
848 sq. feet
|
- baths - beds |
$14,900
|
show details |

|
#3
Kerner Rd
Brookville, PA 15825
|
784 sq. feet
|
1 baths 1 beds |
show details | |

|
#4
Route 36
Punxsutawney, PA 15767
|
737 sq. feet
|
- baths - beds |
show details | |

|
#5
Shardan Ave
Curwensville, PA 16833
|
- sq. feet
|
- baths - beds |
show details | |

|
#6
Allens Mills Rd
Reynoldsville, PA 15851
|
1,152 sq. feet
|
- baths - beds |
show details | |

|
#7
Parrish Rd
Mahaffey, PA 15757
|
- sq. feet
|
- baths - beds |
show details | |

|
#8
Hartzfeld Rd
Punxsutawney, PA 15767
|
672 sq. feet
|
- baths - beds |
show details | |

|
#9
Robertsville Rd
Punxsutawney, PA 15767
|
- sq. feet
|
- baths - beds |
show details | |

|
#10
Hormtown Rd
Reynoldsville, PA 15851
|
1,232 sq. feet
|
- baths - beds |
show details |
| Photo | Address | Area | Beds / Baths | Price | Details |
|---|---|---|---|---|---|

|
#11
1st St
Grampian, PA 16838
|
- sq. feet
|
- baths - beds |
show details | |

|
#12
Brocious Rd
Brookville, PA 15825
|
- sq. feet
|
- baths - beds |
show details | |

|
#13
Route 28 N
Brookville, PA 15825
|
618 sq. feet
|
- baths - beds |
show details | |

|
#14
1st St
De Lancey, PA 15733
|
- sq. feet
|
- baths - beds |
show details | |

|
#15
Fairview Ave
Punxsutawney, PA 15767
|
- sq. feet
|
- baths - beds |
show details | |

|
#16
Filbert St
Curwensville, PA 16833
|
- sq. feet
|
- baths - beds |
show details | |

|
#17
Belmont Ave
Punxsutawney, PA 15767
|
700 sq. feet
|
- baths - beds |
show details | |

|
#18
Main St
Brockway, PA 15824
|
- sq. feet
|
- baths - beds |
show details | |

|
#19
W Mahoning St
Punxsutawney, PA 15767
|
- sq. feet
|
- baths - beds |
show details | |

|
#20
Witherow St
Punxsutawney, PA 15767
|
- sq. feet
|
- baths - beds |
show details |
| Photo | Address | Area | Beds / Baths | Price | Details |
|---|---|---|---|---|---|

|
#21
Treasure Lk
Du Bois, PA 15801
|
- sq. feet
|
- baths - beds |
show details | |

|
#22
Atlantic Ave
Du Bois, PA 15801
|
- sq. feet
|
- baths - beds |
show details | |

|
#23
E Maloney Rd Apt B
Du Bois, PA 15801
|
- sq. feet
|
- baths - beds |
show details | |

|
#24
Indiana St
Punxsutawney, PA 15767
|
784 sq. feet
|
- baths - beds |
show details | |

|
#25
Fuller Ave # Po
Falls Creek, PA 15840
|
- sq. feet
|
- baths - beds |
show details | |

|
#26
Fuller Ave # B
Falls Creek, PA 15840
|
- sq. feet
|
- baths - beds |
show details | |

|
#27
W Liberty St
Punxsutawney, PA 15767
|
609 sq. feet
|
- baths - beds |
show details | |

|
#28
Treasure Lk
Du Bois, PA 15801
|
- sq. feet
|
- baths - beds |
show details | |

|
#29
Bradford St
Reynoldsville, PA 15851
|
900 sq. feet
|
- baths - beds |
show details | |

|
#30
Clipperton Rd
Du Bois, PA 15801
|
- sq. feet
|
- baths - beds |
show details |
| Photo | Address | Area | Beds / Baths | Price | Details |
|---|---|---|---|---|---|

|
#31
W Mahoning St
Punxsutawney, PA 15767
|
- sq. feet
|
- baths - beds |
show details | |

|
#32
W Main St
Sykesville, PA 15865
|
- sq. feet
|
- baths - beds |
show details | |

|
#33
Hill St
Sykesville, PA 15865
|
- sq. feet
|
- baths - beds |
show details | |

|
#34
Grant St
Reynoldsville, PA 15851
|
648 sq. feet
|
- baths - beds |
show details | |

|
#35
Grant St
Reynoldsville, PA 15851
|
840 sq. feet
|
- baths - beds |
show details | |

|
#36
Hounddog Dr
Brockway, PA 15824
|
- sq. feet
|
- baths - beds |
show details | |

|
#37
Shardan Ave
Curwensville, PA 16833
|
- sq. feet
|
- baths - beds |
show details | |

|
#38
S Brady St
Du Bois, PA 15801
|
- sq. feet
|
- baths - beds |
show details | |

|
#39
Elk Run Ave
Punxsutawney, PA 15767
|
- sq. feet
|
- baths - beds |
show details | |

|
#40
N 6th St
Grampian, PA 16838
|
- sq. feet
|
- baths - beds |
show details |
| Photo | Address | Area | Beds / Baths | Price | Details |
|---|---|---|---|---|---|

|
#41
Mccullough St
Du Bois, PA 15801
|
- sq. feet
|
- baths - beds |
show details | |

|
#42
Redwood Dr
Penfield, PA 15849
|
- sq. feet
|
- baths - beds |
show details | |

|
#43
Duttry Rd
Du Bois, PA 15801
|
- sq. feet
|
- baths - beds |
show details | |

|
#44
Sher De Lin Rd
Du Bois, PA 15801
|
- sq. feet
|
- baths - beds |
show details | |

|
#45
Rockton Rd
Du Bois, PA 15801
|
- sq. feet
|
- baths - beds |
show details | |

|
#46
Chestnut Grove Hwy
Grampian, PA 16838
|
- sq. feet
|
- baths - beds |
show details | |

|
Check over 1 million property listings on Foreclosure.com!
|
browse all offers | |||

Latest news about housing in DuBois, PA collected exclusively by city-data.com from local newspapers, TV, and radio stations

 | DuBois and Treasure Lake (32 replies) |
| PA has 7 of the top 10 places to retire. (35 replies) |
| PA picture thread (178 replies) |
| Which metro area to move to in PA? (51 replies) |
| Affordable "small" towns with beautiful houses and downtowns? (58 replies) |
| Moving to PA... Where would you live (rural areas only) ? (74 replies) |

Median year apartment built: 1967
Household type by relationship:
Households: 7,339- Male householders: 1,606 (619 living alone), Female householders: 1,688 (682 living alone)
1,160 spouses (1,160 opposite-sex spouses), 368 unmarried partners, (368 opposite-sex unmarried partners), 2,136 children (1,921 natural, 67 adopted, 147 stepchildren), 86 grandchildren, 35 brothers or sisters, 37 parents, 0 foster children, 61 other relatives, 74 non-relatives
- In group quarters: 83
Size of family households: 825 2-persons, 455 3-persons, 256 4-persons, 106 5-persons, 173 6-persons, 14 7-or-more-persons.
Size of nonfamily households: 1,406 1-person, 156 2-persons, 7 5-persons.
1,089 married couples with children.
368 single-parent households (225 men, 143 women).
97.6% of residents of DuBois speak English at home.
0.4% of residents speak Spanish at home (100% speak English very well).
1.0% of residents speak other Indo-European language at home (62% speak English very well, 9% speak English not well, 29% don't speak English at all).
0.4% of residents speak Asian or Pacific Island language at home (100% speak English very well).
Foreign born population: 34 (0.5%)
(105.9% of them are naturalized citizens)
| Here: | 7.1 |
| State: | 6.8 |
| Here: | 4.4 |
| State: | 4.3 |
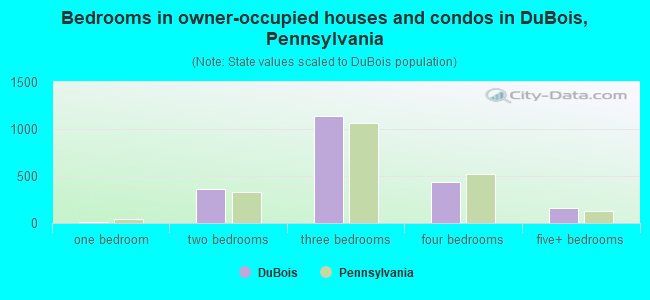
- Bedrooms in owner-occupied houses and condos in DuBois, Pennsylvania
- 0no bedroom
- 71 bedroom
- 3582 bedrooms
- 1,1343 bedrooms
- 4314 bedrooms
- 1615+ bedrooms
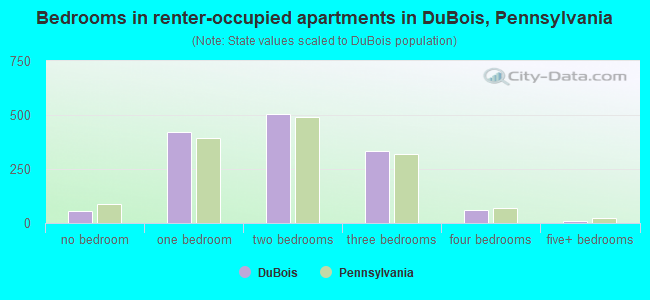
- Bedrooms in renter-occupied apartments in DuBois, Pennsylvania
- 55no bedroom
- 4201 bedroom
- 5062 bedrooms
- 3333 bedrooms
- 614 bedrooms
- 105+ bedrooms
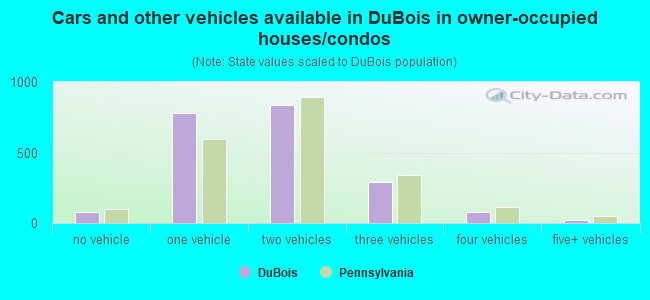
- Cars and other vehicles available in DuBois in owner-occupied houses/condos
- 81no vehicle
- 7821 vehicle
- 8352 vehicles
- 2883 vehicles
- 814 vehicles
- 235+ vehicles
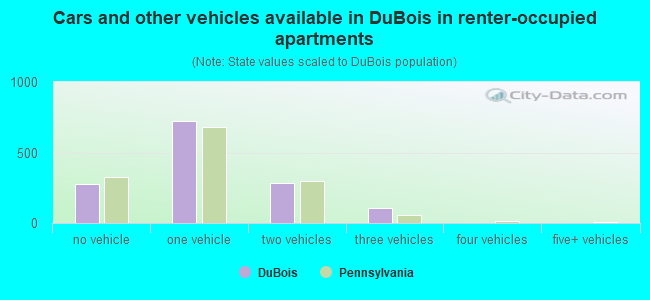
- Cars and other vehicles available in DuBois in renter-occupied apartments
- 274no vehicle
- 7241 vehicle
- 2812 vehicles
- 1053 vehicles
- 04 vehicles
- 05+ vehicles
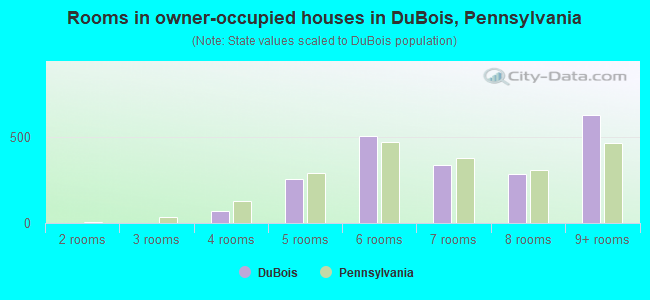
- Rooms in owner-occupied houses in DuBois, Pennsylvania
- 01 room
- 02 rooms
- 03 rooms
- 694 rooms
- 2595 rooms
- 5066 rooms
- 3387 rooms
- 2888 rooms
- 6319+ rooms
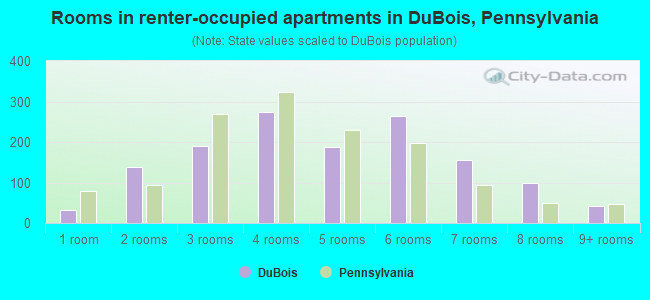
- Rooms in renter-occupied apartments in DuBois, Pennsylvania
- 321 room
- 1382 rooms
- 1913 rooms
- 2754 rooms
- 1885 rooms
- 2646 rooms
- 1567 rooms
- 1008 rooms
- 429+ rooms
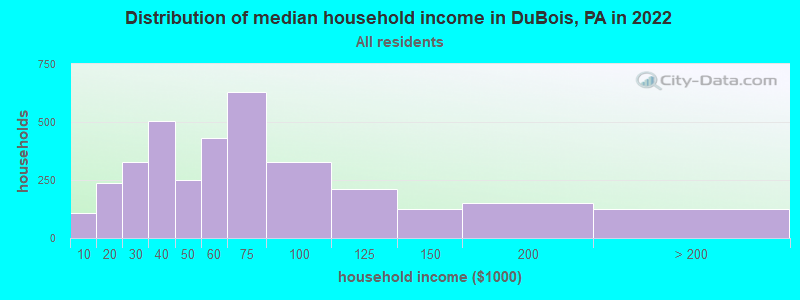
DuBois, PA household income distribution

- 109Less than $10,000
- 239$10,000 to $19,999
- 328$20,000 to $29,999
- 506$30,000 to $39,999
- 251$40,000 to $49,999
- 433$50,000 to $59,999
- 629$60,000 to $74,999
- 327$75,000 to $99,999
- 211$100,000 to $124,999
- 125$125,000 to $149,999
- 149$150,000 to $199,999
- 127$200,000 or more
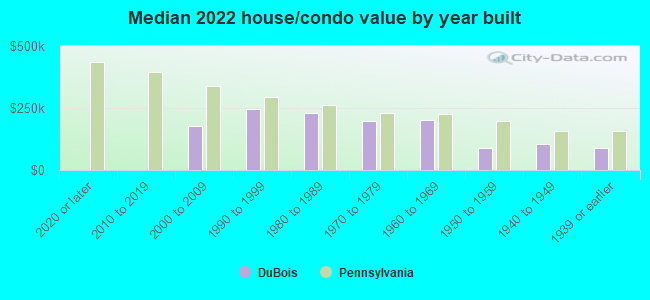
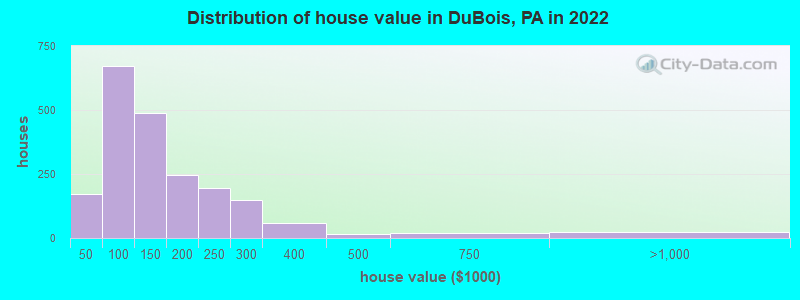
Home value of owner - occupied houses in 2022 in DuBois, PA
-
- 9Less than $10,000
- 13$10,000 to $14,999
- 33$15,000 to $19,999
- 9$20,000 to $24,999
- 15$25,000 to $29,999
- 10$30,000 to $34,999
- 49$35,000 to $39,999
- 28$40,000 to $49,999
- 25$50,000 to $59,999
- 85$60,000 to $69,999
- 154$70,000 to $79,999
- 238$80,000 to $89,999
- 141$90,000 to $99,999
- 355$100,000 to $124,999
- 133$125,000 to $149,999
- 145$150,000 to $174,999
- 102$175,000 to $199,999
- 194$200,000 to $249,999
- 150$250,000 to $299,999
- 58$300,000 to $399,999
- 14$400,000 to $499,999
- 19$500,000 to $749,999
- 24$750,000 to $999,999
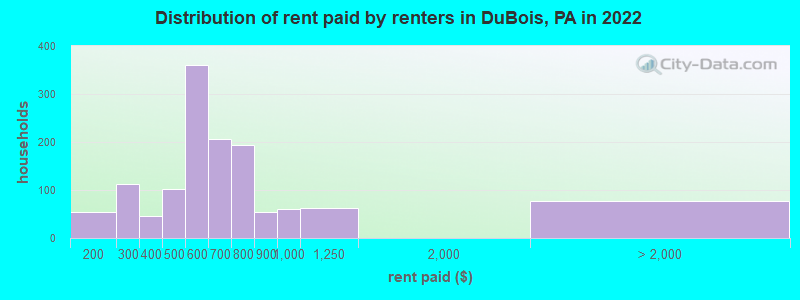
Rent paid by renters in 2022 in DuBois, PA
-
- 40$100 to $149
- 14$150 to $199
- 16$200 to $249
- 96$250 to $299
- 23$300 to $349
- 22$350 to $399
- 31$400 to $449
- 70$450 to $499
- 187$500 to $549
- 172$550 to $599
- 113$600 to $649
- 93$650 to $699
- 113$700 to $749
- 79$750 to $799
- 54$800 to $899
- 61$900 to $999
- 63$1,000 to $1,249
- 9$2,000 to $2,499
- 68No cash rent
Percentage of workers working in this county: 81.5%
Number of people working at home: 289 (7.5% of all workers)
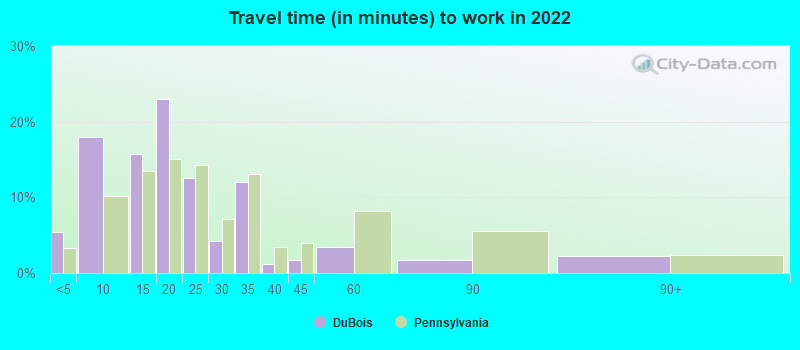
Travel time to work (commute)
- Less than 5 minutes: 278
- 5 to 9 minutes: 1,273
- 10 to 14 minutes: 587
- 15 to 19 minutes: 525
- 20 to 24 minutes: 248
- 25 to 29 minutes: 45
- 30 to 34 minutes: 342
- 35 to 39 minutes: 90
- 40 to 44 minutes: 15
- 45 to 59 minutes: 152
- 60 to 89 minutes: 49
- 90 or more minutes: 61
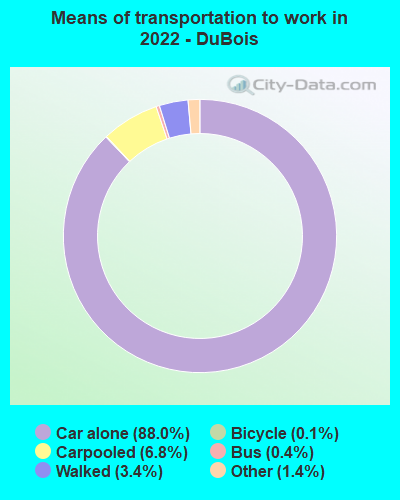
Means of transportation to work:
- Drove a car alone: 7,747 (83.0%)
- Carpooled: 595 (6.4%)
- Bus: 26 (0.3%)
- Taxi: 147 (1.6%)
- Bicycle: 11 (0.1%)
- Walked: 298 (3.2%)
- Worked at home: 289 (3.1%)
- Unemployment by race in 2022
- Unemployment rate for White non-Hispanic residents
- 2.8%Males
- 4.8%Females
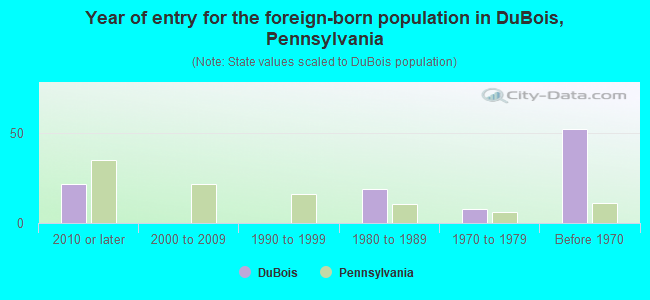
- Year of entry for the foreign-born population in DuBois, Pennsylvania
- 222010 or later
- 02000 to 2009
- 01990 to 1999
- 191980 to 1989
- 81970 to 1979
- 52Before 1970
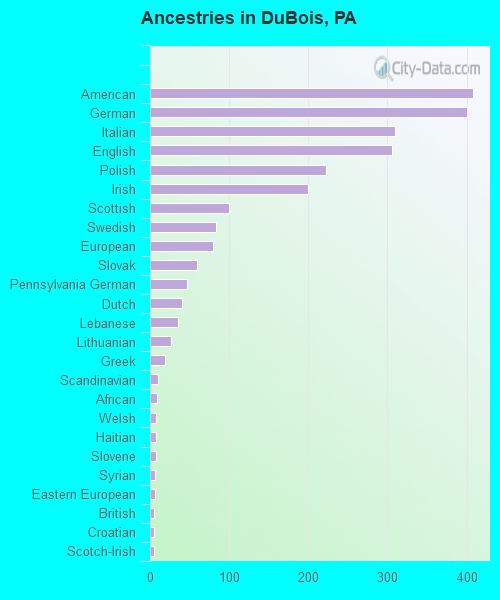
First ancestries reported:
- American: 408 (15.5%)
- German: 400 (15.2%)
- Italian: 310 (11.8%)
- English: 306 (11.6%)
- Polish: 222 (8.4%)
- Irish: 200 (7.6%)
- Scottish: 100 (3.8%)
- Swedish: 83 (3.2%)
- European: 79 (3.0%)
- Slovak: 59 (2.2%)
- Pennsylvania German: 47 (1.8%)
- Dutch: 41 (1.6%)
- Lebanese: 35 (1.3%)
- Lithuanian: 26 (1.0%)
- Greek: 19 (0.7%)
- Scandinavian: 10 (0.4%)
- African: 9 (0.3%)
- Welsh: 8 (0.3%)
- Haitian: 8 (0.3%)
- Slovene: 7 (0.3%)
- Syrian: 6 (0.2%)
- Eastern European: 6 (0.2%)
- British: 5 (0.2%)
- Croatian: 5 (0.2%)
- Scotch-Irish: 5 (0.2%)
Most common places of birth for foreign-born residents (%):
| DuBois: | 39.3% (22) |
| Pennsylvania: | 1.8% (17,032) |
| DuBois: | 37.5% (21) |
| Pennsylvania: | 10.7% (100,596) |
| DuBois: | 12.5% (7) |
| Pennsylvania: | 1.6% (15,224) |
Place of birth for U.S.-born residents:
- This state: 6,519
- Other state: 809
- Northeast: 366
- Midwest: 156
- South: 204
- West: 62
87.4% of DuBois residents lived in the same house 1 years ago.
Out of people who lived in different houses, 33.7% lived in this county.
Out of people who lived in different counties, 93.6% lived in Pennsylvania.
| DuBois: | 87.4% |
| State average: | 89.3% |
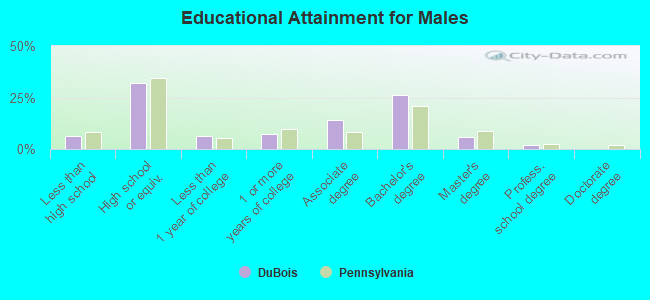
Education attainment for males 25 years and older:
- No schooling: 7
- Nursery to 4th grade: 0
- 5th and 6th grade: 0
- 7th and 8th grade: 45
- 9th grade: 0
- 10th grade: 14
- 11th grade: 28
- 12th grade, no diploma: 68
- High school graduate (or equivalency): 810
- Less than 1 year of college: 161
- Some college more than 1 year, no degree: 186
- Associate degree: 357
- Bachelor's degree: 659
- Master's degree: 144
- Professional school degree: 46
- Doctorate degree: 0
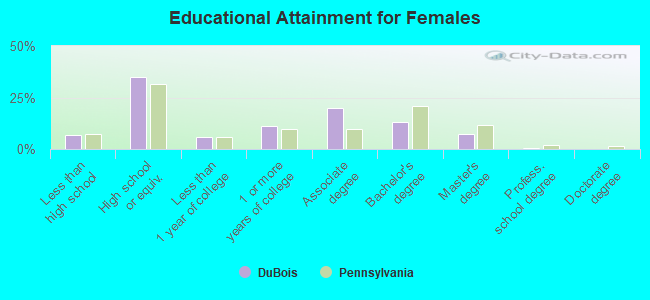
Education attainment for females 25 years and older:
- No schooling: 73
- Nursery to 4th grade: 0
- 5th and 6th grade: 0
- 7th and 8th grade: 8
- 9th grade: 40
- 10th grade: 20
- 11th grade: 47
- 12th grade, no diploma: 0
- High school graduate (or equivalency): 955
- Less than 1 year of college: 164
- Some college more than 1 year, no degree: 308
- Associate degree: 544
- Bachelor's degree: 365
- Master's degree: 203
- Professional school degree: 13
- Doctorate degree: 0


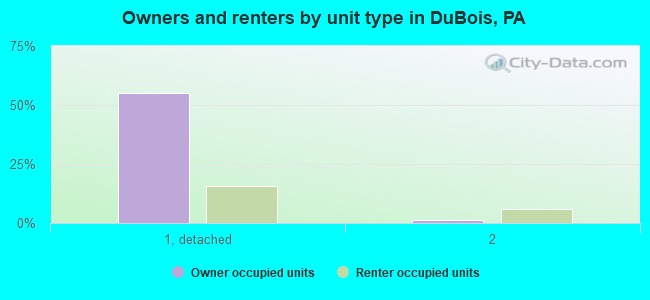
Housing units in structures:
- One, detached: 2,666
- One, attached: 105
- Two: 281
- 3 or 4: 165
- 5 to 9: 357
- 10 to 19: 64
- 20 to 49: 46
- 50 or more: 138
- Mobile homes: 10
Housing units lacking complete kitchen facilities in 2022: 4.3%
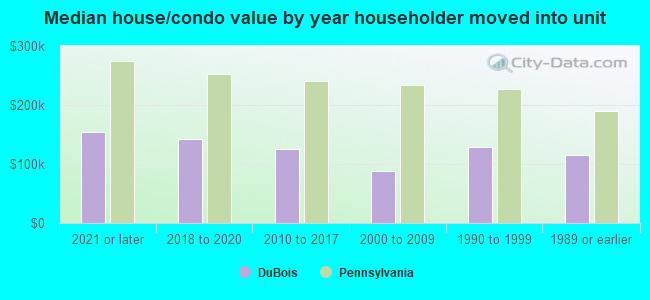
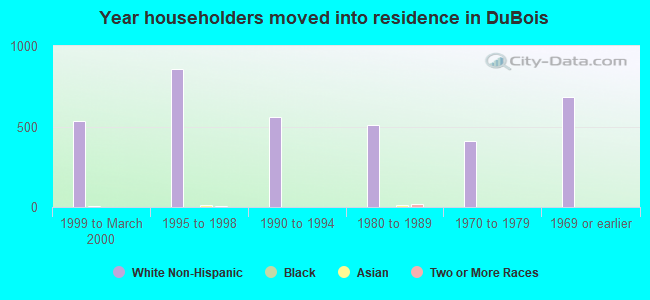
House/condo owner moved in on average 15 years ago
Renter moved in on average 3 years ago
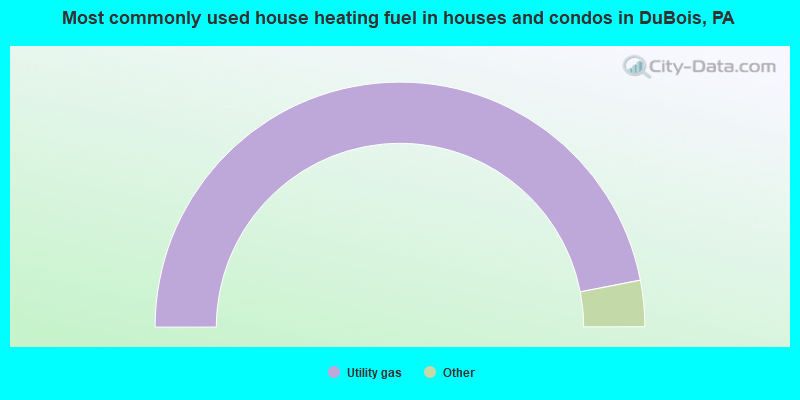
- 93.9%Utility gas
- 3.6%Electricity
- 1.3%Bottled, tank, or LP gas
- 1.1%Fuel oil, kerosene, etc.
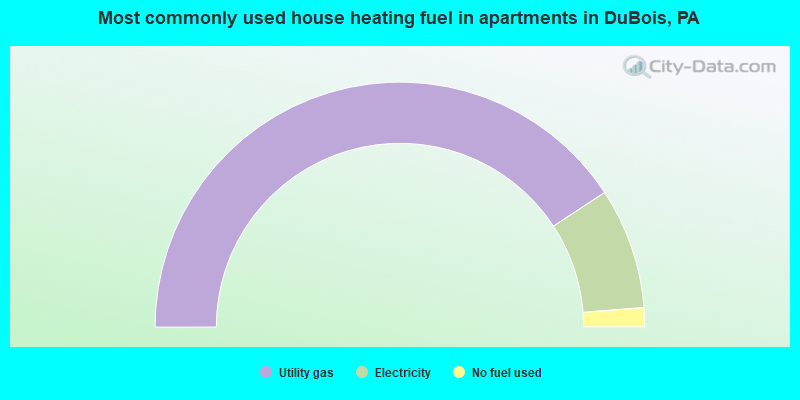
- 81.5%Utility gas
- 16.0%Electricity
- 2.5%No fuel used
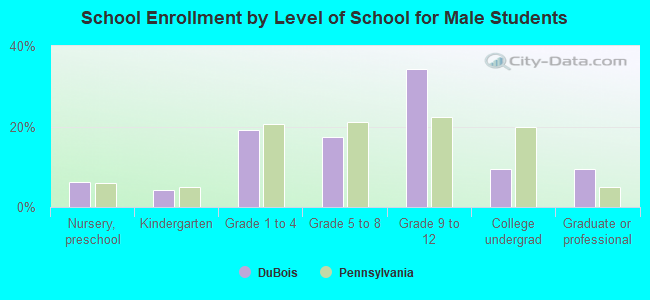
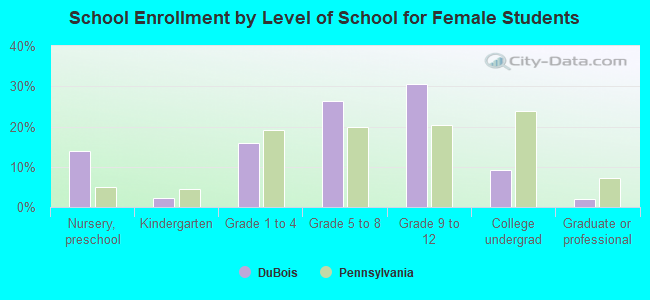
Private vs. public school enrollment:
| Here: | 14.5% |
| Pennsylvania: | 15.7% |
| Here: | 8.3% |
| Pennsylvania: | 13.4% |
| Here: | 22.7% |
| Pennsylvania: | 39.8% |