Downers Grove, IL (Illinois) Houses and Residents
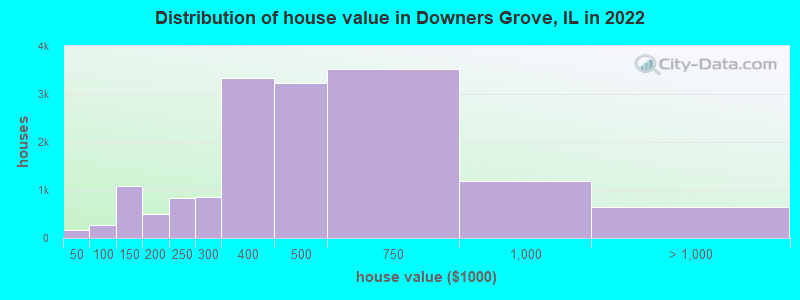
Estimated median house or condo value in 2022: $428,760 (it was $195,900 in 2000 )
Downers Grove:
$428,760Illinois:
$251,600
Lower value quartile - upper value quartile: $304,813 - $603,311Mean price in 2022: Detached houses: $521,238 Here:
$521,238State:
$310,164
Townhouses or other attached units: $290,001 Here:
$290,001State:
$286,230
In 3-to-4-unit structures: $287,680 Here:
$287,680State:
$330,907
In 5-or-more-unit structures: $185,453 Here:
$185,453State:
$318,887
Total population: 49,715 (Urban population: 48,638, Rural population: 0)
Houses: 21,232 (20,298 occupied: 15,281 owner occupied, 5,038 renter occupied )
% of renters here:
25%State:
33%
Housing density: 1,490 houses/condos per square mile
Median price asked for vacant for-sale houses and condos in 2022: $490,073.
Median contract rent in 2022: $1,468 (lower quartile is $1,027, upper quartile is $1,855)
Median rent asked for vacant for-rent units in 2022: $2,213
Median gross rent in Downers Grove, IL in 2022: $1,473
Housing units in Downers Grove with a mortgage: 9,413 (964 second mortgage, 9 home equity loan, 769 both second mortgage and home equity loan )Houses without a mortgage: 213
Median household income for houses/condos with a mortgage: $164,931
Median household income for apartments without a mortgage: $88,405
Median monthly housing costs: $1,591
Data:
Median house or condo value ($)
Median house or condo value ($ change since 2000)
Median house or condo value ($) - White
Median house or condo value ($) - Black or African American
Median house or condo value ($) - Asian
Median house or condo value ($) - Hispanic or Latino
Median house or condo value ($) - American Indian and Alaska Native
Median house or condo value ($) - Multirace
Median house or condo value ($) - Other Race
Median price asked for mobile homes ($)
Household density (households per square mile)
Mean house or condo value by units in structure - 1, detached ($)
Mean house or condo value by units in structure - 1, attached ($)
Mean house or condo value by units in structure - 2 ($)
Mean house or condo value by units in structure by units in structure - 3 or 4 ($)
Mean house or condo value by units in structure - 5 or more ($)
Mean house or condo value by units in structure - Boat, RV, van, etc. ($)
Mean house or condo value by units in structure - Mobile home ($)
Median contract rent ($)
Median contract rent - Lower quartile ($)
Median contract rent - Upper quartile ($)
Median gross rent ($)
Urban houses (%)
Rural houses (%)
Houses occupied (%)
Houses occupied (% change since 2000)
Houses owner occupied (%)
Houses owner occupied (% change since 2000)
Houses renter occupied (%)
Houses renter occupied (% change since 2000)
Vacant housing units - For rent (%)
Vacant housing units - For rent (% change since 2000)
Vacant housing units - For sale only (%)
Vacant housing units - For sale only (% change since 2000)
Vacant housing units - Rented or sold, not occupied (%)
Vacant housing units - Rented or sold, not occupied (% change since 2000)
Vacant housing units - For seasonal, recreational, or occasional use (%)
Vacant housing units - For seasonal, recreational, or occasional use (% change since 2000)
Vacant housing units - For migrant workers (%)
Vacant housing units - For migrant workers (% change since 2000)
Vacant housing units - Other vacant (%)
Vacant housing units - Other vacant (% change since 2000)
Median monthly housing costs ($)
Median household income for houses/condos with a mortgage ($)
Median household income for houses/condos without a mortgage ($)
Median household income ($)
Median household income ($) - White
Median household income ($) - Black or African American
Median household income ($) - Asian
Median household income ($) - Hispanic or Latino
Median household income ($) - American Indian and Alaska Native
Median household income ($) - Multirace
Median household income ($) - Other Race
Mortgage status - with mortgage (%)
Mortgage status - with second mortgage (%)
Mortgage status - with home equity loan (%)
Mortgage status - with both second mortgage and home equity loan (%)
Mortgage status - without a mortgage (%)
Median year house/condo built
Median year apartment built
Household type by relationship - Male householder living alone (%)
Household type by relationship - Male householder not living alone (%)
Household type by relationship - Female householder living alone (%)
Household type by relationship - Female householder not living alone (%)
Household type by relationship - Opposite-Sex spouse (%)
Household type by relationship - Same-Sex spouse (%)
Household type by relationship - Opposite-Sex unmarried partner (%)
Household type by relationship - Same-Sex unmarried partner (%)
Household type by relationship - In group quarters (%)
Size of family households - 2-person household (%)
Size of family households - 3-person household (%)
Size of family households - 4-person household (%)
Size of family households - 5-person household (%)
Size of family households - 6-person household (%)
Size of family households - 7-or-more-person household (%)
Size of nonfamily households - 1-person household (%)
Size of nonfamily households - 2-person household (%)
Size of nonfamily households - 3-person household (%)
Size of nonfamily households - 4-person household (%)
Size of nonfamily households - 5-person household (%)
Size of nonfamily households - 6-person household (%)
Size of nonfamily households - 7-or-moreperson household (%)
Year house built - Built 2010 or later (%)
Year house built - Built 2000 to 2009 (%)
Year house built - Built 1990 to 1999 (%)
Year house built - Built 1980 to 1989 (%)
Year house built - Built 1970 to 1979 (%)
Year house built - Built 1960 to 1969 (%)
Year house built - Built 1950 to 1959 (%)
Year house built - Built 1940 to 1949 (%)
Year house built - Built 1939 or earlier (%)
Median number of rooms in houses and condos
Median number of rooms in apartments
Median number of bedrooms in owner occupied houses
Mean number of bedrooms in owner occupied houses
Median number of bedrooms in renter occupied houses
Mean number of bedrooms in renter occupied houses
Median number of vehichles in owner occupied houses
Mean number of vehichles in owner occupied houses
Median number of vehichles in renter occupied houses
Mean number of vehichles in renter occupied houses
Rooms in owner-occupied houses - 1 room (%)
Rooms in owner-occupied houses - 2 rooms (%)
Rooms in owner-occupied houses - 3 rooms (%)
Rooms in owner-occupied houses - 4 rooms (%)
Rooms in owner-occupied houses - 5 rooms (%)
Rooms in owner-occupied houses - 6 rooms (%)
Rooms in owner-occupied houses - 7 rooms (%)
Rooms in owner-occupied houses - 8 rooms (%)
Rooms in owner-occupied houses - 9+ rooms (%)
Rooms in renter-occupied houses - 1 room (%)
Rooms in renter-occupied houses - 2 rooms (%)
Rooms in renter-occupied houses - 3 rooms (%)
Rooms in renter-occupied houses - 4 rooms (%)
Rooms in renter-occupied houses - 5 rooms (%)
Rooms in renter-occupied houses - 6 rooms (%)
Rooms in renter-occupied houses - 7 rooms (%)
Rooms in renter-occupied houses - 8 rooms (%)
Rooms in renter-occupied houses - 9+ rooms (%)
Bedrooms in owner-occupied houses - no bedrooms (%)
Bedrooms in owner-occupied houses - 1 bedroom (%)
Bedrooms in owner-occupied houses - 2 bedrooms (%)
Bedrooms in owner-occupied houses - 3 bedrooms (%)
Bedrooms in owner-occupied houses - 4 bedrooms (%)
Bedrooms in owner-occupied houses - 5+ bedrooms (%)
Bedrooms in renter-occupied houses - no bedrooms (%)
Bedrooms in renter-occupied houses - 1 bedroom (%)
Bedrooms in renter-occupied houses - 2 bedrooms (%)
Bedrooms in renter-occupied houses - 3 bedrooms (%)
Bedrooms in renter-occupied houses - 4 bedrooms (%)
Bedrooms in renter-occupied houses - 5+ bedrooms (%)
Vehicles available in owner-occupied houses - no vehicle available (%)
Vehicles available in owner-occupied houses - 1 vehicle available(%)
Vehicles available in owner-occupied houses - 2 Vehicles available (%)
Vehicles available in owner-occupied houses - 3 Vehicles available (%)
Vehicles available in owner-occupied houses - 4 Vehicles available (%)
Vehicles available in owner-occupied houses - 5+ Vehicles available (%)
Vehicles available in renter-occupied houses - no vehicle available (%)
Vehicles available in renter-occupied houses - 1 vehicle available (%)
Vehicles available in renter-occupied houses - 2 Vehicles available (%)
Vehicles available in renter-occupied houses - 3 Vehicles available (%)
Vehicles available in renter-occupied houses - 4 Vehicles available (%)
Vehicles available in renter-occupied houses - 5+ Vehicles available (%)
Housing units in structures - 1, detached (%)
Housing units in structures - 1, attached (%)
Housing units in structures - 2 (%)
Housing units in structures - 3 or 4 (%)
Housing units in structures - 5 to 9 (%)
Housing units in structures - 10 to 19 (%)
Housing units in structures - 20 to 49 (%)
Housing units in structures - 50 or more (%)
Housing units in structures - Mobile home (%)
Housing units in structures - Boat, RV, van, etc. (%)
Housing units in structures - Owners - 1, detached (%)
Housing units in structures - Owners - 1, attached (%)
Housing units in structures - Owners - 2 (%)
Housing units in structures - Owners - 3 or 4 (%)
Housing units in structures - Owners - 5 to 9 (%)
Housing units in structures - Owners - 10 to 19 (%)
Housing units in structures - Owners - 20 to 49 (%)
Housing units in structures - Owners - 50 or more (%)
Housing units in structures - Owners - Mobile home (%)
Housing units in structures - Owners - Boat, RV, van, etc. (%)
Housing units in structures - Renters - 1, detached (%)
Housing units in structures - Renters - 1, attached (%)
Housing units in structures - Renters - 2 (%)
Housing units in structures - Renters - 3 or 4 (%)
Housing units in structures - Renters - 5 to 9 (%)
Housing units in structures - Renters - 10 to 19 (%)
Housing units in structures - Renters - 20 to 49 (%)
Housing units in structures - Renters - 50 or more (%)
Housing units in structures - Renters - Mobile home (%)
Housing units in structures - Renters - Boat, RV, van, etc. (%)
House/condo owner moved in on average (years ago)
Renter moved in on average (years ago)
Year householder moved into unit - Moved in 1999 to March 2000 (%)
Year householder moved into unit - Moved in 1999 to March 2000 (%) - White
Year householder moved into unit - Moved in 1999 to March 2000 (%) - Black or African American
Year householder moved into unit - Moved in 1999 to March 2000 (%) - Asian
Year householder moved into unit - Moved in 1999 to March 2000 (%) - Hispanic or Latino
Year householder moved into unit - Moved in 1999 to March 2000 (%) - American Indian and Alaska Native
Year householder moved into unit - Moved in 1999 to March 2000 (%) - Multirace
Year householder moved into unit - Moved in 1999 to March 2000 (%) - Other Race
Year householder moved into unit - Moved in 1995 to 1998 (%)
Year householder moved into unit - Moved in 1995 to 1998 (%) - White
Year householder moved into unit - Moved in 1995 to 1998 (%) - Black or African American
Year householder moved into unit - Moved in 1995 to 1998 (%) - Asian
Year householder moved into unit - Moved in 1995 to 1998 (%) - Hispanic or Latino
Year householder moved into unit - Moved in 1995 to 1998 (%) - American Indian and Alaska Native
Year householder moved into unit - Moved in 1995 to 1998 (%) - Multirace
Year householder moved into unit - Moved in 1995 to 1998 (%) - Other Race
Year householder moved into unit - Moved in 1990 to 1994 (%)
Year householder moved into unit - Moved in 1990 to 1994 (%) - White
Year householder moved into unit - Moved in 1990 to 1994 (%) - Black or African American
Year householder moved into unit - Moved in 1990 to 1994 (%) - Asian
Year householder moved into unit - Moved in 1990 to 1994 (%) - Hispanic or Latino
Year householder moved into unit - Moved in 1990 to 1994 (%) - American Indian and Alaska Native
Year householder moved into unit - Moved in 1990 to 1994 (%) - Multirace
Year householder moved into unit - Moved in 1990 to 1994 (%) - Other Race
Year householder moved into unit - Moved in 1980 to 1989 (%)
Year householder moved into unit - Moved in 1980 to 1989 (%) - White
Year householder moved into unit - Moved in 1980 to 1989 (%) - Black or African American
Year householder moved into unit - Moved in 1980 to 1989 (%) - Asian
Year householder moved into unit - Moved in 1980 to 1989 (%) - Hispanic or Latino
Year householder moved into unit - Moved in 1980 to 1989 (%) - American Indian and Alaska Native
Year householder moved into unit - Moved in 1980 to 1989 (%) - Multirace
Year householder moved into unit - Moved in 1980 to 1989 (%) - Other Race
Year householder moved into unit - Moved in 1970 to 1979 (%)
Year householder moved into unit - Moved in 1970 to 1979 (%) - White
Year householder moved into unit - Moved in 1970 to 1979 (%) - Black or African American
Year householder moved into unit - Moved in 1970 to 1979 (%) - Asian
Year householder moved into unit - Moved in 1970 to 1979 (%) - Hispanic or Latino
Year householder moved into unit - Moved in 1970 to 1979 (%) - American Indian and Alaska Native
Year householder moved into unit - Moved in 1970 to 1979 (%) - Multirace
Year householder moved into unit - Moved in 1970 to 1979 (%) - Other Race
Year householder moved into unit - Moved in 1969 or earlier (%)
Year householder moved into unit - Moved in 1969 or earlier (%) - White
Year householder moved into unit - Moved in 1969 or earlier (%) - Black or African American
Year householder moved into unit - Moved in 1969 or earlier (%) - Asian
Year householder moved into unit - Moved in 1969 or earlier (%) - Hispanic or Latino
Year householder moved into unit - Moved in 1969 or earlier (%) - American Indian and Alaska Native
Year householder moved into unit - Moved in 1969 or earlier (%) - Multirace
Year householder moved into unit - Moved in 1969 or earlier (%) - Other Race
Housing units lacking complete plumbing facilities (%)
Housing units lacking complete kitchen facilities (%)
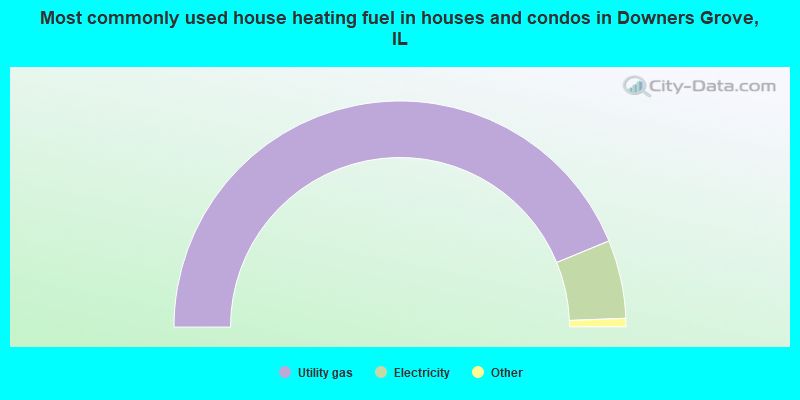
House heating fuel used in houses and condos - Utility gas (%)
House heating fuel used in houses and condos - Bottled, tank, or LP gas (%)
House heating fuel used in houses and condos - Electricity (%)
House heating fuel used in houses and condos - Fuel oil, kerosene, etc. (%)
House heating fuel used in houses and condos - Coal or coke (%)
House heating fuel used in houses and condos - Wood (%)
House heating fuel used in houses and condos - Solar energy (%)
House heating fuel used in houses and condos - Other fuel (%)
House heating fuel used in houses and condos - No fuel used (%)
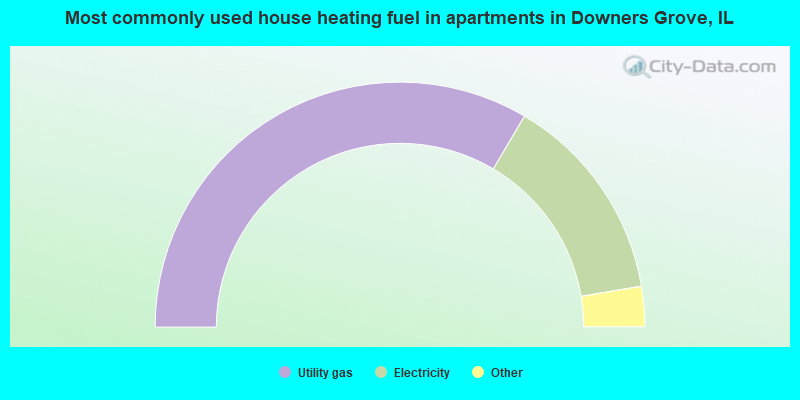
House heating fuel used in apartments - Utility gas (%)
House heating fuel used in apartments - Bottled, tank, or LP gas (%)
House heating fuel used in apartments - Electricity (%)
House heating fuel used in apartments - Fuel oil, kerosene, etc. (%)
House heating fuel used in apartments - Coal or coke (%)
House heating fuel used in apartments - Wood (%)
House heating fuel used in apartments - Solar energy (%)
House heating fuel used in apartments - Other fuel (%)
House heating fuel used in apartments - No fuel used (%)
Median year house/condo built: 1972Median year apartment built: 1977Household type by relationship:
Households: 49,477
Male householders: 10,356 (2,123 living alone ), Female householders: 9,630 (3,677 living alone )11,076 spouses (11,021 opposite-sex spouses ), 1,133 unmarried partners , (1,100 opposite-sex unmarried partners ), 14,746 children (14,075 natural , 315 adopted , 355 stepchildren ), 450 grandchildren , 211 brothers or sisters , 248 parents , 102 foster children , 404 other relatives , 618 non-relatives In group quarters: 497
Size of family households: 6,382 2-persons , 2,722 3-persons , 2,671 4-persons , 1,081 5-persons , 318 6-persons , 112 7-or-more-persons .
Size of nonfamily households: 6,012 1-person , 967 2-persons , 54 3-persons .
8,859 married couples with children. single-parent households (347 men , 719 women ).
85.7% of residents of Downers Grove speak English at home. of residents speak Spanish at home (73% speak English very well , 16% speak English well , 9% speak English not well , 2% don't speak English at all ).of residents speak other Indo-European language at home (62% speak English very well , 29% speak English well , 7% speak English not well , 2% don't speak English at all ).of residents speak Asian or Pacific Island language at home (60% speak English very well , 17% speak English well , 8% speak English not well , 15% don't speak English at all ).of residents speak other language at home (80% speak English very well , 15% speak English not well , 5% don't speak English at all ).
Foreign born population: 5,476 (11.1%)of them are naturalized citizens )
Median number of rooms in houses and condos:
Median number of rooms in apartments
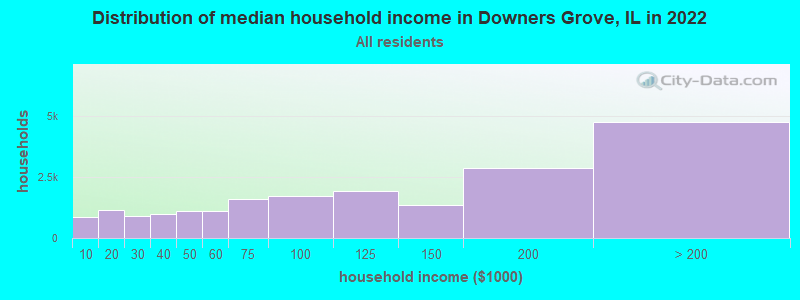
Downers Grove, IL household income distribution 856 Less than $10,0001,156 $10,000 to $19,999886 $20,000 to $29,999988 $30,000 to $39,9991,125 $40,000 to $49,9991,123 $50,000 to $59,9991,590 $60,000 to $74,9991,737 $75,000 to $99,9991,922 $100,000 to $124,9991,339 $125,000 to $149,9992,848 $150,000 to $199,9994,746 $200,000 or more
Home value of owner - occupied houses in 2022 in Downers Grove, IL 108 Less than $10,0008 $15,000 to $19,99921 $25,000 to $29,99910 $30,000 to $34,9992 $35,000 to $39,99911 $40,000 to $49,9994 $50,000 to $59,99926 $60,000 to $69,99942 $80,000 to $89,999176 $90,000 to $99,999542 $100,000 to $124,999533 $125,000 to $149,999211 $150,000 to $174,999291 $175,000 to $199,999838 $200,000 to $249,999861 $250,000 to $299,9993,325 $300,000 to $399,9993,239 $400,000 to $499,9993,529 $500,000 to $749,9991,196 $750,000 to $999,999479 $1,000,000 to $1,499,99983 $1,500,000 to $1,999,99982 $2,000,000 or moreRent paid by renters in 2022 in Downers Grove, IL 19 Less than $10016 $100 to $14960 $150 to $19927 $200 to $24985 $250 to $299176 $300 to $349136 $350 to $39914 $400 to $44917 $450 to $49975 $600 to $64961 $700 to $74972 $750 to $79980 $800 to $899224 $900 to $999829 $1,000 to $1,249470 $1,250 to $1,4991,425 $1,500 to $1,999391 $2,000 to $2,49960 $2,500 to $2,99991 $3,000 to $3,499203 $3,500 or more159 No cash rent
Percentage of workers working in this county: 70.2%Number of people working at home: 6,328 (25.2% of all workers )
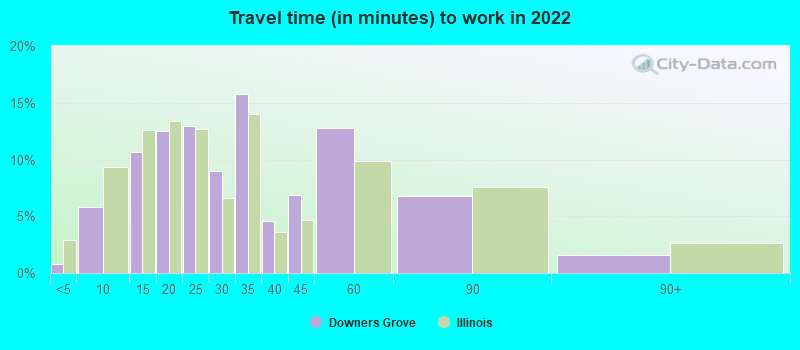
Travel time to work (commute)
Less than 5 minutes: 3025 to 9 minutes: 1,34810 to 14 minutes: 2,52215 to 19 minutes: 3,19220 to 24 minutes: 2,29225 to 29 minutes: 1,43830 to 34 minutes: 2,68435 to 39 minutes: 60940 to 44 minutes: 87345 to 59 minutes: 2,06060 to 89 minutes: 1,47890 or more minutes: 234
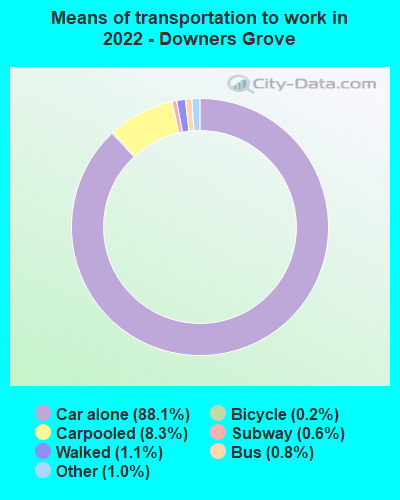
Means of transportation to work:
Drove a car alone: 30,737 (72.9%)Carpooled: 3,549 (8.4%)Bus : 443 (1.1%)Subway or elevated rail : 19 (0.0%)Long-distance train or commuter rail : 185 (0.4%)Taxi: 381 (0.9%)Bicycle: 46 (0.1%)Walked: 353 (0.8%)Worked at home: 6,328 (15.0%)
Unemployment by race in 2022
Unemployment rate for White non-Hispanic residents 4.2% Males2.2% FemalesUnemployment rate for Black residents 3.7% Males35.1% FemalesUnemployment rate for Asian residents 1.8% Males1.9% FemalesUnemployment rate for other race residents 7.2% FemalesUnemployment rate for two or more race residents 0.1% MalesUnemployment rate for Hispanic or Latino residents 0.1% Males1.2% Females
Year of entry for the foreign-born population in Downers Grove, Illinois
1,270 2010 or later 1,434 2000 to 2009 897 1990 to 1999 1,157 1980 to 1989 842 1970 to 1979 1,013 Before 1970
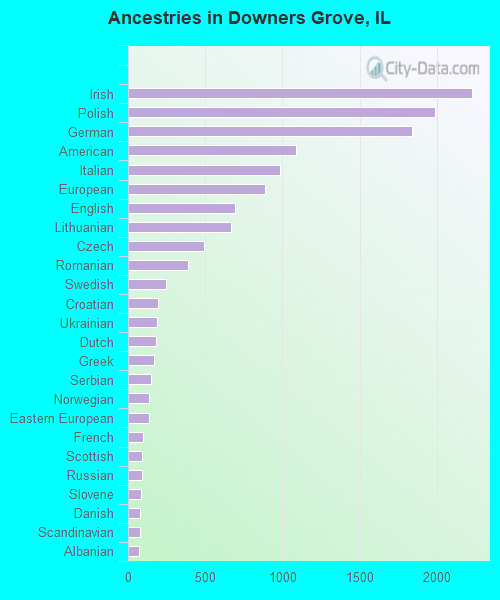
First ancestries reported:
Irish: 2,227 (11.5%)
Polish: 1,986 (10.3%)
German: 1,842 (9.5%)
American: 1,089 (5.6%)
Italian: 984 (5.1%)
European: 889 (4.6%)
English: 690 (3.6%)
Lithuanian: 665 (3.4%)
Czech: 495 (2.6%)
Romanian: 389 (2.0%)
Swedish: 243 (1.3%)
Croatian: 196 (1.0%)
Ukrainian: 188 (1.0%)
Dutch: 183 (0.9%)
Greek: 168 (0.9%)
Serbian: 146 (0.8%)
Norwegian: 137 (0.7%)
Eastern European: 136 (0.7%)
French: 94 (0.5%)
Scottish: 92 (0.5%)
Russian: 89 (0.5%)
Slovene: 81 (0.4%)
Danish: 79 (0.4%)
Scandinavian: 75 (0.4%)
Albanian: 73 (0.4%)
Assyrian: 65 (0.3%)
British: 62 (0.3%)
Yugoslavian: 57 (0.3%)
Ethiopian: 54 (0.3%)
Swiss: 54 (0.3%)
Czechoslovakian: 49 (0.3%)
Egyptian: 47 (0.2%)
Slovak: 45 (0.2%)
Macedonian: 44 (0.2%)
Afghan: 42 (0.2%)
Scotch-Irish: 36 (0.2%)
Northern European: 35 (0.2%)
Hungarian: 31 (0.2%)
Ghanaian: 29 (0.2%)
Belgian: 28 (0.1%)
Turkish: 19 (0.10%)
Palestinian: 18 (0.09%)
Canadian: 17 (0.09%)
Armenian: 16 (0.08%)
Celtic: 14 (0.07%)
Austrian: 14 (0.07%)
West Indian: 12 (0.06%)
African: 10 (0.05%)
Finnish: 9 (0.05%)
Welsh: 9 (0.05%)
Iraqi: 8 (0.04%)
Bulgarian: 7 (0.04%)
Jamaican: 7 (0.04%)
Belizean: 1 (0.01%)
Most common places of birth for foreign-born residents (%): India Downers Grove:
17.2% (948)Illinois:
9.2% (166,409)
China, excluding Hong Kong and Taiwan Downers Grove:
9.6% (528)Illinois:
4.1% (74,364)
Mexico Downers Grove:
9.4% (516)Illinois:
34.7% (626,958)
Poland Downers Grove:
7.3% (403)Illinois:
6.9% (124,474)
Lithuania Downers Grove:
5.3% (293)Illinois:
0.6% (10,249)
Philippines Downers Grove:
4.5% (250)Illinois:
5.2% (93,003)
Ukraine Downers Grove:
3.7% (205)Illinois:
1.6% (29,316)
Romania Downers Grove:
2.7% (146)Illinois:
0.8% (14,736)
Italy Downers Grove:
2.3% (124)Illinois:
0.9% (15,679)
Korea Downers Grove:
2.1% (118)Illinois:
2.2% (40,393)
Czechoslovakia (includes Czech Republic and Slovakia) Downers Grove:
1.7% (95)Illinois:
0.3% (4,741)
Taiwan Downers Grove:
1.7% (95)Illinois:
0.5% (8,235)
Guatemala Downers Grove:
1.7% (91)Illinois:
1.3% (22,793)
Venezuela Downers Grove:
1.6% (90)Illinois:
0.5% (9,688)
Moldova Downers Grove:
1.6% (90)Illinois:
0.3% (4,938)
Croatia Downers Grove:
1.6% (88)Illinois:
0.2% (3,977)
Greece Downers Grove:
1.5% (83)Illinois:
0.6% (10,720)
Place of birth for U.S.-born residents:
This state: 34,537Other state: 8,874Northeast: 1,468Midwest: 4,935South: 1,567West: 941 89.5% of Downers Grove residents lived in the same house 1 years ago.
Out of people who lived in different houses, 33.0% lived in this county.
Out of people who lived in different counties, 82.3% lived in Illinois.
Downers Grove:
89.5%State average:
88.3%
Education attainment for males 25 years and older:
No schooling: 173Nursery to 4th grade: 05th and 6th grade: 167th and 8th grade: 239th grade: 1710th grade: 6311th grade: 7212th grade, no diploma: 178High school graduate (or equivalency): 2,217Less than 1 year of college: 1,070Some college more than 1 year, no degree: 1,544Associate degree: 1,017Bachelor's degree: 6,485Master's degree: 2,849Professional school degree: 916Doctorate degree: 502
Education attainment for females 25 years and older:
No schooling: 111Nursery to 4th grade: 195th and 6th grade: 387th and 8th grade: 2839th grade: 910th grade: 3911th grade: 14512th grade, no diploma: 102High school graduate (or equivalency): 2,569Less than 1 year of college: 1,041Some college more than 1 year, no degree: 1,725Associate degree: 1,571Bachelor's degree: 6,026Master's degree: 3,592Professional school degree: 693Doctorate degree: 559
Housing units in structures:
One, detached: 13,309One, attached: 1,318Two: 1683 or 4: 3575 to 9: 1,13510 to 19: 1,30820 to 49: 1,40950 or more: 2,085Mobile homes: 138Housing units lacking complete plumbing facilities in 2022: 0.3%Housing units lacking complete kitchen facilities in 2022: 1.8%House/condo owner moved in on average 13 years ago
Renter moved in on average 2 years ago
Private vs. public school enrollment:
Students in private schools in grades 1 to 8 (elementary and middle school): 914 Students in private schools in grades 9 to 12 (high school): 228 Students in private undergraduate colleges: 515