Deerfield, IL (Illinois) Houses and Residents
| Deerfield: | $620,699 |
| Illinois: | $251,600 |
Mean price in 2022:
Detached houses: $691,488
Here: $691,488 State: $310,164 Townhouses or other attached units: $454,164
Here: $454,164 State: $286,230 In 3-to-4-unit structures: $223,418
Here: $223,418 State: $330,907 In 5-or-more-unit structures: $365,803
Here: $365,803 State: $318,887
Total population: 18,385 (All urban)
Houses: 7,568 (7,392 occupied: 6,088 owner occupied, 1,444 renter occupied)
| % of renters here: | 19% |
| State: | 33% |
Housing density: 1,380 houses/condos per square mile
Median price asked for vacant for-sale houses and condos in 2022: $529,234.
Median contract rent in 2022: over $2,000 (lower quartile is $1,613, upper quartile is over $2,000)
Median gross rent in Deerfield, IL in 2022: over $2,000
Housing units in Deerfield with a mortgage: 3,750 (416 second mortgage, 4 home equity loan, 379 both second mortgage and home equity loan)
Houses without a mortgage: 146
Median household income for houses/condos with a mortgage: $219,864
Median household income for apartments without a mortgage: $144,318
Median monthly housing costs: $2,593
Compare current foreclosures near Deerfield, IL:
| Photo | Address | Area | Beds / Baths | Price | Details |
|---|---|---|---|---|---|

|
#1
Crestwood Ln
Deerfield, IL 60015
|
4,054 sq. feet
|
2 baths - beds |
show details | |

|
#2
Kenilwood Ln
Deerfield, IL 60015
|
2,916 sq. feet
|
2 baths - beds |
show details | |

|
#3
Martin Ln
Deerfield, IL 60015
|
2,000 sq. feet
|
2 baths - beds |
show details | |

|
#4
Riverwoods Rd
Deerfield, IL 60015
|
3,010 sq. feet
|
4 baths - beds |
show details | |

|
#5
Inverrary Ln
Deerfield, IL 60015
|
814 sq. feet
|
1 baths - beds |
show details | |

|
#6
Warrington Rd
Deerfield, IL 60015
|
1,461 sq. feet
|
1 baths - beds |
show details | |

|
#7
N Wildwood Ln
Deerfield, IL 60015
|
5,462 sq. feet
|
5 baths - beds |
show details | |

|
#8
Hunter Ct
Deerfield, IL 60015
|
2,602 sq. feet
|
2 baths - beds |
show details | |

|
#9
Woodward Ave
Deerfield, IL 60015
|
1,140 sq. feet
|
1 baths - beds |
show details | |

|
#10
Kildeer Ln
Deerfield, IL 60015
|
- sq. feet
|
- baths - beds |
show details |
| Photo | Address | Area | Beds / Baths | Price | Details |
|---|---|---|---|---|---|

|
#11
Osterman Ave Apt B
Deerfield, IL 60015
|
- sq. feet
|
- baths - beds |
show details | |

|
#12
Parkway N # 436
Deerfield, IL 60015
|
- sq. feet
|
- baths - beds |
show details | |

|
#13
Inverrary Ln
Deerfield, IL 60015
|
- sq. feet
|
- baths - beds |
show details | |

|
#14
Deerfield Rd Apt 2c
Deerfield, IL 60015
|
- sq. feet
|
- baths - beds |
show details | |

|
#15
Saunders Rd Ste 300
Deerfield, IL 60015
|
- sq. feet
|
- baths - beds |
show details | |

|
#16
Lake Cook Rd Ste 315
Deerfield, IL 60015
|
- sq. feet
|
- baths - beds |
show details | |

|
#17
Lake Cook Rd Ste 3115
Deerfield, IL 60015
|
- sq. feet
|
- baths - beds |
show details | |

|
#18
Skylark Ln
Deerfield, IL 60015
|
- sq. feet
|
- baths - beds |
show details | |

|
#19
S Lyman Ave
Des Plaines, IL 60016
|
2,233 sq. feet
|
2 baths 4 beds |
$330,000
|
show details |

|
#20
Main St
Skokie, IL 60076
|
1,428 sq. feet
|
1 baths 3 beds |
$455,000
|
show details |
| Photo | Address | Area | Beds / Baths | Price | Details |
|---|---|---|---|---|---|

|
#21
N Sheridan Rd Apt 6e
Chicago, IL 60660
|
1,200 sq. feet
|
2 baths 2 beds |
$255,000
|
show details |

|
#22
N Francisco Ave
Chicago, IL 60659
|
1,100 sq. feet
|
1 baths 2 beds |
$159,000
|
show details |

|
#23
Briar Hill Dr
Schaumburg, IL 60194
|
1,600 sq. feet
|
2 baths 4 beds |
$410,400
|
show details |

|
#24
Wisconsin Ave
Barrington, IL 60010
|
1,297 sq. feet
|
2 baths 3 beds |
$489,900
|
show details |

|
#25
Christiana Ave # 1
Skokie, IL 60076
|
1,400 sq. feet
|
1 baths 3 beds |
$319,000
|
show details |

|
#26
Carriage Way Dr
Arlington Heights, IL 60004
|
- sq. feet
|
2 baths 2 beds |
$179,900
|
show details |

|
#27
N Austin Ave
Chicago, IL 60634
|
2,500 sq. feet
|
3 baths 4 beds |
$365,000
|
show details |

|
#28
N Olcott Ave
Chicago, IL 60634
|
2,161 sq. feet
|
2 baths 4 beds |
$559,000
|
show details |

|
#29
Webster Ln
Des Plaines, IL 60018
|
1,608 sq. feet
|
3 baths 3 beds |
$515,000
|
show details |

|
#30
E Crest Ave
Addison, IL 60101
|
2,023 sq. feet
|
1 baths 5 beds |
$329,000
|
show details |
| Photo | Address | Area | Beds / Baths | Price | Details |
|---|---|---|---|---|---|

|
#31
Clover Ct
Round Lake, IL 60073
|
1,682 sq. feet
|
1 baths 3 beds |
$273,000
|
show details |

|
#32
N 4th Ave
Des Plaines, IL 60016
|
1,381 sq. feet
|
1 baths 3 beds |
$335,000
|
show details |

|
#33
Woods Dr Unit Unit 2004
Skokie, IL 60077
|
- sq. feet
|
2 baths 3 beds |
$572,000
|
show details |

|
#34
Avenida Serra Test
Des Plaines, IL 60018
|
- sq. feet
|
2 baths 3 beds |
$100,000
|
show details |

|
#35
Scarsdale Ct Unit C2
Schaumburg, IL 60193
|
950 sq. feet
|
1 baths 2 beds |
show details | |

|
#36
N Greentree Rd
Grayslake, IL 60030
|
2,008 sq. feet
|
2 baths 4 beds |
show details | |

|
#37
W Tahoe Dr
Mundelein, IL 60060
|
2,849 sq. feet
|
3 baths 5 beds |
show details | |

|
#38
N Troy St Apt 410
Chicago, IL 60659
|
850 sq. feet
|
1 baths 1 beds |
show details | |

|
#39
N Lancaster St
Mount Prospect, IL 60056
|
1,521 sq. feet
|
1 baths 4 beds |
show details | |

|
#40
Church Rd
Bensenville, IL 60106
|
- sq. feet
|
2 baths 2 beds |
show details |
| Photo | Address | Area | Beds / Baths | Price | Details |
|---|---|---|---|---|---|

|
#41
Crossland Dr
Grayslake, IL 60030
|
1,562 sq. feet
|
1 baths 3 beds |
show details | |

|
#42
Morgan Ln
Hoffman Estates, IL 60169
|
1,252 sq. feet
|
1 baths 3 beds |
show details | |

|
#43
Thistle Ln
Glencoe, IL 60022
|
- sq. feet
|
- baths - beds |
$650,000
|
show details |

|
#44
W Sunset Dr
Elmwood Park, IL 60707
|
1,398 sq. feet
|
1 baths 4 beds |
show details | |

|
#45
E Lake Ave
Glenview, IL 60025
|
2,300 sq. feet
|
5 baths 4 beds |
show details | |

|
#46
Woodside Dr
Wood Dale, IL 60191
|
3,504 sq. feet
|
4 baths 5 beds |
show details | |

|
#47
Rockwell Ln
Des Plaines, IL 60016
|
- sq. feet
|
2 baths 3 beds |
show details | |

|
#48
S Hart St
Palatine, IL 60067
|
1,183 sq. feet
|
1 baths 3 beds |
show details | |

|
#49
Coral Ln
Glenview, IL 60026
|
1,548 sq. feet
|
2 baths - beds |
show details | |

|
Check over 1 million property listings on Foreclosure.com!
|
browse all offers | |||

Latest news about housing in Deerfield, IL collected exclusively by city-data.com from local newspapers, TV, and radio stations


Median year apartment built: 1998
Household type by relationship:
Households: 19,065- Male householders: 3,832 (568 living alone), Female householders: 3,484 (988 living alone)
4,976 spouses (4,957 opposite-sex spouses), 252 unmarried partners, (252 opposite-sex unmarried partners), 6,102 children (5,864 natural, 98 adopted, 139 stepchildren), 60 grandchildren, 27 brothers or sisters, 84 parents, 21 foster children, 12 other relatives, 134 non-relatives
- In group quarters: 74
Size of family households: 2,646 2-persons, 1,201 3-persons, 1,322 4-persons, 381 5-persons, 86 6-persons, 10 7-or-more-persons.
Size of nonfamily households: 1,644 1-person, 238 2-persons, 17 6-persons.
3,993 married couples with children.
435 single-parent households (106 men, 329 women).
86.9% of residents of Deerfield speak English at home.
2.8% of residents speak Spanish at home (82% speak English very well, 14% speak English well, 3% speak English not well, 1% don't speak English at all).
6.2% of residents speak other Indo-European language at home (78% speak English very well, 14% speak English well, 5% speak English not well, 3% don't speak English at all).
2.9% of residents speak Asian or Pacific Island language at home (64% speak English very well, 9% speak English well, 26% speak English not well).
0.4% of residents speak other language at home (88% speak English very well, 12% speak English well).
Foreign born population: 1,844 (9.7%)
(68.3% of them are naturalized citizens)
| Here: | 8.0 |
| State: | 6.4 |
| Here: | 3.8 |
| State: | 4.1 |

- Bedrooms in owner-occupied houses and condos in Deerfield, Illinois
- 10no bedroom
- 581 bedroom
- 6702 bedrooms
- 1,6373 bedrooms
- 2,7784 bedrooms
- 9365+ bedrooms

- Bedrooms in renter-occupied apartments in Deerfield, Illinois
- 16no bedroom
- 4061 bedroom
- 5992 bedrooms
- 3303 bedrooms
- 524 bedrooms
- 415+ bedrooms

- Cars and other vehicles available in Deerfield in owner-occupied houses/condos
- 217no vehicle
- 1,3061 vehicle
- 3,3522 vehicles
- 9223 vehicles
- 1994 vehicles
- 925+ vehicles

- Cars and other vehicles available in Deerfield in renter-occupied apartments
- 214no vehicle
- 6171 vehicle
- 5182 vehicles
- 783 vehicles
- 04 vehicles
- 175+ vehicles

- Rooms in owner-occupied houses in Deerfield, Illinois
- 101 room
- 312 rooms
- 1163 rooms
- 2664 rooms
- 4305 rooms
- 6566 rooms
- 8957 rooms
- 1,2178 rooms
- 2,4679+ rooms

- Rooms in renter-occupied apartments in Deerfield, Illinois
- 161 room
- 2782 rooms
- 3153 rooms
- 3774 rooms
- 1115 rooms
- 676 rooms
- 387 rooms
- 538 rooms
- 1899+ rooms


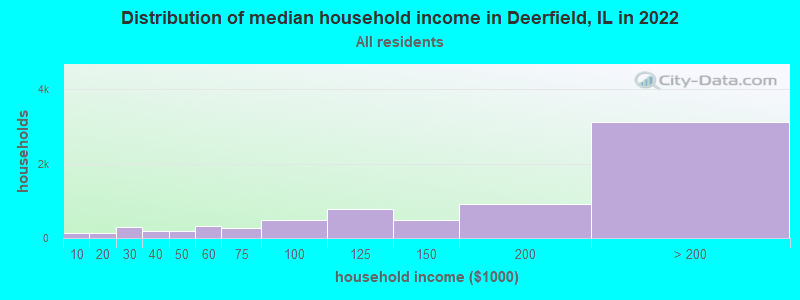
Deerfield, IL household income distribution

- 142Less than $10,000
- 130$10,000 to $19,999
- 302$20,000 to $29,999
- 194$30,000 to $39,999
- 179$40,000 to $49,999
- 310$50,000 to $59,999
- 259$60,000 to $74,999
- 491$75,000 to $99,999
- 794$100,000 to $124,999
- 495$125,000 to $149,999
- 926$150,000 to $199,999
- 3,123$200,000 or more
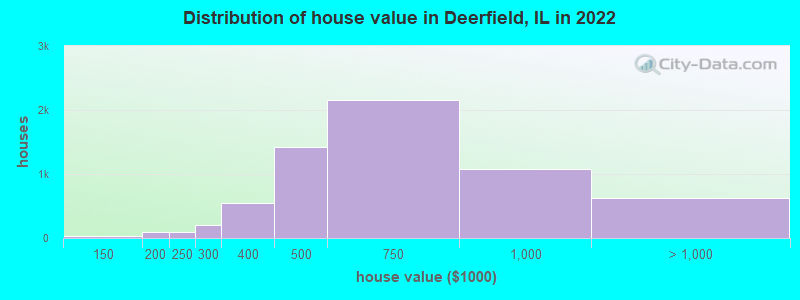
Home value of owner - occupied houses in 2022 in Deerfield, IL
-
- 14Less than $10,000
- 12$50,000 to $59,999
- 29$125,000 to $149,999
- 54$150,000 to $174,999
- 31$175,000 to $199,999
- 91$200,000 to $249,999
- 199$250,000 to $299,999
- 539$300,000 to $399,999
- 1,428$400,000 to $499,999
- 2,159$500,000 to $749,999
- 1,071$750,000 to $999,999
- 506$1,000,000 to $1,499,999
- 77$1,500,000 to $1,999,999
- 34$2,000,000 or more
Rent paid by renters in 2022 in Deerfield, IL
-
- 11$100 to $149
- 5$150 to $199
- 9$250 to $299
- 20$450 to $499
- 23$500 to $549
- 13$700 to $749
- 18$750 to $799
- 11$800 to $899
- 41$900 to $999
- 26$1,000 to $1,249
- 89$1,250 to $1,499
- 420$1,500 to $1,999
- 236$2,000 to $2,499
- 184$2,500 to $2,999
- 60$3,000 to $3,499
- 133$3,500 or more
- 93No cash rent


Percentage of workers working in this county: 59.5%
Number of people working at home: 2,718 (26.5% of all workers)
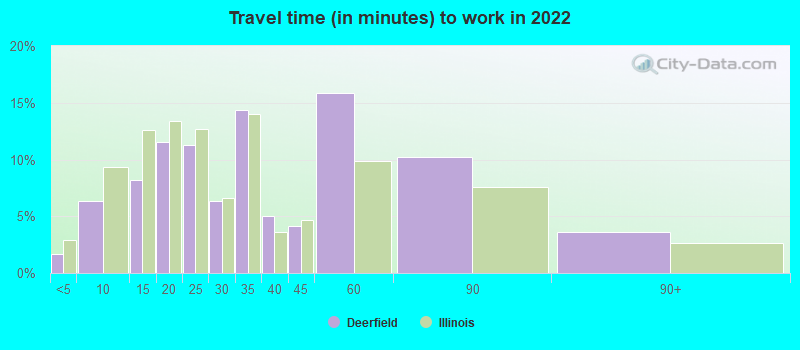
Travel time to work (commute)
- Less than 5 minutes: 175
- 5 to 9 minutes: 767
- 10 to 14 minutes: 1,024
- 15 to 19 minutes: 1,197
- 20 to 24 minutes: 1,088
- 25 to 29 minutes: 577
- 30 to 34 minutes: 896
- 35 to 39 minutes: 189
- 40 to 44 minutes: 441
- 45 to 59 minutes: 621
- 60 to 89 minutes: 652
- 90 or more minutes: 107
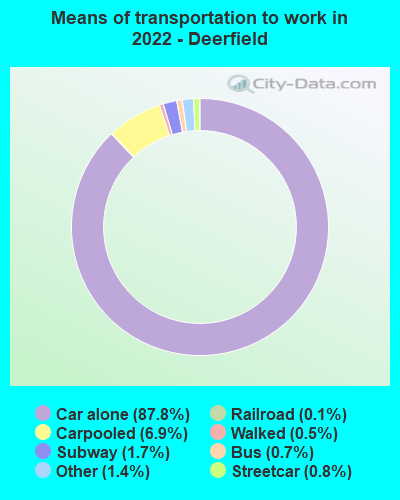
Means of transportation to work:
- Drove a car alone: 15,565 (74.9%)
- Carpooled: 1,240 (6.0%)
- Bus: 138 (0.7%)
- Subway or elevated rail: 217 (1.0%)
- Long-distance train or commuter rail: 273 (1.3%)
- Light rail, streetcar or trolley: 21 (0.1%)
- Taxi: 264 (1.3%)
- Bicycle: 15 (0.1%)
- Walked: 94 (0.5%)
- Worked at home: 2,718 (13.1%)

- Unemployment by race in 2022
- Unemployment rate for White non-Hispanic residents
- 1.7%Males
- 0.6%Females
- Unemployment rate for Black residents
- 16.7%Males
- Unemployment rate for Asian residents
- 8.8%Males
- 18.1%Females
- Unemployment rate for Hispanic or Latino residents
- 7.7%Females

- Year of entry for the foreign-born population in Deerfield, Illinois
- 4252010 or later
- 3012000 to 2009
- 4631990 to 1999
- 3281980 to 1989
- 1991970 to 1979
- 568Before 1970
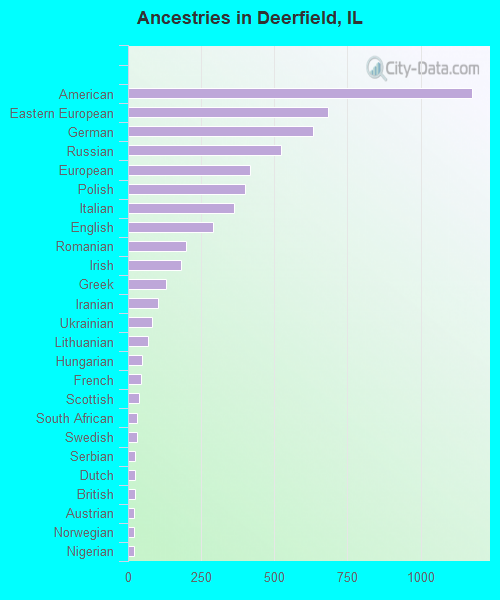
First ancestries reported:
- American: 1,175 (14.7%)
- Eastern European: 684 (8.5%)
- German: 631 (7.9%)
- Russian: 522 (6.5%)
- European: 418 (5.2%)
- Polish: 400 (5.0%)
- Italian: 362 (4.5%)
- English: 289 (3.6%)
- Romanian: 199 (2.5%)
- Irish: 181 (2.3%)
- Greek: 131 (1.6%)
- Iranian: 101 (1.3%)
- Ukrainian: 83 (1.0%)
- Lithuanian: 69 (0.9%)
- Hungarian: 49 (0.6%)
- French: 43 (0.5%)
- Scottish: 37 (0.5%)
- South African: 32 (0.4%)
- Swedish: 30 (0.4%)
- Serbian: 25 (0.3%)
- Dutch: 24 (0.3%)
- British: 24 (0.3%)
- Austrian: 22 (0.3%)
- Norwegian: 20 (0.2%)
- Nigerian: 19 (0.2%)
- Scandinavian: 17 (0.2%)
- Assyrian: 15 (0.2%)
- Turkish: 13 (0.2%)
- Jamaican: 12 (0.1%)
- Finnish: 12 (0.1%)
- Bulgarian: 11 (0.1%)
- Canadian: 9 (0.1%)
- Croatian: 8 (0.10%)
- Lebanese: 8 (0.10%)
- Swiss: 8 (0.10%)
- Northern European: 7 (0.09%)
- Armenian: 7 (0.09%)
- Arab: 7 (0.09%)
- Israeli: 7 (0.09%)
- Scotch-Irish: 7 (0.09%)
- French Canadian: 6 (0.07%)
- Slovak: 6 (0.07%)
Most common places of birth for foreign-born residents (%):
| Deerfield: | 13.4% (237) |
| Illinois: | 9.2% (166,409) |
| Deerfield: | 7.6% (135) |
| Illinois: | 0.2% (2,988) |
| Deerfield: | 6.2% (109) |
| Illinois: | 34.7% (626,958) |
| Deerfield: | 6.0% (106) |
| Illinois: | 4.1% (74,364) |
| Deerfield: | 5.7% (101) |
| Illinois: | 0.3% (4,938) |
| Deerfield: | 5.7% (100) |
| Illinois: | 5.2% (93,003) |
| Deerfield: | 5.5% (98) |
| Illinois: | 2.2% (40,393) |
| Deerfield: | 4.8% (85) |
| Illinois: | 0.9% (15,679) |
| Deerfield: | 4.2% (74) |
| Illinois: | 0.6% (10,720) |
| Deerfield: | 3.5% (62) |
| Illinois: | 1.1% (19,306) |
| Deerfield: | 2.9% (51) |
| Illinois: | 0.4% (6,922) |
| Deerfield: | 2.7% (48) |
| Illinois: | 0.5% (9,671) |
| Deerfield: | 2.7% (48) |
| Illinois: | 6.9% (124,474) |
| Deerfield: | 2.6% (46) |
| Illinois: | 1.6% (29,316) |
| Deerfield: | 2.6% (46) |
| Illinois: | 0.1% (1,568) |
| Deerfield: | 2.2% (38) |
| Illinois: | 0.8% (14,736) |
| Deerfield: | 2.1% (37) |
| Illinois: | 0.3% (6,186) |
| Deerfield: | 2.1% (37) |
| Illinois: | 1.0% (18,753) |
| Deerfield: | 2.0% (35) |
| Illinois: | 0.9% (16,308) |
| Deerfield: | 1.6% (29) |
| Illinois: | 0.5% (9,834) |
Place of birth for U.S.-born residents:
- This state: 12,536
- Other state: 4,319
- Northeast: 1,188
- Midwest: 1,662
- South: 665
- West: 763
88.0% of Deerfield residents lived in the same house 1 years ago.
Out of people who lived in different houses, 17.5% lived in this county.
Out of people who lived in different counties, 56.1% lived in Illinois.
| Deerfield: | 88.0% |
| State average: | 88.3% |
Education attainment for males 25 years and older:
- No schooling: 0
- Nursery to 4th grade: 0
- 5th and 6th grade: 26
- 7th and 8th grade: 0
- 9th grade: 37
- 10th grade: 0
- 11th grade: 9
- 12th grade, no diploma: 44
- High school graduate (or equivalency): 245
- Less than 1 year of college: 136
- Some college more than 1 year, no degree: 416
- Associate degree: 103
- Bachelor's degree: 2,657
- Master's degree: 1,585
- Professional school degree: 807
- Doctorate degree: 339

Education attainment for females 25 years and older:
- No schooling: 0
- Nursery to 4th grade: 0
- 5th and 6th grade: 15
- 7th and 8th grade: 0
- 9th grade: 7
- 10th grade: 0
- 11th grade: 17
- 12th grade, no diploma: 32
- High school graduate (or equivalency): 258
- Less than 1 year of college: 269
- Some college more than 1 year, no degree: 414
- Associate degree: 219
- Bachelor's degree: 2,772
- Master's degree: 2,132
- Professional school degree: 582
- Doctorate degree: 310


Housing units in structures:
- One, detached: 5,765
- One, attached: 271
- Two: 38
- 3 or 4: 179
- 5 to 9: 30
- 10 to 19: 204
- 20 to 49: 252
- 50 or more: 810
- Mobile homes: 16
Housing units lacking complete kitchen facilities in 2022: 1.1%
House/condo owner moved in on average 14 years ago
Renter moved in on average 3 years ago

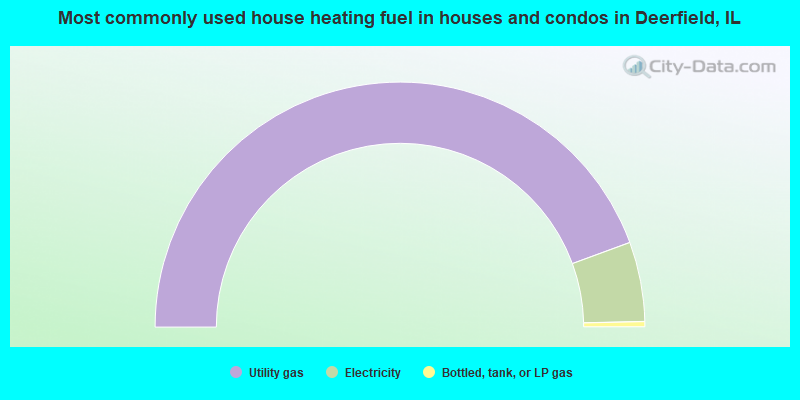
- 88.9%Utility gas
- 10.5%Electricity
- 0.7%Bottled, tank, or LP gas
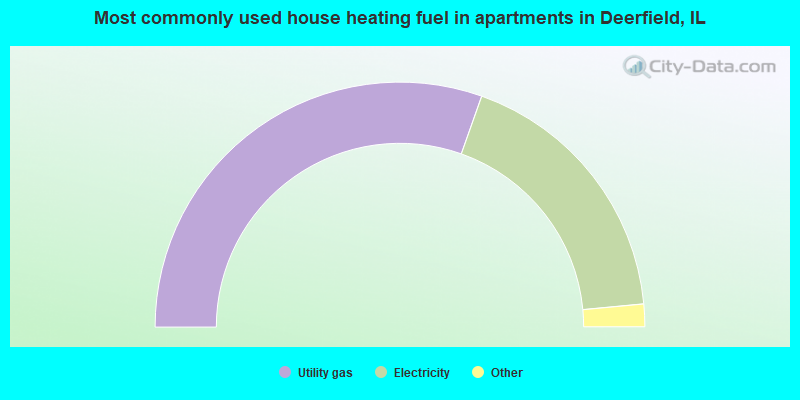
- 60.9%Utility gas
- 36.2%Electricity
- 2.1%Bottled, tank, or LP gas
- 0.8%No fuel used
Private vs. public school enrollment:
| Here: | 10.5% |
| Illinois: | 13.3% |
| Here: | 3.6% |
| Illinois: | 9.9% |
| Here: | 30.2% |
| Illinois: | 27.4% |


