Housing density: 2,709 houses/condos per square mile
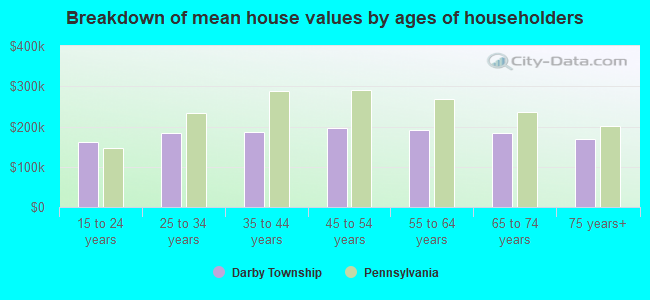
Median price asked for vacant for-sale houses and condos in 2022 in this county: $246,679.
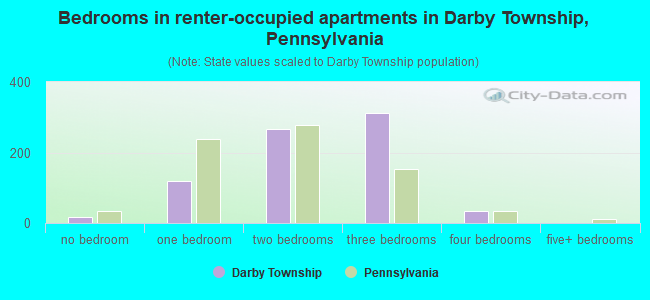
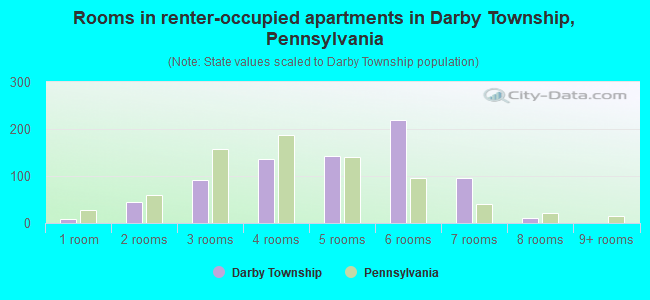
Median contract rent in 2022: $1,040 (lower quartile is $547, upper quartile is $1,306)
Median rent asked for vacant for-rent units in 2022: $809
Median gross rent in Darby Township, PA in 2022: $1,259
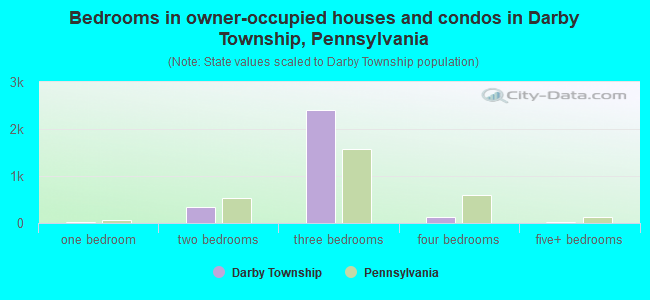
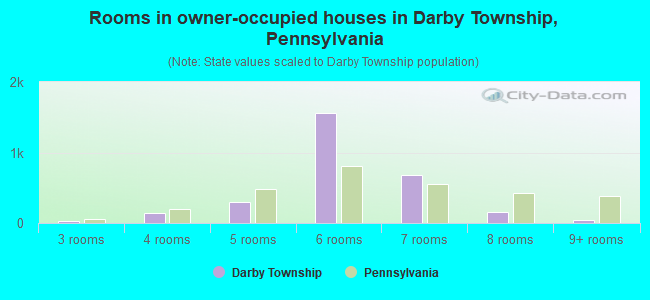
Housing units in Darby Township with a mortgage: 1,739 (172 second mortgage, 198 home equity loan, 5 both second mortgage and home equity loan) Houses without a mortgage: 1,114
Compare current foreclosures near Darby Township, PA:
In family households: 453,586 (91,569 male householders, 48,290 female householders)
99,383 spouses, 170,789 children (161,642 natural, 3,823 adopted, 5,324 stepchildren), 11,365 grandchildren, 5,918 brothers or sisters, 5,812 parents, foster children, 6,644 other relatives, 10,420 non-relatives
In nonfamily households: 82,338 (29,827 male householders (23,777 living alone)), 39,014 female householders (33,920 living alone)), 13,497 nonrelatives
In group quarters: 23,055 (7,828 institutionalized population)
94,926 married couples with children.
28,980 single-parent households (5,380 men, 23,600 women).
96.6% of residents of Darby Township speak English at home.
1.1% of residents speak Spanish at home (55% speak English very well, 25% speak English well, 7% speak English not well, 13% don't speak English at all).
2.1% of residents speak other Indo-European language at home (84% speak English very well, 5% speak English well, 3% speak English not well, 7% don't speak English at all).
0.2% of residents speak other language at home (100% speak English very well).
Foreign born population: 316 (3.1%)
(64.9% of them are naturalized citizens)
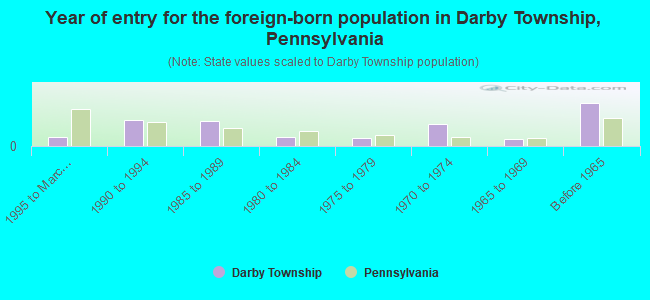
Year of entry for the foreign-born population in Darby Township, Pennsylvania
121995 to March 2000
351990 to 1994
341985 to 1989
121980 to 1984
111975 to 1979
301970 to 1974
101965 to 1969
57Before 1965
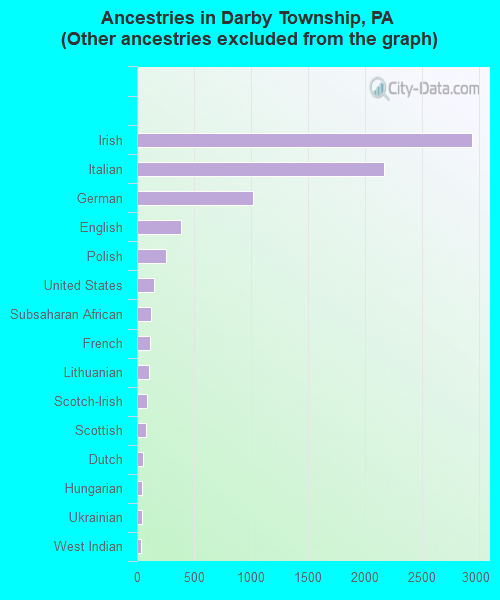
First ancestries reported:
Other: 3,129 (28.9%)
Irish: 2,941 (27.1%)
Italian: 2,166 (20.0%)
German: 1,014 (9.4%)
English: 390 (3.6%)
Polish: 257 (2.4%)
United States: 151 (1.4%)
Subsaharan African: 119 (1.1%)
French: 113 (1.0%)
Lithuanian: 105 (1.0%)
Scotch-Irish: 85 (0.8%)
Scottish: 82 (0.8%)
Dutch: 52 (0.5%)
Hungarian: 45 (0.4%)
Ukrainian: 42 (0.4%)
West Indian: 36 (0.3%)
Danish: 19 (0.2%)
Greek: 19 (0.2%)
Swedish: 18 (0.2%)
Welsh: 14 (0.1%)
Russian: 12 (0.1%)
French Canadian: 11 (0.1%)
Norwegian: 10 (0.09%)
Swiss: 5 (0.05%)
Portuguese: 3 (0.03%)
Most common places of birth for foreign-born residents (%):
United Kingdom
Darby Township:
16.4% (33)
Pennsylvania:
4.6% (23,171)
Other Western Africa
Darby Township:
12.4% (25)
Pennsylvania:
0.9% (4,385)
Other Eastern Africa
Darby Township:
10.0% (20)
Pennsylvania:
0.8% (3,975)
Dominican Republic
Darby Township:
9.5% (19)
Pennsylvania:
2.3% (11,687)
Jamaica
Darby Township:
7.5% (15)
Pennsylvania:
2.4% (12,390)
Ireland
Darby Township:
6.5% (13)
Pennsylvania:
1.3% (6,687)
Trinidad and Tobago
Darby Township:
5.5% (11)
Pennsylvania:
0.9% (4,480)
Germany
Darby Township:
5.0% (10)
Pennsylvania:
5.1% (25,685)
Italy
Darby Township:
5.0% (10)
Pennsylvania:
6.0% (30,559)
India
Darby Township:
5.0% (10)
Pennsylvania:
7.4% (37,541)
Mexico
Darby Township:
4.5% (9)
Pennsylvania:
4.8% (24,232)
Ukraine
Darby Township:
3.0% (6)
Pennsylvania:
3.3% (16,897)
Cuba
Darby Township:
3.0% (6)
Pennsylvania:
0.8% (3,914)
Sierra Leone
Darby Township:
2.5% (5)
Pennsylvania:
0.2% (877)
Colombia
Darby Township:
2.5% (5)
Pennsylvania:
1.3% (6,531)
France
Darby Township:
2.0% (4)
Pennsylvania:
0.8% (4,181)
Place of birth for U.S.-born residents:
This state: 8,254
Other state: 1,148
Northeast: 396
Midwest: 66
South: 651
West: 35
76% of Darby Township residents lived in the same house 5 years ago. Out of people who lived in different houses, 68% lived in this county. Out of people who lived in different counties, 63% lived in Pennsylvania.
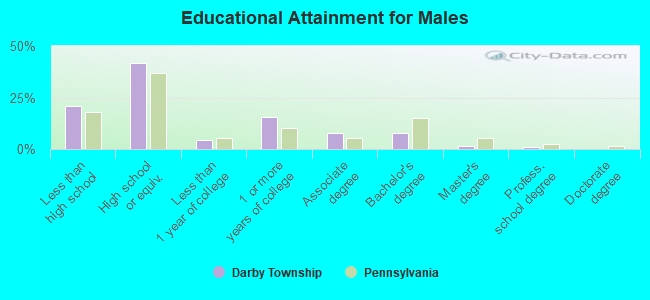
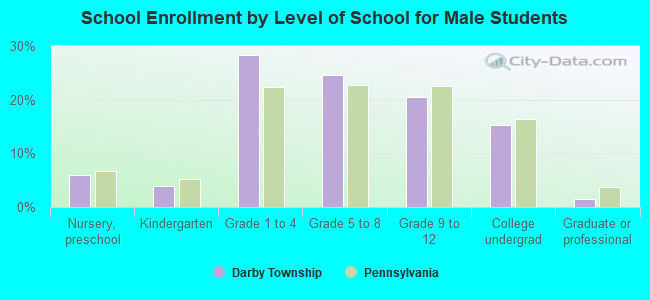
Education attainment for males 25 years and older:
No schooling: 12
Nursery to 4th grade: 11
5th and 6th grade: 8
7th and 8th grade: 23
9th grade: 82
10th grade: 89
11th grade: 139
12th grade, no diploma: 223
High school graduate (or equivalency): 1,181
Less than 1 year of college: 122
Some college more than 1 year, no degree: 434
Associate degree: 219
Bachelor's degree: 220
Master's degree: 40
Professional school degree: 22
Doctorate degree: 0
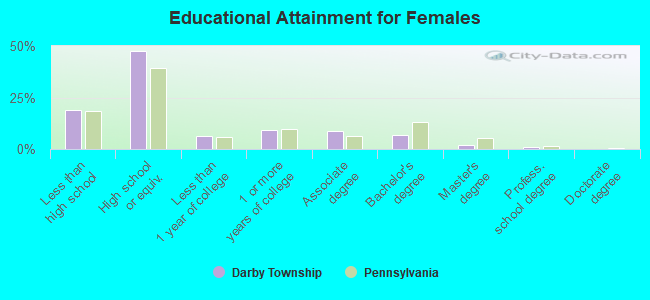
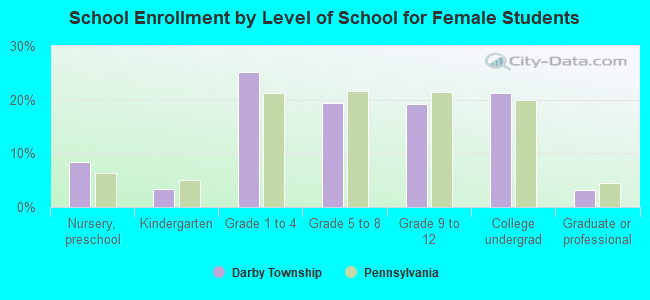
Education attainment for females 25 years and older:
No schooling: 15
Nursery to 4th grade: 0
5th and 6th grade: 37
7th and 8th grade: 96
9th grade: 59
10th grade: 145
11th grade: 167
12th grade, no diploma: 165
High school graduate (or equivalency): 1,701
Less than 1 year of college: 223
Some college more than 1 year, no degree: 332
Associate degree: 307
Bachelor's degree: 236
Master's degree: 70
Professional school degree: 30
Doctorate degree: 0
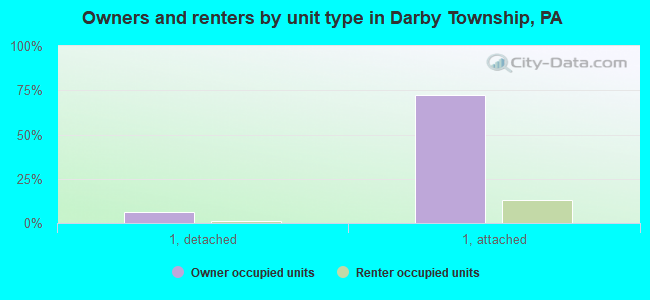
Housing units in structures:
One, detached: 295
One, attached: 3,237
Two: 110
3 or 4: 129
5 to 9: 53
10 to 19: 27
20 to 49: 8
50 or more: 9
Housing units lacking complete plumbing facilities: 0.5%
Housing units lacking complete kitchen facilities: 0.7%