Darby, PA (Pennsylvania) Houses and Residents
| Darby: | $105,436 |
| Pennsylvania: | $245,500 |
Mean price in 2022:
Detached houses: $241,425
Here: $241,425 State: $317,202 Townhouses or other attached units: $169,496
Here: $169,496 State: $254,369 In 2-unit structures: $183,888
Here: $183,888 State: $249,182
Total population: 10,695 (Urban population: 10,299, Rural population: 0)
Houses: 4,090 (3,575 occupied: 1,790 owner occupied, 1,785 renter occupied)
| % of renters here: | 50% |
| State: | 31% |
Housing density: 5,014 houses/condos per square mile
Median price asked for vacant for-sale houses and condos in 2022: $306,643.
Median contract rent in 2022: $957 (lower quartile is $765, upper quartile is $1,161)
Median rent asked for vacant for-rent units in 2022: $800
Median gross rent in Darby, PA in 2022: $1,191
Housing units in Darby with a mortgage: 1,161 (134 second mortgage, 0 home equity loan, 114 both second mortgage and home equity loan)
Houses without a mortgage: 70
Median household income for houses/condos with a mortgage: $60,897
Median household income for apartments without a mortgage: $58,220
Median monthly housing costs: $1,130
Compare current foreclosures near Darby, PA:
| Photo | Address | Area | Beds / Baths | Price | Details |
|---|---|---|---|---|---|

|
#1
Andrews Ave
Darby, PA 19023
|
932 sq. feet
|
1 baths 2 beds |
show details | |

|
#2
Jackson Ave
Darby, PA 19023
|
1,476 sq. feet
|
1 baths 3 beds |
show details | |

|
#3
Ellis Ave
Darby, PA 19023
|
1,271 sq. feet
|
1 baths 3 beds |
show details | |

|
#4
Pusey Ave
Darby, PA 19023
|
1,419 sq. feet
|
1 baths 3 beds |
show details | |

|
#5
Mill Street
Darby, PA 19023
|
34,000 sq. feet
|
1 baths 1 beds |
show details | |

|
#6
N 9th St
Darby, PA 19023
|
1,340 sq. feet
|
2 baths 3 beds |
show details | |

|
#7
S 4th St
Darby, PA 19023
|
- sq. feet
|
2 baths 2 beds |
show details | |

|
#8
Meadowbrook Ln
Darby, PA 19023
|
- sq. feet
|
1 baths 3 beds |
show details | |

|
#9
Main St
Darby, PA 19023
|
- sq. feet
|
2 baths 4 beds |
show details | |

|
#10
S 3rd St
Darby, PA 19023
|
- sq. feet
|
1 baths 3 beds |
show details |
| Photo | Address | Area | Beds / Baths | Price | Details |
|---|---|---|---|---|---|

|
#11
Ellis Ave
Darby, PA 19023
|
- sq. feet
|
1 baths 3 beds |
show details | |

|
#12
Staley Ave
Darby, PA 19023
|
- sq. feet
|
1 baths 3 beds |
show details | |

|
#13
North St
Darby, PA 19023
|
- sq. feet
|
2 baths 3 beds |
show details | |

|
#14
Concord Rd
Darby, PA 19023
|
- sq. feet
|
1 baths 3 beds |
show details | |

|
#15
Cherry St
Darby, PA 19023
|
- sq. feet
|
1 baths 3 beds |
show details | |

|
#16
Spring Valley Rd
Darby, PA 19023
|
- sq. feet
|
1 baths 3 beds |
show details | |

|
#17
Tyler Ave
Darby, PA 19023
|
- sq. feet
|
1 baths 4 beds |
show details | |

|
#18
Chestnut St
Darby, PA 19023
|
- sq. feet
|
1 baths 3 beds |
show details | |

|
#19
N 4th St
Darby, PA 19023
|
- sq. feet
|
1 baths 3 beds |
show details | |

|
#20
Andrews Ave
Darby, PA 19023
|
- sq. feet
|
1 baths 2 beds |
show details |
| Photo | Address | Area | Beds / Baths | Price | Details |
|---|---|---|---|---|---|

|
#21
Hibberd Ave
Darby, PA 19023
|
- sq. feet
|
1 baths 4 beds |
show details | |

|
#22
Macdade Blvd Apt 4
Darby, PA 19023
|
- sq. feet
|
- baths - beds |
show details | |

|
#23
Main St
Darby, PA 19023
|
- sq. feet
|
- baths - beds |
show details | |

|
#24
Rively Ave
Darby, PA 19023
|
- sq. feet
|
- baths - beds |
show details | |

|
#25
Main St
Darby, PA 19023
|
- sq. feet
|
- baths - beds |
show details | |

|
#26
Cooper St
Woodbury, NJ 08096
|
936 sq. feet
|
1 baths 3 beds |
$255,000
|
show details |

|
#27
Broadway
Westville, NJ 08093
|
1,548 sq. feet
|
1 baths 3 beds |
$259,900
|
show details |

|
#28
Covered Bridge Rd
Cherry Hill, NJ 08034
|
1,343 sq. feet
|
1 baths 3 beds |
$450,000
|
show details |

|
#29
N 59th St
Philadelphia, PA 19151
|
1,244 sq. feet
|
1 baths 3 beds |
$241,500
|
show details |

|
#30
Christian St
Philadelphia, PA 19146
|
1,612 sq. feet
|
2 baths 5 beds |
$449,900
|
show details |
| Photo | Address | Area | Beds / Baths | Price | Details |
|---|---|---|---|---|---|

|
#31
Edwards Ave
Barrington, NJ 08007
|
1,112 sq. feet
|
1 baths 3 beds |
$325,500
|
show details |

|
#32
S 8th St
Philadelphia, PA 19148
|
1,170 sq. feet
|
1 baths 3 beds |
$178,500
|
show details |

|
#33
N Forklanding Rd
Maple Shade, NJ 08052
|
1,450 sq. feet
|
1 baths 3 beds |
$259,900
|
show details |

|
#34
W Olney Ave
Philadelphia, PA 19120
|
1,782 sq. feet
|
2 baths 4 beds |
$112,500
|
show details |

|
#35
Kershaw St
Philadelphia, PA 19131
|
1,284 sq. feet
|
1 baths 3 beds |
$139,900
|
show details |

|
#36
Mockingbird Ln
Swedesboro, NJ 08085
|
2,076 sq. feet
|
2 baths 4 beds |
$429,900
|
show details |

|
#37
W Oakdale Street
Philadelphia, PA 19132
|
1,152 sq. feet
|
2 baths 3 beds |
$108,900
|
show details |

|
#38
Watson Blvd
Clementon, NJ 08021
|
1,268 sq. feet
|
1 baths 3 beds |
$289,900
|
show details |

|
#39
Browning Rd
Merchantville, NJ 08109
|
2,376 sq. feet
|
3 baths 5 beds |
$489,900
|
show details |

|
#40
Jessamine Ave
Oaklyn, NJ 08107
|
864 sq. feet
|
2 baths 5 beds |
$399,900
|
show details |
| Photo | Address | Area | Beds / Baths | Price | Details |
|---|---|---|---|---|---|

|
#41
N 5th St
Philadelphia, PA 19126
|
1,420 sq. feet
|
2 baths 3 beds |
$313,900
|
show details |

|
#42
Manchester Rd
Elkins Park, PA 19027
|
3,444 sq. feet
|
2 baths 3 beds |
$559,900
|
show details |

|
#43
N Front St Apt B
Philadelphia, PA 19123
|
2,491 sq. feet
|
2 baths 3 beds |
$659,500
|
show details |

|
#44
Harvey Ave
Pennsauken, NJ 08110
|
1,555 sq. feet
|
2 baths 4 beds |
$415,000
|
show details |

|
#45
N Parkview Dr
Norristown, PA 19403
|
2,602 sq. feet
|
2 baths 4 beds |
$240,000
|
show details |

|
#46
Ashbourne Rd
Elkins Park, PA 19027
|
3,104 sq. feet
|
3 baths 6 beds |
$154,500
|
show details |

|
#47
Yeadon Ave
Lansdowne, PA 19050
|
1,388 sq. feet
|
1 baths 3 beds |
$273,000
|
show details |

|
#48
Edgewood Ave
Audubon, NJ 08106
|
1,250 sq. feet
|
1 baths 4 beds |
$375,000
|
show details |

|
#49
Hamilton St
Swedesboro, NJ 08085
|
- sq. feet
|
1 baths 3 beds |
$260,000
|
show details |

|
Check over 1 million property listings on Foreclosure.com!
|
browse all offers | |||

Latest news about housing in Darby, PA collected exclusively by city-data.com from local newspapers, TV, and radio stations


Median year apartment built: 1957
Household type by relationship:
Households: 10,679- Male householders: 1,264 (659 living alone), Female householders: 2,297 (584 living alone)
605 spouses (605 opposite-sex spouses), 426 unmarried partners, (417 opposite-sex unmarried partners), 3,898 children (3,780 natural, 109 adopted, 7 stepchildren), 774 grandchildren, 271 brothers or sisters, 209 parents, 0 foster children, 392 other relatives, 97 non-relatives
- In group quarters: 438
Size of family households: 835 2-persons, 356 3-persons, 443 4-persons, 234 5-persons, 81 6-persons, 102 7-or-more-persons.
Size of nonfamily households: 1,306 1-person, 203 2-persons.
482 married couples with children.
2,040 single-parent households (28 men, 2,012 women).
88.2% of residents of Darby speak English at home.
2.5% of residents speak Spanish at home (82% speak English very well, 13% speak English well, 5% speak English not well).
2.7% of residents speak other Indo-European language at home (39% speak English very well, 41% speak English well, 15% speak English not well, 5% don't speak English at all).
0.2% of residents speak Asian or Pacific Island language at home (36% speak English very well, 23% speak English well, 41% speak English not well).
5.6% of residents speak other language at home (33% speak English very well, 46% speak English well, 16% speak English not well, 5% don't speak English at all).
Foreign born population: 1,795 (16.8%)
(56.3% of them are naturalized citizens)
| Here: | 6.2 |
| State: | 6.8 |
| Here: | 5.4 |
| State: | 4.3 |

- Bedrooms in owner-occupied houses and condos in Darby, Pennsylvania
- 11no bedroom
- 71 bedroom
- 2272 bedrooms
- 1,3013 bedrooms
- 2324 bedrooms
- 135+ bedrooms

- Bedrooms in renter-occupied apartments in Darby, Pennsylvania
- 111no bedroom
- 3331 bedroom
- 2882 bedrooms
- 9463 bedrooms
- 794 bedrooms
- 285+ bedrooms

- Cars and other vehicles available in Darby in owner-occupied houses/condos
- 110no vehicle
- 8741 vehicle
- 5502 vehicles
- 1223 vehicles
- 974 vehicles
- 365+ vehicles

- Cars and other vehicles available in Darby in renter-occupied apartments
- 953no vehicle
- 5711 vehicle
- 2202 vehicles
- 423 vehicles
- 04 vehicles
- 05+ vehicles

- Rooms in owner-occupied houses in Darby, Pennsylvania
- 111 room
- 02 rooms
- 03 rooms
- 2094 rooms
- 2855 rooms
- 5896 rooms
- 3867 rooms
- 1888 rooms
- 1239+ rooms

- Rooms in renter-occupied apartments in Darby, Pennsylvania
- 1111 room
- 302 rooms
- 2913 rooms
- 1314 rooms
- 2415 rooms
- 5076 rooms
- 4257 rooms
- 228 rooms
- 289+ rooms


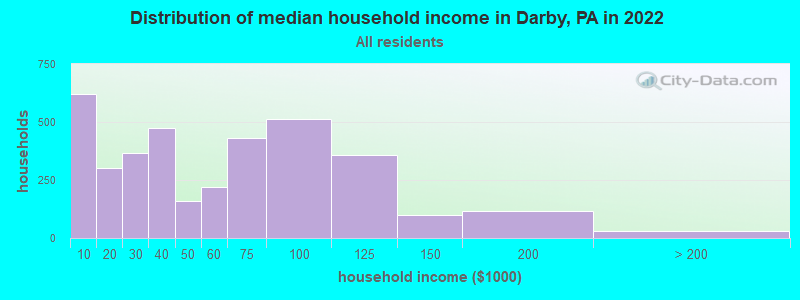
Darby, PA household income distribution

- 622Less than $10,000
- 300$10,000 to $19,999
- 366$20,000 to $29,999
- 473$30,000 to $39,999
- 159$40,000 to $49,999
- 220$50,000 to $59,999
- 433$60,000 to $74,999
- 512$75,000 to $99,999
- 358$100,000 to $124,999
- 99$125,000 to $149,999
- 116$150,000 to $199,999
- 32$200,000 or more
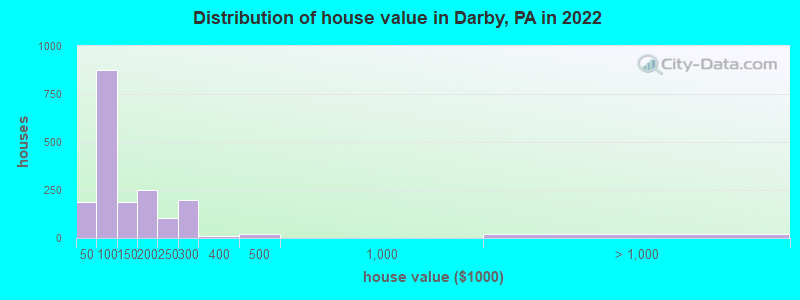
Home value of owner - occupied houses in 2022 in Darby, PA
-
- 15$10,000 to $14,999
- 24$15,000 to $19,999
- 10$20,000 to $24,999
- 134$40,000 to $49,999
- 129$50,000 to $59,999
- 33$60,000 to $69,999
- 163$70,000 to $79,999
- 336$80,000 to $89,999
- 77$90,000 to $99,999
- 163$100,000 to $124,999
- 23$125,000 to $149,999
- 202$150,000 to $174,999
- 44$175,000 to $199,999
- 102$200,000 to $249,999
- 200$250,000 to $299,999
- 8$300,000 to $399,999
- 21$400,000 to $499,999
- 18$2,000,000 or more
Rent paid by renters in 2022 in Darby, PA
-
- 9Less than $100
- 8$100 to $149
- 33$400 to $449
- 50$450 to $499
- 75$500 to $549
- 110$600 to $649
- 23$650 to $699
- 101$700 to $749
- 113$750 to $799
- 214$800 to $899
- 239$900 to $999
- 559$1,000 to $1,249
- 145$1,250 to $1,499
- 15$1,500 to $1,999
- 19No cash rent


Percentage of workers working in this county: 45.9%
Number of people working at home: 542 (14.2% of all workers)
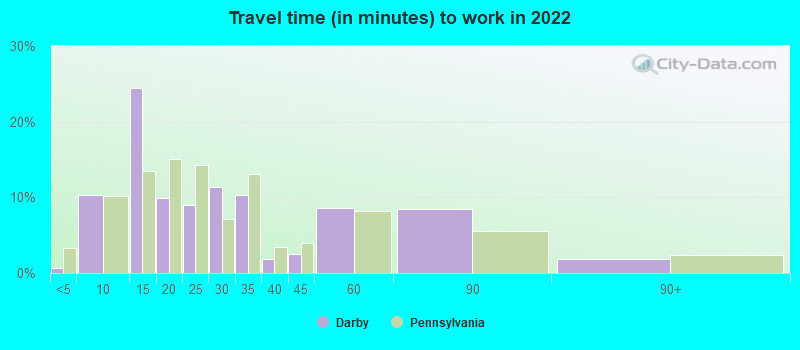
Travel time to work (commute)
- Less than 5 minutes: 134
- 5 to 9 minutes: 103
- 10 to 14 minutes: 215
- 15 to 19 minutes: 354
- 20 to 24 minutes: 296
- 25 to 29 minutes: 94
- 30 to 34 minutes: 725
- 35 to 39 minutes: 84
- 40 to 44 minutes: 146
- 45 to 59 minutes: 361
- 60 to 89 minutes: 562
- 90 or more minutes: 137
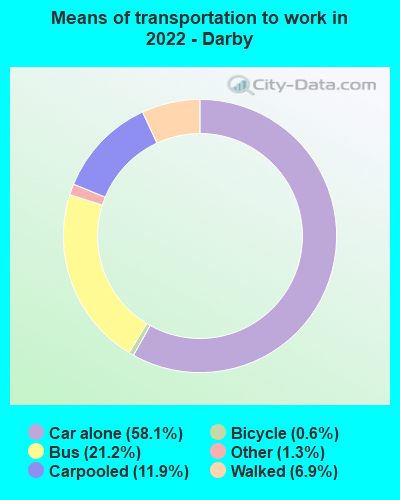
Means of transportation to work:
- Drove a car alone: 1,826 (49.0%)
- Carpooled: 349 (9.4%)
- Bus: 401 (10.8%)
- Taxi: 69 (1.9%)
- Bicycle: 19 (0.5%)
- Walked: 257 (6.9%)
- Worked at home: 542 (14.6%)

- Unemployment by race in 2022
- Unemployment rate for White non-Hispanic residents
- 10.8%Males
- Unemployment rate for Black residents
- 11.7%Males
- 10.5%Females
- Unemployment rate for two or more race residents
- 54.3%Females

- Year of entry for the foreign-born population in Darby, Pennsylvania
- 1,0762010 or later
- 4372000 to 2009
- 1361990 to 1999
- 2381980 to 1989
- 591970 to 1979
- 136Before 1970

First ancestries reported:
- Liberian: 965 (12.9%)
- African: 668 (8.9%)
- Jamaican: 174 (2.3%)
- Irish: 137 (1.8%)
- Nigerian: 126 (1.7%)
- Ethiopian: 115 (1.5%)
- Haitian: 96 (1.3%)
- American: 87 (1.2%)
- English: 85 (1.1%)
- Sierra Leonean: 59 (0.8%)
- Italian: 47 (0.6%)
- Kenyan: 41 (0.5%)
- Swedish: 27 (0.4%)
- Senegalese: 23 (0.3%)
- German: 19 (0.3%)
- Polish: 12 (0.2%)
- Pennsylvania German: 8 (0.1%)
- French Canadian: 5 (0.07%)
- Ugandan: 1 (0.01%)
Most common places of birth for foreign-born residents (%):
| Darby: | 43.8% (877) |
| Pennsylvania: | 1.4% (12,910) |
| Darby: | 11.8% (237) |
| Pennsylvania: | 0.6% (5,479) |
| Darby: | 8.1% (162) |
| Pennsylvania: | 2.4% (22,612) |
| Darby: | 7.8% (157) |
| Pennsylvania: | 0.1% (1,090) |
| Darby: | 5.4% (108) |
| Pennsylvania: | 1.6% (15,224) |
| Darby: | 4.9% (99) |
| Pennsylvania: | 0.0% (449) |
| Darby: | 3.4% (68) |
| Pennsylvania: | 1.1% (10,709) |
| Darby: | 3.1% (63) |
| Pennsylvania: | 0.4% (3,949) |
| Darby: | 2.1% (43) |
| Pennsylvania: | 0.5% (4,946) |
| Darby: | 2.1% (42) |
| Pennsylvania: | 0.5% (5,099) |
| Darby: | 1.7% (35) |
| Pennsylvania: | 1.0% (9,205) |
Place of birth for U.S.-born residents:
- This state: 7,546
- Other state: 1,043
- Northeast: 335
- Midwest: 45
- South: 621
- West: 49
93.2% of Darby residents lived in the same house 1 years ago.
Out of people who lived in different houses, 29.9% lived in this county.
Out of people who lived in different counties, 84.0% lived in Pennsylvania.
| Darby: | 93.2% |
| State average: | 89.3% |
Education attainment for males 25 years and older:
- No schooling: 24
- Nursery to 4th grade: 0
- 5th and 6th grade: 0
- 7th and 8th grade: 51
- 9th grade: 0
- 10th grade: 22
- 11th grade: 39
- 12th grade, no diploma: 42
- High school graduate (or equivalency): 1,452
- Less than 1 year of college: 163
- Some college more than 1 year, no degree: 343
- Associate degree: 323
- Bachelor's degree: 232
- Master's degree: 117
- Professional school degree: 96
- Doctorate degree: 19

Education attainment for females 25 years and older:
- No schooling: 126
- Nursery to 4th grade: 88
- 5th and 6th grade: 5
- 7th and 8th grade: 151
- 9th grade: 128
- 10th grade: 70
- 11th grade: 63
- 12th grade, no diploma: 142
- High school graduate (or equivalency): 970
- Less than 1 year of college: 217
- Some college more than 1 year, no degree: 658
- Associate degree: 321
- Bachelor's degree: 379
- Master's degree: 234
- Professional school degree: 68
- Doctorate degree: 4


Housing units in structures:
- One, detached: 404
- One, attached: 2,758
- Two: 410
- 3 or 4: 290
- 5 to 9: 32
- 10 to 19: 39
- 20 to 49: 27
- 50 or more: 128
Housing units lacking complete kitchen facilities in 2022: 6.8%
House/condo owner moved in on average 16 years ago
Renter moved in on average 3 years ago

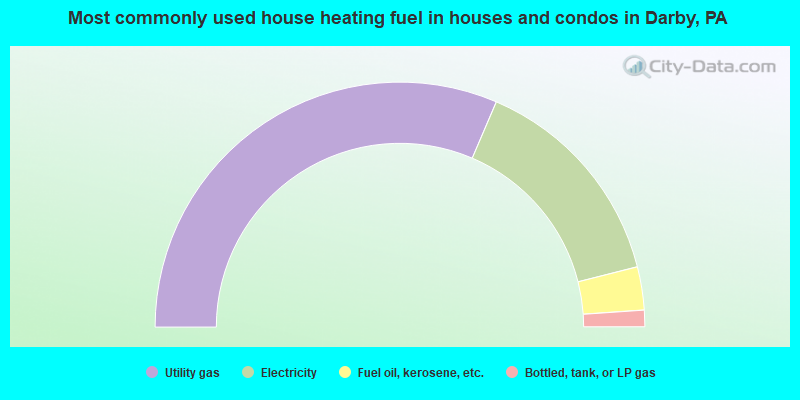
- 62.9%Utility gas
- 29.2%Electricity
- 5.7%Fuel oil, kerosene, etc.
- 2.2%Bottled, tank, or LP gas
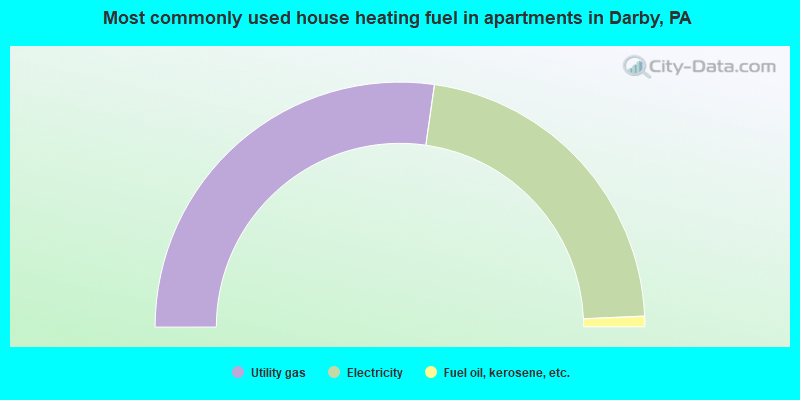
- 54.5%Utility gas
- 44.1%Electricity
- 1.4%Fuel oil, kerosene, etc.
Private vs. public school enrollment:
| Here: | 8.8% |
| Pennsylvania: | 15.7% |
| Here: | 5.1% |
| Pennsylvania: | 13.4% |
| Here: | 35.6% |
| Pennsylvania: | 39.8% |


