Danbury, CT (Connecticut) Houses and Residents
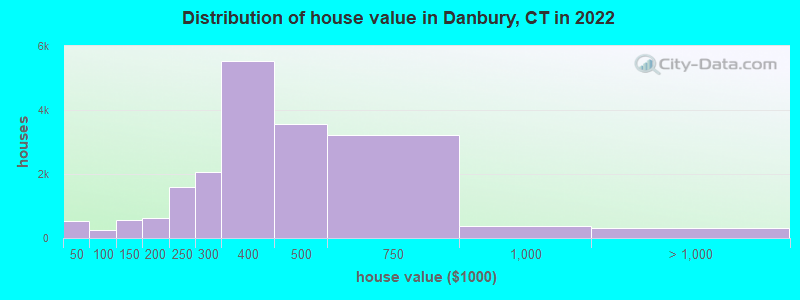
Estimated median house or condo value in 2022: $417,100 (it was $174,600 in 2000 )
Danbury:
$417,100Connecticut:
$347,200
Lower value quartile - upper value quartile: $315,100 - $530,600Mean price in 2022: Detached houses: $442,058 Here:
$442,058State:
$503,946
Townhouses or other attached units: $384,742 Here:
$384,742State:
$304,959
In 2-unit structures: $360,137 Here:
$360,137State:
$304,133
In 3-to-4-unit structures: $238,738 Here:
$238,738State:
$272,970
In 5-or-more-unit structures: $315,255 Here:
$315,255State:
$249,308
Mobile homes: $51,020 Here:
$51,020State:
$151,361
Total population: 83,784 (Urban population: 72,068, Rural population: 2,780 (all nonfarm) )
Houses: 31,578 (30,238 occupied: 17,725 owner occupied, 12,513 renter occupied )
% of renters here:
41%State:
34%
Housing density: 750 houses/condos per square mile
Median price asked for vacant for-sale houses and condos in 2022: $319,725.
Median contract rent in 2022: $1,546 (lower quartile is $1,108, upper quartile is $1,852)
Median rent asked for vacant for-rent units in 2022: $1,477
Median gross rent in Danbury, CT in 2022: $1,788
Housing units in Danbury with a mortgage: 12,781 (1,674 second mortgage, 218 home equity loan, 1,246 both second mortgage and home equity loan )Houses without a mortgage: 664
Median household income for houses/condos with a mortgage: $120,096
Median household income for apartments without a mortgage: $108,432
Median monthly housing costs: $1,883
Data:
Median house or condo value ($)
Median house or condo value ($ change since 2000)
Median house or condo value ($) - White
Median house or condo value ($) - Black or African American
Median house or condo value ($) - Asian
Median house or condo value ($) - Hispanic or Latino
Median house or condo value ($) - American Indian and Alaska Native
Median house or condo value ($) - Multirace
Median house or condo value ($) - Other Race
Median price asked for mobile homes ($)
Household density (households per square mile)
Mean house or condo value by units in structure - 1, detached ($)
Mean house or condo value by units in structure - 1, attached ($)
Mean house or condo value by units in structure - 2 ($)
Mean house or condo value by units in structure by units in structure - 3 or 4 ($)
Mean house or condo value by units in structure - 5 or more ($)
Mean house or condo value by units in structure - Boat, RV, van, etc. ($)
Mean house or condo value by units in structure - Mobile home ($)
Median contract rent ($)
Median contract rent - Lower quartile ($)
Median contract rent - Upper quartile ($)
Median gross rent ($)
Urban houses (%)
Rural houses (%)
Houses occupied (%)
Houses occupied (% change since 2000)
Houses owner occupied (%)
Houses owner occupied (% change since 2000)
Houses renter occupied (%)
Houses renter occupied (% change since 2000)
Vacant housing units - For rent (%)
Vacant housing units - For rent (% change since 2000)
Vacant housing units - For sale only (%)
Vacant housing units - For sale only (% change since 2000)
Vacant housing units - Rented or sold, not occupied (%)
Vacant housing units - Rented or sold, not occupied (% change since 2000)
Vacant housing units - For seasonal, recreational, or occasional use (%)
Vacant housing units - For seasonal, recreational, or occasional use (% change since 2000)
Vacant housing units - For migrant workers (%)
Vacant housing units - For migrant workers (% change since 2000)
Vacant housing units - Other vacant (%)
Vacant housing units - Other vacant (% change since 2000)
Median monthly housing costs ($)
Median household income for houses/condos with a mortgage ($)
Median household income for houses/condos without a mortgage ($)
Median household income ($)
Median household income ($) - White
Median household income ($) - Black or African American
Median household income ($) - Asian
Median household income ($) - Hispanic or Latino
Median household income ($) - American Indian and Alaska Native
Median household income ($) - Multirace
Median household income ($) - Other Race
Mortgage status - with mortgage (%)
Mortgage status - with second mortgage (%)
Mortgage status - with home equity loan (%)
Mortgage status - with both second mortgage and home equity loan (%)
Mortgage status - without a mortgage (%)
Median year house/condo built
Median year apartment built
Household type by relationship - Male householder living alone (%)
Household type by relationship - Male householder not living alone (%)
Household type by relationship - Female householder living alone (%)
Household type by relationship - Female householder not living alone (%)
Household type by relationship - Opposite-Sex spouse (%)
Household type by relationship - Same-Sex spouse (%)
Household type by relationship - Opposite-Sex unmarried partner (%)
Household type by relationship - Same-Sex unmarried partner (%)
Household type by relationship - In group quarters (%)
Size of family households - 2-person household (%)
Size of family households - 3-person household (%)
Size of family households - 4-person household (%)
Size of family households - 5-person household (%)
Size of family households - 6-person household (%)
Size of family households - 7-or-more-person household (%)
Size of nonfamily households - 1-person household (%)
Size of nonfamily households - 2-person household (%)
Size of nonfamily households - 3-person household (%)
Size of nonfamily households - 4-person household (%)
Size of nonfamily households - 5-person household (%)
Size of nonfamily households - 6-person household (%)
Size of nonfamily households - 7-or-moreperson household (%)
Year house built - Built 2010 or later (%)
Year house built - Built 2000 to 2009 (%)
Year house built - Built 1990 to 1999 (%)
Year house built - Built 1980 to 1989 (%)
Year house built - Built 1970 to 1979 (%)
Year house built - Built 1960 to 1969 (%)
Year house built - Built 1950 to 1959 (%)
Year house built - Built 1940 to 1949 (%)
Year house built - Built 1939 or earlier (%)
Median number of rooms in houses and condos
Median number of rooms in apartments
Median number of bedrooms in owner occupied houses
Mean number of bedrooms in owner occupied houses
Median number of bedrooms in renter occupied houses
Mean number of bedrooms in renter occupied houses
Median number of vehichles in owner occupied houses
Mean number of vehichles in owner occupied houses
Median number of vehichles in renter occupied houses
Mean number of vehichles in renter occupied houses
Rooms in owner-occupied houses - 1 room (%)
Rooms in owner-occupied houses - 2 rooms (%)
Rooms in owner-occupied houses - 3 rooms (%)
Rooms in owner-occupied houses - 4 rooms (%)
Rooms in owner-occupied houses - 5 rooms (%)
Rooms in owner-occupied houses - 6 rooms (%)
Rooms in owner-occupied houses - 7 rooms (%)
Rooms in owner-occupied houses - 8 rooms (%)
Rooms in owner-occupied houses - 9+ rooms (%)
Rooms in renter-occupied houses - 1 room (%)
Rooms in renter-occupied houses - 2 rooms (%)
Rooms in renter-occupied houses - 3 rooms (%)
Rooms in renter-occupied houses - 4 rooms (%)
Rooms in renter-occupied houses - 5 rooms (%)
Rooms in renter-occupied houses - 6 rooms (%)
Rooms in renter-occupied houses - 7 rooms (%)
Rooms in renter-occupied houses - 8 rooms (%)
Rooms in renter-occupied houses - 9+ rooms (%)
Bedrooms in owner-occupied houses - no bedrooms (%)
Bedrooms in owner-occupied houses - 1 bedroom (%)
Bedrooms in owner-occupied houses - 2 bedrooms (%)
Bedrooms in owner-occupied houses - 3 bedrooms (%)
Bedrooms in owner-occupied houses - 4 bedrooms (%)
Bedrooms in owner-occupied houses - 5+ bedrooms (%)
Bedrooms in renter-occupied houses - no bedrooms (%)
Bedrooms in renter-occupied houses - 1 bedroom (%)
Bedrooms in renter-occupied houses - 2 bedrooms (%)
Bedrooms in renter-occupied houses - 3 bedrooms (%)
Bedrooms in renter-occupied houses - 4 bedrooms (%)
Bedrooms in renter-occupied houses - 5+ bedrooms (%)
Vehicles available in owner-occupied houses - no vehicle available (%)
Vehicles available in owner-occupied houses - 1 vehicle available(%)
Vehicles available in owner-occupied houses - 2 Vehicles available (%)
Vehicles available in owner-occupied houses - 3 Vehicles available (%)
Vehicles available in owner-occupied houses - 4 Vehicles available (%)
Vehicles available in owner-occupied houses - 5+ Vehicles available (%)
Vehicles available in renter-occupied houses - no vehicle available (%)
Vehicles available in renter-occupied houses - 1 vehicle available (%)
Vehicles available in renter-occupied houses - 2 Vehicles available (%)
Vehicles available in renter-occupied houses - 3 Vehicles available (%)
Vehicles available in renter-occupied houses - 4 Vehicles available (%)
Vehicles available in renter-occupied houses - 5+ Vehicles available (%)
Housing units in structures - 1, detached (%)
Housing units in structures - 1, attached (%)
Housing units in structures - 2 (%)
Housing units in structures - 3 or 4 (%)
Housing units in structures - 5 to 9 (%)
Housing units in structures - 10 to 19 (%)
Housing units in structures - 20 to 49 (%)
Housing units in structures - 50 or more (%)
Housing units in structures - Mobile home (%)
Housing units in structures - Boat, RV, van, etc. (%)
Housing units in structures - Owners - 1, detached (%)
Housing units in structures - Owners - 1, attached (%)
Housing units in structures - Owners - 2 (%)
Housing units in structures - Owners - 3 or 4 (%)
Housing units in structures - Owners - 5 to 9 (%)
Housing units in structures - Owners - 10 to 19 (%)
Housing units in structures - Owners - 20 to 49 (%)
Housing units in structures - Owners - 50 or more (%)
Housing units in structures - Owners - Mobile home (%)
Housing units in structures - Owners - Boat, RV, van, etc. (%)
Housing units in structures - Renters - 1, detached (%)
Housing units in structures - Renters - 1, attached (%)
Housing units in structures - Renters - 2 (%)
Housing units in structures - Renters - 3 or 4 (%)
Housing units in structures - Renters - 5 to 9 (%)
Housing units in structures - Renters - 10 to 19 (%)
Housing units in structures - Renters - 20 to 49 (%)
Housing units in structures - Renters - 50 or more (%)
Housing units in structures - Renters - Mobile home (%)
Housing units in structures - Renters - Boat, RV, van, etc. (%)
House/condo owner moved in on average (years ago)
Renter moved in on average (years ago)
Year householder moved into unit - Moved in 1999 to March 2000 (%)
Year householder moved into unit - Moved in 1999 to March 2000 (%) - White
Year householder moved into unit - Moved in 1999 to March 2000 (%) - Black or African American
Year householder moved into unit - Moved in 1999 to March 2000 (%) - Asian
Year householder moved into unit - Moved in 1999 to March 2000 (%) - Hispanic or Latino
Year householder moved into unit - Moved in 1999 to March 2000 (%) - American Indian and Alaska Native
Year householder moved into unit - Moved in 1999 to March 2000 (%) - Multirace
Year householder moved into unit - Moved in 1999 to March 2000 (%) - Other Race
Year householder moved into unit - Moved in 1995 to 1998 (%)
Year householder moved into unit - Moved in 1995 to 1998 (%) - White
Year householder moved into unit - Moved in 1995 to 1998 (%) - Black or African American
Year householder moved into unit - Moved in 1995 to 1998 (%) - Asian
Year householder moved into unit - Moved in 1995 to 1998 (%) - Hispanic or Latino
Year householder moved into unit - Moved in 1995 to 1998 (%) - American Indian and Alaska Native
Year householder moved into unit - Moved in 1995 to 1998 (%) - Multirace
Year householder moved into unit - Moved in 1995 to 1998 (%) - Other Race
Year householder moved into unit - Moved in 1990 to 1994 (%)
Year householder moved into unit - Moved in 1990 to 1994 (%) - White
Year householder moved into unit - Moved in 1990 to 1994 (%) - Black or African American
Year householder moved into unit - Moved in 1990 to 1994 (%) - Asian
Year householder moved into unit - Moved in 1990 to 1994 (%) - Hispanic or Latino
Year householder moved into unit - Moved in 1990 to 1994 (%) - American Indian and Alaska Native
Year householder moved into unit - Moved in 1990 to 1994 (%) - Multirace
Year householder moved into unit - Moved in 1990 to 1994 (%) - Other Race
Year householder moved into unit - Moved in 1980 to 1989 (%)
Year householder moved into unit - Moved in 1980 to 1989 (%) - White
Year householder moved into unit - Moved in 1980 to 1989 (%) - Black or African American
Year householder moved into unit - Moved in 1980 to 1989 (%) - Asian
Year householder moved into unit - Moved in 1980 to 1989 (%) - Hispanic or Latino
Year householder moved into unit - Moved in 1980 to 1989 (%) - American Indian and Alaska Native
Year householder moved into unit - Moved in 1980 to 1989 (%) - Multirace
Year householder moved into unit - Moved in 1980 to 1989 (%) - Other Race
Year householder moved into unit - Moved in 1970 to 1979 (%)
Year householder moved into unit - Moved in 1970 to 1979 (%) - White
Year householder moved into unit - Moved in 1970 to 1979 (%) - Black or African American
Year householder moved into unit - Moved in 1970 to 1979 (%) - Asian
Year householder moved into unit - Moved in 1970 to 1979 (%) - Hispanic or Latino
Year householder moved into unit - Moved in 1970 to 1979 (%) - American Indian and Alaska Native
Year householder moved into unit - Moved in 1970 to 1979 (%) - Multirace
Year householder moved into unit - Moved in 1970 to 1979 (%) - Other Race
Year householder moved into unit - Moved in 1969 or earlier (%)
Year householder moved into unit - Moved in 1969 or earlier (%) - White
Year householder moved into unit - Moved in 1969 or earlier (%) - Black or African American
Year householder moved into unit - Moved in 1969 or earlier (%) - Asian
Year householder moved into unit - Moved in 1969 or earlier (%) - Hispanic or Latino
Year householder moved into unit - Moved in 1969 or earlier (%) - American Indian and Alaska Native
Year householder moved into unit - Moved in 1969 or earlier (%) - Multirace
Year householder moved into unit - Moved in 1969 or earlier (%) - Other Race
Housing units lacking complete plumbing facilities (%)
Housing units lacking complete kitchen facilities (%)
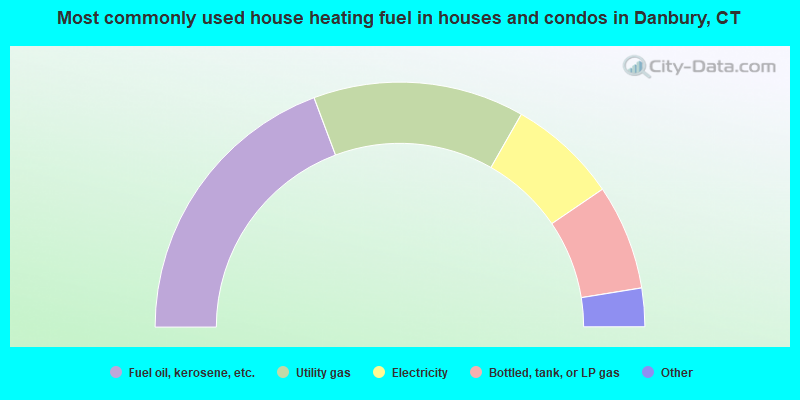
House heating fuel used in houses and condos - Utility gas (%)
House heating fuel used in houses and condos - Bottled, tank, or LP gas (%)
House heating fuel used in houses and condos - Electricity (%)
House heating fuel used in houses and condos - Fuel oil, kerosene, etc. (%)
House heating fuel used in houses and condos - Coal or coke (%)
House heating fuel used in houses and condos - Wood (%)
House heating fuel used in houses and condos - Solar energy (%)
House heating fuel used in houses and condos - Other fuel (%)
House heating fuel used in houses and condos - No fuel used (%)
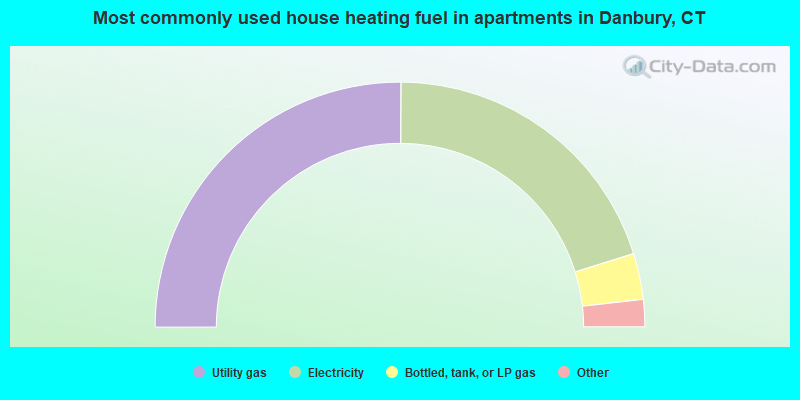
House heating fuel used in apartments - Utility gas (%)
House heating fuel used in apartments - Bottled, tank, or LP gas (%)
House heating fuel used in apartments - Electricity (%)
House heating fuel used in apartments - Fuel oil, kerosene, etc. (%)
House heating fuel used in apartments - Coal or coke (%)
House heating fuel used in apartments - Wood (%)
House heating fuel used in apartments - Solar energy (%)
House heating fuel used in apartments - Other fuel (%)
House heating fuel used in apartments - No fuel used (%)
Latest news about housing in Danbury, CT collected exclusively by city-data.com from local newspapers, TV, and radio stations
Median year house/condo built: 1971Median year apartment built: 1981Household type by relationship:
Households: 86,971
Male householders: 14,295 (3,319 living alone ), Female householders: 15,943 (3,525 living alone )14,804 spouses (14,657 opposite-sex spouses ), 2,013 unmarried partners , (1,915 opposite-sex unmarried partners ), 27,501 children (26,420 natural , 106 adopted , 975 stepchildren ), 2,755 grandchildren , 936 brothers or sisters , 1,014 parents , 149 foster children , 1,654 other relatives , 2,964 non-relatives In group quarters: 2,943
Size of family households: 8,258 2-persons , 4,476 3-persons , 4,936 4-persons , 2,146 5-persons , 922 6-persons , 699 7-or-more-persons .
Size of nonfamily households: 6,844 1-person , 1,308 2-persons , 577 3-persons , 72 5-persons .
9,902 married couples with children. single-parent households (1,201 men , 3,583 women ).
54.8% of residents of Danbury speak English at home. of residents speak Spanish at home (47% speak English very well , 25% speak English well , 17% speak English not well , 11% don't speak English at all ).of residents speak other Indo-European language at home (58% speak English very well , 22% speak English well , 11% speak English not well , 8% don't speak English at all ).of residents speak Asian or Pacific Island language at home (65% speak English very well , 19% speak English well , 14% speak English not well , 2% don't speak English at all ).of residents speak other language at home (92% speak English very well , 7% speak English well , 1% speak English not well ).
Foreign born population: 28,371 (32.6%)of them are naturalized citizens )
Median number of rooms in houses and condos:
Median number of rooms in apartments
Owner-occupied Renter-occupied
Rooms in owner-occupied houses in Danbury, Connecticut
82 1 room 66 2 rooms 1,068 3 rooms 2,400 4 rooms 1,882 5 rooms 2,931 6 rooms 2,652 7 rooms 2,949 8 rooms 3,695 9+ rooms
Rooms in renter-occupied apartments in Danbury, Connecticut
392 1 room 735 2 rooms 2,715 3 rooms 2,990 4 rooms 3,109 5 rooms 1,418 6 rooms 840 7 rooms 0 8 rooms 314 9+ rooms
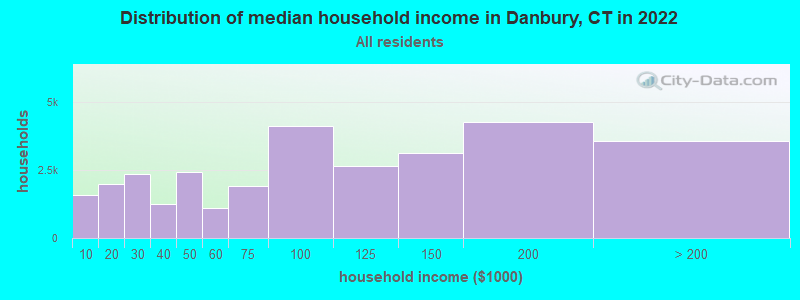
Danbury, CT household income distribution 1,566 Less than $10,0001,979 $10,000 to $19,9992,355 $20,000 to $29,9991,228 $30,000 to $39,9992,404 $40,000 to $49,9991,103 $50,000 to $59,9991,908 $60,000 to $74,9994,121 $75,000 to $99,9992,656 $100,000 to $124,9993,103 $125,000 to $149,9994,252 $150,000 to $199,9993,563 $200,000 or more
Home value of owner - occupied houses in 2022 in Danbury, CT 253 Less than $10,00099 $10,000 to $14,99918 $15,000 to $19,99936 $20,000 to $24,99941 $25,000 to $29,99926 $30,000 to $34,99942 $35,000 to $39,99910 $40,000 to $49,99937 $50,000 to $59,99939 $60,000 to $69,99926 $70,000 to $79,99976 $80,000 to $89,99965 $90,000 to $99,999426 $100,000 to $124,999141 $125,000 to $149,999303 $150,000 to $174,999333 $175,000 to $199,9991,608 $200,000 to $249,9992,062 $250,000 to $299,9995,528 $300,000 to $399,9993,564 $400,000 to $499,9993,224 $500,000 to $749,999374 $750,000 to $999,999219 $1,000,000 to $1,499,99962 $1,500,000 to $1,999,99945 $2,000,000 or moreRent paid by renters in 2022 in Danbury, CT 62 Less than $10082 $100 to $149151 $150 to $19927 $200 to $24979 $250 to $299285 $300 to $34967 $350 to $399290 $400 to $449198 $450 to $49993 $500 to $54959 $550 to $599177 $600 to $64986 $650 to $699272 $700 to $749213 $750 to $799506 $800 to $899355 $900 to $9991,958 $1,000 to $1,2492,161 $1,250 to $1,4994,242 $1,500 to $1,9991,374 $2,000 to $2,499600 $2,500 to $2,99984 $3,000 to $3,499124 $3,500 or more537 No cash rent
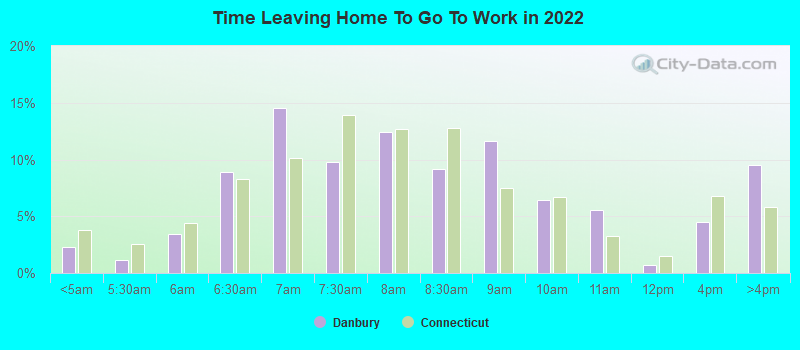
Percentage of workers working in this county: 77.5%Number of people working at home: 5,920 (12.9% of all workers )
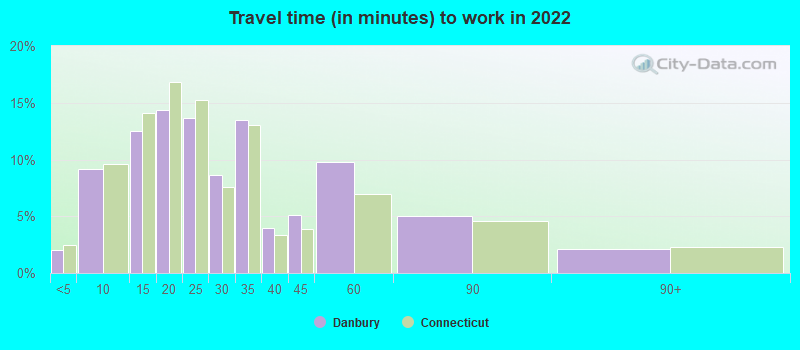
Travel time to work (commute)
Less than 5 minutes: 6965 to 9 minutes: 3,27810 to 14 minutes: 6,36715 to 19 minutes: 6,59020 to 24 minutes: 3,68525 to 29 minutes: 2,83030 to 34 minutes: 5,27535 to 39 minutes: 49140 to 44 minutes: 2,58245 to 59 minutes: 3,15260 to 89 minutes: 2,98690 or more minutes: 1,235
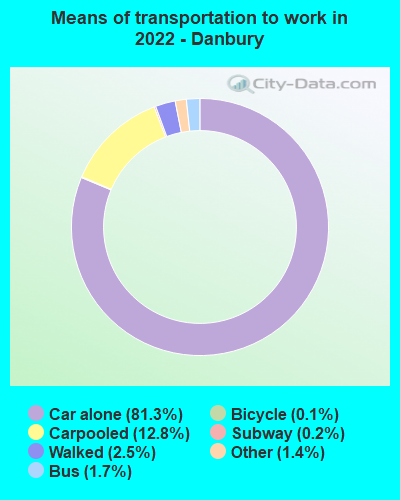
Means of transportation to work:
Drove a car alone: 36,228 (73.0%)Carpooled: 5,705 (11.5%)Bus : 769 (1.6%)Long-distance train or commuter rail : 69 (0.1%)Taxi: 619 (1.2%)Bicycle: 65 (0.1%)Walked: 1,127 (2.3%)Worked at home: 5,018 (10.1%)
Unemployment by race in 2022
Unemployment rate for White non-Hispanic residents 2.6% Males3.7% FemalesUnemployment rate for Black residents 16.6% Males3.5% FemalesUnemployment rate for American Indian and Alaska Native residents 8.1% MalesUnemployment rate for Asian residents 5.7% MalesUnemployment rate for other race residents 3.1% Males2.0% FemalesUnemployment rate for two or more race residents 4.6% Males13.5% FemalesUnemployment rate for Hispanic or Latino residents 4.3% Males4.3% Females
Year of entry for the foreign-born population in Danbury, Connecticut
10,383 2010 or later 8,968 2000 to 2009 5,702 1990 to 1999 5,006 1980 to 1989 2,046 1970 to 1979 2,216 Before 1970
First ancestries reported:
Brazilian: 3,949 (8.6%)
Italian: 3,573 (7.8%)
Irish: 1,936 (4.2%)
Portuguese: 1,739 (3.8%)
German: 1,472 (3.2%)
American: 1,361 (3.0%)
Jamaican: 1,176 (2.6%)
English: 677 (1.5%)
Polish: 672 (1.5%)
Ghanaian: 601 (1.3%)
Lebanese: 555 (1.2%)
Ugandan: 491 (1.1%)
European: 461 (1.0%)
Russian: 321 (0.7%)
Guyanese: 270 (0.6%)
Czechoslovakian: 246 (0.5%)
Macedonian: 240 (0.5%)
Scottish: 235 (0.5%)
Hungarian: 226 (0.5%)
African: 219 (0.5%)
Latvian: 208 (0.5%)
Greek: 187 (0.4%)
French Canadian: 173 (0.4%)
Haitian: 153 (0.3%)
Slovak: 148 (0.3%)
Ukrainian: 146 (0.3%)
West Indian: 122 (0.3%)
Swedish: 118 (0.3%)
South African: 109 (0.2%)
Norwegian: 99 (0.2%)
Armenian: 98 (0.2%)
Eastern European: 93 (0.2%)
Syrian: 72 (0.2%)
Slavic: 71 (0.2%)
Welsh: 67 (0.1%)
Cape Verdean: 61 (0.1%)
Austrian: 61 (0.1%)
British: 57 (0.1%)
Scotch-Irish: 54 (0.1%)
Barbadian: 54 (0.1%)
Croatian: 53 (0.1%)
French: 52 (0.1%)
Bulgarian: 48 (0.1%)
Australian: 46 (0.1%)
Danish: 33 (0.07%)
Palestinian: 33 (0.07%)
Canadian: 32 (0.07%)
Lithuanian: 29 (0.06%)
Nigerian: 26 (0.06%)
Swiss: 23 (0.05%)
Serbian: 20 (0.04%)
British West Indian: 20 (0.04%)
Northern European: 18 (0.04%)
Dutch: 18 (0.04%)
Trinidadian and Tobagonian: 16 (0.03%)
Scandinavian: 14 (0.03%)
Pennsylvania German: 12 (0.03%)
Czech: 11 (0.02%)
Belizean: 10 (0.02%)
Romanian: 9 (0.02%)
Arab: 5 (0.01%)
Carpatho Rusyn: 5 (0.01%)
Iranian: 3 (0.01%)
Afghan: 3 (0.01%)
Most common places of birth for foreign-born residents (%): Ecuador Danbury:
23.0% (6,809)Connecticut:
4.4% (24,026)
Brazil Danbury:
17.5% (5,170)Connecticut:
4.7% (25,461)
Dominican Republic Danbury:
14.0% (4,146)Connecticut:
5.0% (27,361)
Mexico Danbury:
6.7% (1,983)Connecticut:
4.8% (25,802)
Guatemala Danbury:
4.1% (1,199)Connecticut:
3.2% (17,617)
Jamaica Danbury:
3.8% (1,111)Connecticut:
7.5% (40,568)
Portugal Danbury:
3.4% (1,011)Connecticut:
1.7% (9,214)
India Danbury:
2.9% (851)Connecticut:
7.3% (39,879)
Philippines Danbury:
1.8% (532)Connecticut:
1.9% (10,545)
Peru Danbury:
1.6% (473)Connecticut:
2.5% (13,591)
Place of birth for U.S.-born residents:
This state: 34,589Other state: 21,612Northeast: 17,276Midwest: 856South: 2,071West: 1,409 85.2% of Danbury residents lived in the same house 1 years ago.
Out of people who lived in different houses, 35.1% lived in this county.
Out of people who lived in different counties, 26.6% lived in Connecticut.
Danbury:
85.2%State average:
88.4%
Education attainment for males 25 years and older:
No schooling: 1,301Nursery to 4th grade: 6745th and 6th grade: 6717th and 8th grade: 2189th grade: 13110th grade: 42511th grade: 1,28512th grade, no diploma: 870High school graduate (or equivalency): 8,080Less than 1 year of college: 1,631Some college more than 1 year, no degree: 2,306Associate degree: 1,620Bachelor's degree: 6,955Master's degree: 1,711Professional school degree: 697Doctorate degree: 55
Education attainment for females 25 years and older:
No schooling: 661Nursery to 4th grade: 9885th and 6th grade: 5557th and 8th grade: 1899th grade: 42810th grade: 31011th grade: 1,15512th grade, no diploma: 722High school graduate (or equivalency): 5,129Less than 1 year of college: 1,543Some college more than 1 year, no degree: 1,940Associate degree: 3,302Bachelor's degree: 7,176Master's degree: 3,643Professional school degree: 922Doctorate degree: 298
Housing units in structures:
One, detached: 14,296One, attached: 4,054Two: 2,6493 or 4: 2,9385 to 9: 1,28110 to 19: 1,04320 to 49: 2,49150 or more: 2,327Mobile homes: 499Median worth of mobile homes: $46,200
Housing units lacking complete plumbing facilities in 2022: 0.2%Housing units lacking complete kitchen facilities in 2022: 0.2%House/condo owner moved in on average 14 years ago
Renter moved in on average 4 years ago
Private vs. public school enrollment:
Students in private schools in grades 1 to 8 (elementary and middle school): 741 Here:
7.2%Connecticut:
9.5%
Students in private schools in grades 9 to 12 (high school): 160 Here:
3.0%Connecticut:
12.9%
Students in private undergraduate colleges: 1,298 Here:
21.8%Connecticut:
35.5%