Cumberland Hill, RI (Rhode Island) Houses and Residents
| Cumberland Hill: | $398,228 |
| Rhode Island: | $383,900 |
Mean price in 2022:
Detached houses: $475,104
Here: $475,104 State: $445,354 Townhouses or other attached units: $305,891
Here: $305,891 State: $371,092 In 2-unit structures: $399,083
Here: $399,083 State: $317,098 In 5-or-more-unit structures: $157,780
Here: $157,780 State: $291,252
Total population: 7,934 (Urban population: 7,707, Rural population: 0)
Houses: 3,383 (3,366 occupied: 2,984 owner occupied, 495 renter occupied)
| % of renters here: | 14% |
| State: | 37% |
Housing density: 1,030 houses/condos per square mile
Median price asked for vacant for-sale houses and condos in 2022 in this county: $275,451.
Median contract rent in 2022: $1,013 (lower quartile is $768, upper quartile is $1,338)
Median rent asked for vacant for-rent units in 2022: $1,140
Median gross rent in Cumberland Hill, RI in 2022: $1,054
Housing units in Cumberland Hill with a mortgage: 2,175 (274 second mortgage, 0 home equity loan, 268 both second mortgage and home equity loan)
Houses without a mortgage: 141
Median household income for houses/condos with a mortgage: $139,854
Median household income for apartments without a mortgage: $129,421
Median monthly housing costs: $1,746
Compare current foreclosures near Cumberland Hill, RI:
| Photo | Address | Area | Beds / Baths | Price | Details |
|---|---|---|---|---|---|

|
#1
Loomis St
North Attleboro, MA 02760
|
2,294 sq. feet
|
2 baths 4 beds |
$700,000
|
show details |

|
#2
Round Lake Dr
Pascoag, RI 02859
|
976 sq. feet
|
2 baths 2 beds |
$179,900
|
show details |

|
#3
Mount Pleasant Rd
Harrisville, RI 02830
|
1,232 sq. feet
|
1 baths 3 beds |
$449,900
|
show details |

|
#4
Whittier Ave
Providence, RI 02909
|
3 sq. feet
|
3 baths 6 beds |
$109,900
|
show details |

|
#5
Cook Rd
Cumberland, RI 02864
|
2,050 sq. feet
|
2 baths 4 beds |
$724,900
|
show details |

|
#6
Broadway
North Attleboro, MA 02760
|
2,602 sq. feet
|
3 baths 5 beds |
show details | |

|
#7
Riverside Rd
Franklin, MA 02038
|
3,093 sq. feet
|
2 baths 4 beds |
show details | |

|
#8
Atwood Ave
Johnston, RI 02919
|
1,792 sq. feet
|
2 baths 4 beds |
show details | |

|
#9
N Main St
Pascoag, RI 02859
|
- sq. feet
|
- baths - beds |
$100,000
|
show details |

|
#10
Bracken St
Cranston, RI 02920
|
1,248 sq. feet
|
1 baths 4 beds |
show details |
| Photo | Address | Area | Beds / Baths | Price | Details |
|---|---|---|---|---|---|

|
#11
Valley Green Court
Providence, RI 02904
|
1,440 sq. feet
|
3 baths 2 beds |
show details | |

|
#12
Woburn St
Cranston, RI 02910
|
1,212 sq. feet
|
1 baths 4 beds |
show details | |

|
#13
Atwood Ave
Johnston, RI 02919
|
1,792 sq. feet
|
1 baths 4 beds |
show details | |

|
#14
Hillwood St
Cranston, RI 02920
|
1,800 sq. feet
|
2 baths 4 beds |
show details | |

|
#15
Follett St
East Providence, RI 02914
|
1,584 sq. feet
|
2 baths 4 beds |
show details | |

|
#16
Post Rd
Warwick, RI 02888
|
6,746 sq. feet
|
3 baths 7 beds |
show details | |

|
#17
Wood St
Providence, RI 02909
|
2,839 sq. feet
|
3 baths 8 beds |
show details | |

|
#18
-42 N Main St
Whitinsville, MA 01588
|
2,318 sq. feet
|
4 baths 6 beds |
show details | |

|
#19
Blanding Ave
East Providence, RI 02914
|
1,165 sq. feet
|
1 baths 3 beds |
show details | |

|
#20
Bishop Hill Rd
Johnston, RI 02919
|
1,648 sq. feet
|
1 baths 3 beds |
show details |
| Photo | Address | Area | Beds / Baths | Price | Details |
|---|---|---|---|---|---|

|
#21
Bishop Hill Rd
Johnston, RI 02919
|
1,248 sq. feet
|
1 baths 3 beds |
show details | |

|
#22
What Cheer Ave
Providence, RI 02909
|
2,280 sq. feet
|
2 baths 3 beds |
show details | |

|
#23
Scranton Ave
Warwick, RI 02888
|
1,524 sq. feet
|
2 baths 3 beds |
show details | |

|
#24
Pond St
Franklin, MA 02038
|
1,100 sq. feet
|
1 baths 3 beds |
show details | |

|
#25
Edgemere Ave
Providence, RI 02909
|
1,328 sq. feet
|
2 baths 4 beds |
show details | |

|
#26
Berkshire Ave
Sharon, MA 02067
|
1,289 sq. feet
|
2 baths 3 beds |
show details | |

|
#27
Woodland Ave
Seekonk, MA 02771
|
4,611 sq. feet
|
4 baths 4 beds |
show details | |

|
#28
Pridemark Ln
Attleboro, MA 02703
|
1,340 sq. feet
|
1 baths 2 beds |
show details | |

|
#29
Hancock St
Milford, MA 01757
|
1,946 sq. feet
|
1 baths 4 beds |
show details | |

|
#30
Weston Ave
Cranston, RI 02920
|
2,378 sq. feet
|
2 baths 4 beds |
show details |
| Photo | Address | Area | Beds / Baths | Price | Details |
|---|---|---|---|---|---|

|
#31
Quail Hollow Rd
Cranston, RI 02920
|
1,564 sq. feet
|
1 baths 3 beds |
show details | |

|
#32
River Dr
Johnston, RI 02919
|
1,190 sq. feet
|
2 baths 3 beds |
show details | |

|
#33
Holliston St
Medway, MA 02053
|
2,010 sq. feet
|
2 baths 4 beds |
show details | |

|
#34
Miner St
Providence, RI 02905
|
2,704 sq. feet
|
3 baths 8 beds |
show details | |

|
#35
High St
Uxbridge, MA 01569
|
1,296 sq. feet
|
1 baths 3 beds |
show details | |

|
#36
Heath St
Riverside, RI 02915
|
1,372 sq. feet
|
2 baths 3 beds |
show details | |

|
#37
California Ave
Providence, RI 02905
|
1,560 sq. feet
|
1 baths 4 beds |
show details | |

|
#38
Broad St
Rehoboth, MA 02769
|
2,352 sq. feet
|
2 baths 4 beds |
show details | |

|
#39
Godfrey Dr
Norton, MA 02766
|
2,043 sq. feet
|
2 baths 2 beds |
show details | |

|
#40
Atwood Ave
Johnston, RI 02919
|
1,541 sq. feet
|
3 baths 4 beds |
show details |
| Photo | Address | Area | Beds / Baths | Price | Details |
|---|---|---|---|---|---|

|
#41
Snake Hill Rd
North Scituate, RI 02857
|
1,132 sq. feet
|
2 baths 2 beds |
show details | |

|
#42
Taylor Ct
Norton, MA 02766
|
1,020 sq. feet
|
1 baths 2 beds |
show details | |

|
#43
Pierce St
Foxboro, MA 02035
|
1,352 sq. feet
|
1 baths 3 beds |
show details | |

|
#44
Eagle Rd
Cranston, RI 02920
|
1,392 sq. feet
|
1 baths 3 beds |
show details | |

|
#45
Meryl St
Medway, MA 02053
|
960 sq. feet
|
1 baths 3 beds |
show details | |

|
#46
Whipple Ave
Cranston, RI 02920
|
3,263 sq. feet
|
3 baths 7 beds |
show details | |

|
#47
Arlington St
East Providence, RI 02914
|
1,092 sq. feet
|
2 baths 2 beds |
show details | |

|
#48
Whipple Ave
Cranston, RI 02920
|
2,233 sq. feet
|
2 baths 6 beds |
show details | |

|
#49
Washington Dr
Johnston, RI 02919
|
2,947 sq. feet
|
2 baths 4 beds |
show details | |

|
Check over 1 million property listings on Foreclosure.com!
|
browse all offers | |||


 | Housing Bubble in Rhode Island (81 replies) |
| Elementary school with more Asians? (21 replies) |
| Russian community??? (40 replies) |
| Vision: 45 Minute Train ride Providence - Boston (17 replies) |
| Moving to Rumford,RI (49 replies) |
| Medfield, Mass, Barrington RI, or ??? (18 replies) |

Median year apartment built: 1975
Household type by relationship:
Households: 8,856- Male householders: 1,768 (244 living alone), Female householders: 1,578 (605 living alone)
1,972 spouses (1,972 opposite-sex spouses), 250 unmarried partners, (236 opposite-sex unmarried partners), 2,756 children (2,722 natural, 33 adopted, 0 stepchildren), 61 grandchildren, 0 brothers or sisters, 158 parents, 0 foster children, 66 other relatives, 201 non-relatives
- In group quarters: 40
Size of family households: 838 2-persons, 660 3-persons, 640 4-persons, 126 5-persons, 48 6-persons.
Size of nonfamily households: 908 1-person, 219 2-persons.
1,320 married couples with children.
353 single-parent households (66 men, 287 women).
82.0% of residents of Cumberland Hill speak English at home.
4.0% of residents speak Spanish at home (95% speak English very well, 5% speak English not well).
7.3% of residents speak other Indo-European language at home (85% speak English very well, 12% speak English well, 3% speak English not well).
6.5% of residents speak Asian or Pacific Island language at home (66% speak English very well, 34% speak English well).
0.5% of residents speak other language at home (100% speak English very well).
Foreign born population: 927 (10.5%)
(44.8% of them are naturalized citizens)
| Here: | 6.2 |
| State: | 6.2 |
| Here: | 4.2 |
| State: | 4.1 |

- Bedrooms in owner-occupied houses and condos in Cumberland Hill, Rhode Island
- 0no bedroom
- 191 bedroom
- 6782 bedrooms
- 1,7923 bedrooms
- 3584 bedrooms
- 1375+ bedrooms

- Bedrooms in renter-occupied apartments in Cumberland Hill, Rhode Island
- 0no bedroom
- 2281 bedroom
- 1752 bedrooms
- 523 bedrooms
- 04 bedrooms
- 425+ bedrooms

- Cars and other vehicles available in Cumberland Hill in owner-occupied houses/condos
- 99no vehicle
- 7591 vehicle
- 1,2382 vehicles
- 5293 vehicles
- 3354 vehicles
- 255+ vehicles

- Cars and other vehicles available in Cumberland Hill in renter-occupied apartments
- 32no vehicle
- 2881 vehicle
- 1662 vehicles
- 93 vehicles
- 04 vehicles
- 05+ vehicles

- Rooms in owner-occupied houses in Cumberland Hill, Rhode Island
- 01 room
- 02 rooms
- 293 rooms
- 2484 rooms
- 7035 rooms
- 7026 rooms
- 8727 rooms
- 2248 rooms
- 2069+ rooms

- Rooms in renter-occupied apartments in Cumberland Hill, Rhode Island
- 01 room
- 252 rooms
- 1433 rooms
- 1174 rooms
- 865 rooms
- 746 rooms
- 07 rooms
- 88 rooms
- 429+ rooms


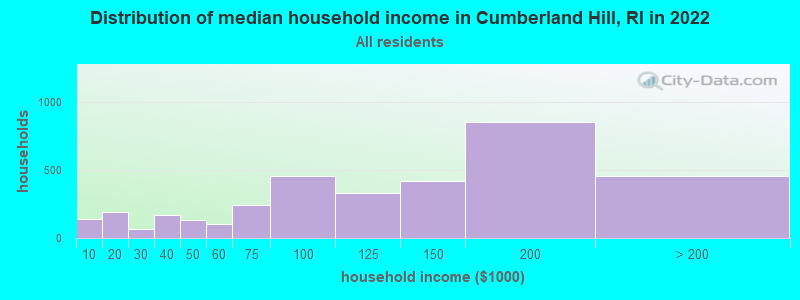
Cumberland Hill, RI household income distribution

- 141Less than $10,000
- 193$10,000 to $19,999
- 64$20,000 to $29,999
- 169$30,000 to $39,999
- 132$40,000 to $49,999
- 104$50,000 to $59,999
- 245$60,000 to $74,999
- 460$75,000 to $99,999
- 331$100,000 to $124,999
- 417$125,000 to $149,999
- 856$150,000 to $199,999
- 459$200,000 or more
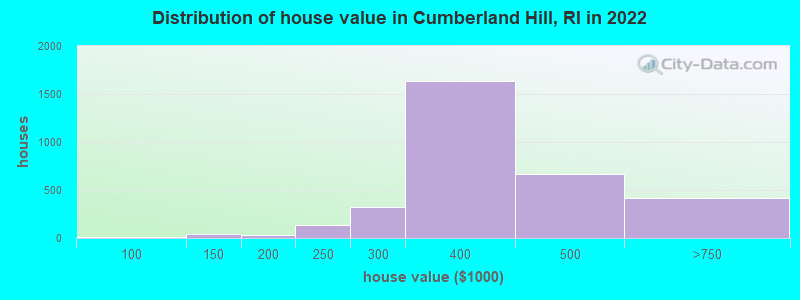
Home value of owner - occupied houses in 2022 in Cumberland Hill, RI
-
- 14$80,000 to $89,999
- 8$100,000 to $124,999
- 33$125,000 to $149,999
- 14$150,000 to $174,999
- 16$175,000 to $199,999
- 138$200,000 to $249,999
- 324$250,000 to $299,999
- 1,633$300,000 to $399,999
- 667$400,000 to $499,999
- 389$500,000 to $749,999
- 27$2,000,000 or more
Rent paid by renters in 2022 in Cumberland Hill, RI
-
- 15$250 to $299
- 20$300 to $349
- 17$350 to $399
- 21$550 to $599
- 10$650 to $699
- 23$750 to $799
- 82$800 to $899
- 30$900 to $999
- 89$1,000 to $1,249
- 16$1,250 to $1,499
- 85$1,500 to $1,999
- 28$2,000 to $2,499
- 16$2,500 to $2,999


Percentage of workers working in this county: 66.9%
Number of people working at home: 476 (9.0% of all workers)
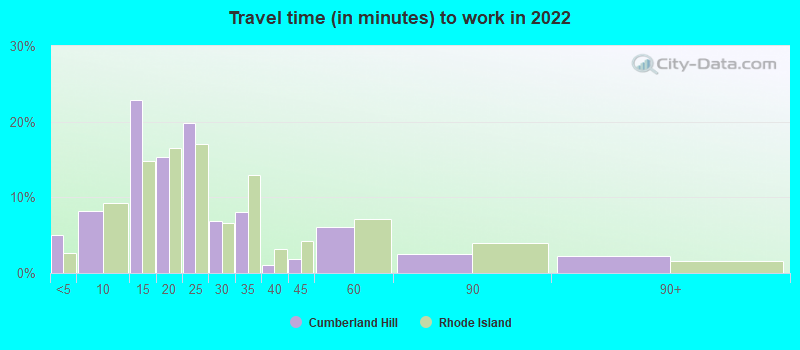
Travel time to work (commute)
- Less than 5 minutes: 148
- 5 to 9 minutes: 187
- 10 to 14 minutes: 1,011
- 15 to 19 minutes: 427
- 20 to 24 minutes: 1,208
- 25 to 29 minutes: 219
- 30 to 34 minutes: 616
- 35 to 39 minutes: 158
- 40 to 44 minutes: 101
- 45 to 59 minutes: 322
- 60 to 89 minutes: 261
- 90 or more minutes: 105
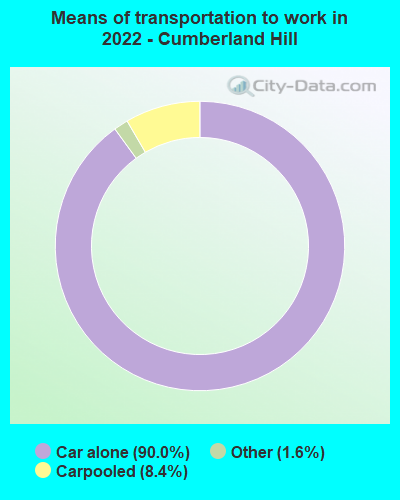
Means of transportation to work:
- Drove a car alone: 1,034 (66.4%)
- Carpooled: 107 (6.9%)
- Taxi: 29 (1.9%)
- Worked at home: 476 (30.6%)

- Unemployment by race in 2022
- Unemployment rate for White non-Hispanic residents
- 1.7%Males
- 2.9%Females
- Unemployment rate for Asian residents
- 8.5%Females

- Year of entry for the foreign-born population in Cumberland Hill, Rhode Island
- 4022010 or later
- 2172000 to 2009
- 351990 to 1999
- 1231980 to 1989
- 541970 to 1979
- 112Before 1970

First ancestries reported:
- Irish: 638 (15.1%)
- French Canadian: 564 (13.3%)
- French: 458 (10.8%)
- Polish: 370 (8.7%)
- Portuguese: 360 (8.5%)
- English: 297 (7.0%)
- Italian: 163 (3.8%)
- Canadian: 72 (1.7%)
- African: 56 (1.3%)
- American: 52 (1.2%)
- Nigerian: 46 (1.1%)
- Scottish: 37 (0.9%)
- Cape Verdean: 37 (0.9%)
- European: 35 (0.8%)
- Lebanese: 34 (0.8%)
- Greek: 21 (0.5%)
- Armenian: 20 (0.5%)
- Czech: 15 (0.4%)
- Swedish: 12 (0.3%)
Most common places of birth for foreign-born residents (%):
| Cumberland Hill: | 20.9% (195) |
| Rhode Island: | 4.1% (6,461) |
| Cumberland Hill: | 12.9% (120) |
| Rhode Island: | 4.1% (6,520) |
| Cumberland Hill: | 12.8% (119) |
| Rhode Island: | 10.0% (15,766) |
| Cumberland Hill: | 11.5% (107) |
| Rhode Island: | 21.0% (33,163) |
| Cumberland Hill: | 11.0% (103) |
| Rhode Island: | 0.5% (712) |
| Cumberland Hill: | 5.7% (53) |
| Rhode Island: | 0.9% (1,345) |
| Cumberland Hill: | 5.7% (53) |
| Rhode Island: | 1.5% (2,304) |
| Cumberland Hill: | 3.0% (28) |
| Rhode Island: | 1.7% (2,625) |
| Cumberland Hill: | 2.5% (23) |
| Rhode Island: | 0.7% (1,026) |
| Cumberland Hill: | 2.4% (22) |
| Rhode Island: | 3.0% (4,789) |
| Cumberland Hill: | 2.1% (20) |
| Rhode Island: | 0.7% (1,051) |
| Cumberland Hill: | 2.1% (20) |
| Rhode Island: | 1.8% (2,826) |
| Cumberland Hill: | 1.8% (17) |
| Rhode Island: | 0.5% (847) |
| Cumberland Hill: | 1.7% (16) |
| Rhode Island: | 0.9% (1,351) |
| Cumberland Hill: | 1.7% (16) |
| Rhode Island: | 5.1% (8,042) |
Place of birth for U.S.-born residents:
- This state: 5,157
- Other state: 2,693
- Northeast: 2,179
- Midwest: 141
- South: 194
- West: 187
90.0% of Cumberland Hill residents lived in the same house 1 years ago.
Out of people who lived in different houses, 41.7% lived in this county.
Out of people who lived in different counties, 26.9% lived in Rhode Island.
| Cumberland Hill: | 90.0% |
| State average: | 89.3% |
Education attainment for males 25 years and older:
- No schooling: 123
- Nursery to 4th grade: 0
- 5th and 6th grade: 0
- 7th and 8th grade: 0
- 9th grade: 27
- 10th grade: 11
- 11th grade: 8
- 12th grade, no diploma: 50
- High school graduate (or equivalency): 387
- Less than 1 year of college: 151
- Some college more than 1 year, no degree: 509
- Associate degree: 253
- Bachelor's degree: 1,202
- Master's degree: 123
- Professional school degree: 127
- Doctorate degree: 0

Education attainment for females 25 years and older:
- No schooling: 98
- Nursery to 4th grade: 0
- 5th and 6th grade: 0
- 7th and 8th grade: 21
- 9th grade: 46
- 10th grade: 8
- 11th grade: 34
- 12th grade, no diploma: 52
- High school graduate (or equivalency): 637
- Less than 1 year of college: 200
- Some college more than 1 year, no degree: 677
- Associate degree: 194
- Bachelor's degree: 1,225
- Master's degree: 409
- Professional school degree: 0
- Doctorate degree: 34


Housing units in structures:
- One, detached: 2,563
- One, attached: 232
- Two: 126
- 3 or 4: 29
- 5 to 9: 124
- 10 to 19: 44
- 20 to 49: 106
- 50 or more: 156
House/condo owner moved in on average 15 years ago
Renter moved in on average 7 years ago

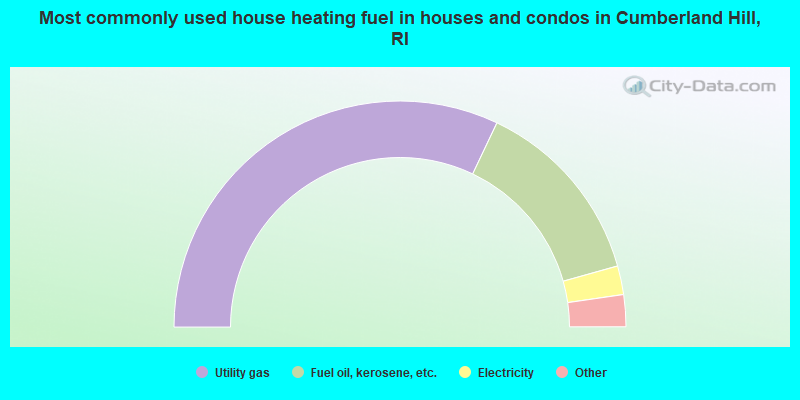
- 64.2%Utility gas
- 27.2%Fuel oil, kerosene, etc.
- 4.1%Electricity
- 2.1%Other fuel
- 1.9%Bottled, tank, or LP gas
- 0.6%Wood
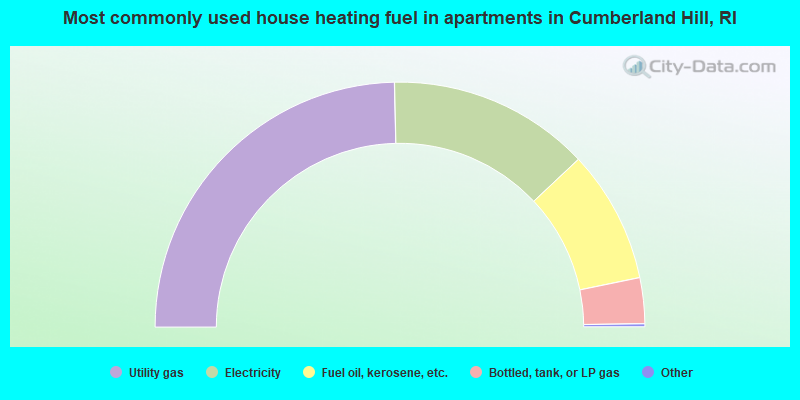
- 49.5%Utility gas
- 26.8%Electricity
- 17.6%Fuel oil, kerosene, etc.
- 6.1%Bottled, tank, or LP gas
Private vs. public school enrollment:
| Here: | 0.0% |
| Rhode Island: | 12.2% |
| Here: | 7.2% |
| Rhode Island: | 11.6% |
| Here: | 24.5% |
| Rhode Island: | 41.1% |


