Crystal Lake, IL (Illinois) Houses and Residents
Estimated median house or condo value in 2022: $292,940 (it was $165,700 in 2000 )
Crystal Lake:
$292,940Illinois:
$251,600
Lower value quartile - upper value quartile: $224,986 - $377,558Mean price in 2022: Detached houses: $300,726 Here:
$300,726State:
$310,164
Townhouses or other attached units: $220,145 Here:
$220,145State:
$286,230
In 2-unit structures: $245,378 Here:
$245,378State:
$299,638
In 3-to-4-unit structures: $157,820 Here:
$157,820State:
$330,907
In 5-or-more-unit structures: $112,876 Here:
$112,876State:
$318,887
Mobile homes: $91,297 Here:
$91,297State:
$78,855
Total population: 40,493 (Urban population: 37,691, Rural population: 145 (all nonfarm) )
Houses: 15,645 (14,954 occupied: 11,814 owner occupied, 3,320 renter occupied )
% of renters here:
22%State:
33%
Housing density: 963 houses/condos per square mile
Median price asked for vacant for-sale houses and condos in 2022: $225,479.
Median contract rent in 2022: $1,078 (lower quartile is $891, upper quartile is $1,382)
Median rent asked for vacant for-rent units in 2022: $1,683
Median gross rent in Crystal Lake, IL in 2022: $1,245
Housing units in Crystal Lake with a mortgage: 8,594 (737 second mortgage, 28 home equity loan, 604 both second mortgage and home equity loan )Houses without a mortgage: 145
Median household income for houses/condos with a mortgage: $119,124
Median household income for apartments without a mortgage: $95,737
Median monthly housing costs: $1,586
Data:
Median house or condo value ($)
Median house or condo value ($ change since 2000)
Median house or condo value ($) - White
Median house or condo value ($) - Black or African American
Median house or condo value ($) - Asian
Median house or condo value ($) - Hispanic or Latino
Median house or condo value ($) - American Indian and Alaska Native
Median house or condo value ($) - Multirace
Median house or condo value ($) - Other Race
Median price asked for mobile homes ($)
Household density (households per square mile)
Mean house or condo value by units in structure - 1, detached ($)
Mean house or condo value by units in structure - 1, attached ($)
Mean house or condo value by units in structure - 2 ($)
Mean house or condo value by units in structure by units in structure - 3 or 4 ($)
Mean house or condo value by units in structure - 5 or more ($)
Mean house or condo value by units in structure - Boat, RV, van, etc. ($)
Mean house or condo value by units in structure - Mobile home ($)
Median contract rent ($)
Median contract rent - Lower quartile ($)
Median contract rent - Upper quartile ($)
Median gross rent ($)
Urban houses (%)
Rural houses (%)
Houses occupied (%)
Houses occupied (% change since 2000)
Houses owner occupied (%)
Houses owner occupied (% change since 2000)
Houses renter occupied (%)
Houses renter occupied (% change since 2000)
Vacant housing units - For rent (%)
Vacant housing units - For rent (% change since 2000)
Vacant housing units - For sale only (%)
Vacant housing units - For sale only (% change since 2000)
Vacant housing units - Rented or sold, not occupied (%)
Vacant housing units - Rented or sold, not occupied (% change since 2000)
Vacant housing units - For seasonal, recreational, or occasional use (%)
Vacant housing units - For seasonal, recreational, or occasional use (% change since 2000)
Vacant housing units - For migrant workers (%)
Vacant housing units - For migrant workers (% change since 2000)
Vacant housing units - Other vacant (%)
Vacant housing units - Other vacant (% change since 2000)
Median monthly housing costs ($)
Median household income for houses/condos with a mortgage ($)
Median household income for houses/condos without a mortgage ($)
Median household income ($)
Median household income ($) - White
Median household income ($) - Black or African American
Median household income ($) - Asian
Median household income ($) - Hispanic or Latino
Median household income ($) - American Indian and Alaska Native
Median household income ($) - Multirace
Median household income ($) - Other Race
Mortgage status - with mortgage (%)
Mortgage status - with second mortgage (%)
Mortgage status - with home equity loan (%)
Mortgage status - with both second mortgage and home equity loan (%)
Mortgage status - without a mortgage (%)
Median year house/condo built
Median year apartment built
Household type by relationship - Male householder living alone (%)
Household type by relationship - Male householder not living alone (%)
Household type by relationship - Female householder living alone (%)
Household type by relationship - Female householder not living alone (%)
Household type by relationship - Opposite-Sex spouse (%)
Household type by relationship - Same-Sex spouse (%)
Household type by relationship - Opposite-Sex unmarried partner (%)
Household type by relationship - Same-Sex unmarried partner (%)
Household type by relationship - In group quarters (%)
Size of family households - 2-person household (%)
Size of family households - 3-person household (%)
Size of family households - 4-person household (%)
Size of family households - 5-person household (%)
Size of family households - 6-person household (%)
Size of family households - 7-or-more-person household (%)
Size of nonfamily households - 1-person household (%)
Size of nonfamily households - 2-person household (%)
Size of nonfamily households - 3-person household (%)
Size of nonfamily households - 4-person household (%)
Size of nonfamily households - 5-person household (%)
Size of nonfamily households - 6-person household (%)
Size of nonfamily households - 7-or-moreperson household (%)
Year house built - Built 2010 or later (%)
Year house built - Built 2000 to 2009 (%)
Year house built - Built 1990 to 1999 (%)
Year house built - Built 1980 to 1989 (%)
Year house built - Built 1970 to 1979 (%)
Year house built - Built 1960 to 1969 (%)
Year house built - Built 1950 to 1959 (%)
Year house built - Built 1940 to 1949 (%)
Year house built - Built 1939 or earlier (%)
Median number of rooms in houses and condos
Median number of rooms in apartments
Median number of bedrooms in owner occupied houses
Mean number of bedrooms in owner occupied houses
Median number of bedrooms in renter occupied houses
Mean number of bedrooms in renter occupied houses
Median number of vehichles in owner occupied houses
Mean number of vehichles in owner occupied houses
Median number of vehichles in renter occupied houses
Mean number of vehichles in renter occupied houses
Rooms in owner-occupied houses - 1 room (%)
Rooms in owner-occupied houses - 2 rooms (%)
Rooms in owner-occupied houses - 3 rooms (%)
Rooms in owner-occupied houses - 4 rooms (%)
Rooms in owner-occupied houses - 5 rooms (%)
Rooms in owner-occupied houses - 6 rooms (%)
Rooms in owner-occupied houses - 7 rooms (%)
Rooms in owner-occupied houses - 8 rooms (%)
Rooms in owner-occupied houses - 9+ rooms (%)
Rooms in renter-occupied houses - 1 room (%)
Rooms in renter-occupied houses - 2 rooms (%)
Rooms in renter-occupied houses - 3 rooms (%)
Rooms in renter-occupied houses - 4 rooms (%)
Rooms in renter-occupied houses - 5 rooms (%)
Rooms in renter-occupied houses - 6 rooms (%)
Rooms in renter-occupied houses - 7 rooms (%)
Rooms in renter-occupied houses - 8 rooms (%)
Rooms in renter-occupied houses - 9+ rooms (%)
Bedrooms in owner-occupied houses - no bedrooms (%)
Bedrooms in owner-occupied houses - 1 bedroom (%)
Bedrooms in owner-occupied houses - 2 bedrooms (%)
Bedrooms in owner-occupied houses - 3 bedrooms (%)
Bedrooms in owner-occupied houses - 4 bedrooms (%)
Bedrooms in owner-occupied houses - 5+ bedrooms (%)
Bedrooms in renter-occupied houses - no bedrooms (%)
Bedrooms in renter-occupied houses - 1 bedroom (%)
Bedrooms in renter-occupied houses - 2 bedrooms (%)
Bedrooms in renter-occupied houses - 3 bedrooms (%)
Bedrooms in renter-occupied houses - 4 bedrooms (%)
Bedrooms in renter-occupied houses - 5+ bedrooms (%)
Vehicles available in owner-occupied houses - no vehicle available (%)
Vehicles available in owner-occupied houses - 1 vehicle available(%)
Vehicles available in owner-occupied houses - 2 Vehicles available (%)
Vehicles available in owner-occupied houses - 3 Vehicles available (%)
Vehicles available in owner-occupied houses - 4 Vehicles available (%)
Vehicles available in owner-occupied houses - 5+ Vehicles available (%)
Vehicles available in renter-occupied houses - no vehicle available (%)
Vehicles available in renter-occupied houses - 1 vehicle available (%)
Vehicles available in renter-occupied houses - 2 Vehicles available (%)
Vehicles available in renter-occupied houses - 3 Vehicles available (%)
Vehicles available in renter-occupied houses - 4 Vehicles available (%)
Vehicles available in renter-occupied houses - 5+ Vehicles available (%)
Housing units in structures - 1, detached (%)
Housing units in structures - 1, attached (%)
Housing units in structures - 2 (%)
Housing units in structures - 3 or 4 (%)
Housing units in structures - 5 to 9 (%)
Housing units in structures - 10 to 19 (%)
Housing units in structures - 20 to 49 (%)
Housing units in structures - 50 or more (%)
Housing units in structures - Mobile home (%)
Housing units in structures - Boat, RV, van, etc. (%)
Housing units in structures - Owners - 1, detached (%)
Housing units in structures - Owners - 1, attached (%)
Housing units in structures - Owners - 2 (%)
Housing units in structures - Owners - 3 or 4 (%)
Housing units in structures - Owners - 5 to 9 (%)
Housing units in structures - Owners - 10 to 19 (%)
Housing units in structures - Owners - 20 to 49 (%)
Housing units in structures - Owners - 50 or more (%)
Housing units in structures - Owners - Mobile home (%)
Housing units in structures - Owners - Boat, RV, van, etc. (%)
Housing units in structures - Renters - 1, detached (%)
Housing units in structures - Renters - 1, attached (%)
Housing units in structures - Renters - 2 (%)
Housing units in structures - Renters - 3 or 4 (%)
Housing units in structures - Renters - 5 to 9 (%)
Housing units in structures - Renters - 10 to 19 (%)
Housing units in structures - Renters - 20 to 49 (%)
Housing units in structures - Renters - 50 or more (%)
Housing units in structures - Renters - Mobile home (%)
Housing units in structures - Renters - Boat, RV, van, etc. (%)
House/condo owner moved in on average (years ago)
Renter moved in on average (years ago)
Year householder moved into unit - Moved in 1999 to March 2000 (%)
Year householder moved into unit - Moved in 1999 to March 2000 (%) - White
Year householder moved into unit - Moved in 1999 to March 2000 (%) - Black or African American
Year householder moved into unit - Moved in 1999 to March 2000 (%) - Asian
Year householder moved into unit - Moved in 1999 to March 2000 (%) - Hispanic or Latino
Year householder moved into unit - Moved in 1999 to March 2000 (%) - American Indian and Alaska Native
Year householder moved into unit - Moved in 1999 to March 2000 (%) - Multirace
Year householder moved into unit - Moved in 1999 to March 2000 (%) - Other Race
Year householder moved into unit - Moved in 1995 to 1998 (%)
Year householder moved into unit - Moved in 1995 to 1998 (%) - White
Year householder moved into unit - Moved in 1995 to 1998 (%) - Black or African American
Year householder moved into unit - Moved in 1995 to 1998 (%) - Asian
Year householder moved into unit - Moved in 1995 to 1998 (%) - Hispanic or Latino
Year householder moved into unit - Moved in 1995 to 1998 (%) - American Indian and Alaska Native
Year householder moved into unit - Moved in 1995 to 1998 (%) - Multirace
Year householder moved into unit - Moved in 1995 to 1998 (%) - Other Race
Year householder moved into unit - Moved in 1990 to 1994 (%)
Year householder moved into unit - Moved in 1990 to 1994 (%) - White
Year householder moved into unit - Moved in 1990 to 1994 (%) - Black or African American
Year householder moved into unit - Moved in 1990 to 1994 (%) - Asian
Year householder moved into unit - Moved in 1990 to 1994 (%) - Hispanic or Latino
Year householder moved into unit - Moved in 1990 to 1994 (%) - American Indian and Alaska Native
Year householder moved into unit - Moved in 1990 to 1994 (%) - Multirace
Year householder moved into unit - Moved in 1990 to 1994 (%) - Other Race
Year householder moved into unit - Moved in 1980 to 1989 (%)
Year householder moved into unit - Moved in 1980 to 1989 (%) - White
Year householder moved into unit - Moved in 1980 to 1989 (%) - Black or African American
Year householder moved into unit - Moved in 1980 to 1989 (%) - Asian
Year householder moved into unit - Moved in 1980 to 1989 (%) - Hispanic or Latino
Year householder moved into unit - Moved in 1980 to 1989 (%) - American Indian and Alaska Native
Year householder moved into unit - Moved in 1980 to 1989 (%) - Multirace
Year householder moved into unit - Moved in 1980 to 1989 (%) - Other Race
Year householder moved into unit - Moved in 1970 to 1979 (%)
Year householder moved into unit - Moved in 1970 to 1979 (%) - White
Year householder moved into unit - Moved in 1970 to 1979 (%) - Black or African American
Year householder moved into unit - Moved in 1970 to 1979 (%) - Asian
Year householder moved into unit - Moved in 1970 to 1979 (%) - Hispanic or Latino
Year householder moved into unit - Moved in 1970 to 1979 (%) - American Indian and Alaska Native
Year householder moved into unit - Moved in 1970 to 1979 (%) - Multirace
Year householder moved into unit - Moved in 1970 to 1979 (%) - Other Race
Year householder moved into unit - Moved in 1969 or earlier (%)
Year householder moved into unit - Moved in 1969 or earlier (%) - White
Year householder moved into unit - Moved in 1969 or earlier (%) - Black or African American
Year householder moved into unit - Moved in 1969 or earlier (%) - Asian
Year householder moved into unit - Moved in 1969 or earlier (%) - Hispanic or Latino
Year householder moved into unit - Moved in 1969 or earlier (%) - American Indian and Alaska Native
Year householder moved into unit - Moved in 1969 or earlier (%) - Multirace
Year householder moved into unit - Moved in 1969 or earlier (%) - Other Race
Housing units lacking complete plumbing facilities (%)
Housing units lacking complete kitchen facilities (%)
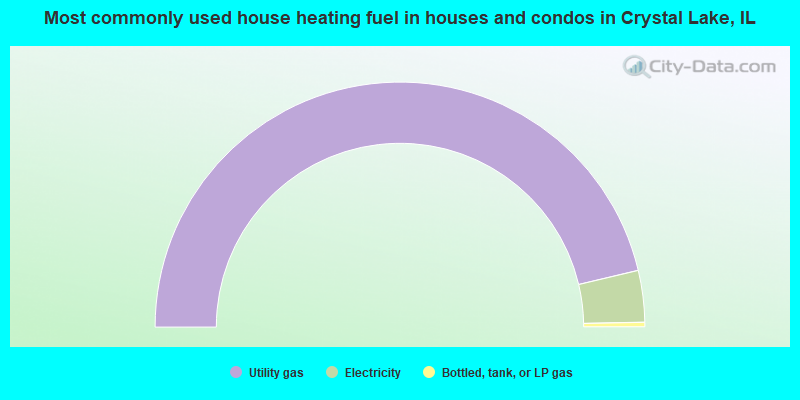
House heating fuel used in houses and condos - Utility gas (%)
House heating fuel used in houses and condos - Bottled, tank, or LP gas (%)
House heating fuel used in houses and condos - Electricity (%)
House heating fuel used in houses and condos - Fuel oil, kerosene, etc. (%)
House heating fuel used in houses and condos - Coal or coke (%)
House heating fuel used in houses and condos - Wood (%)
House heating fuel used in houses and condos - Solar energy (%)
House heating fuel used in houses and condos - Other fuel (%)
House heating fuel used in houses and condos - No fuel used (%)
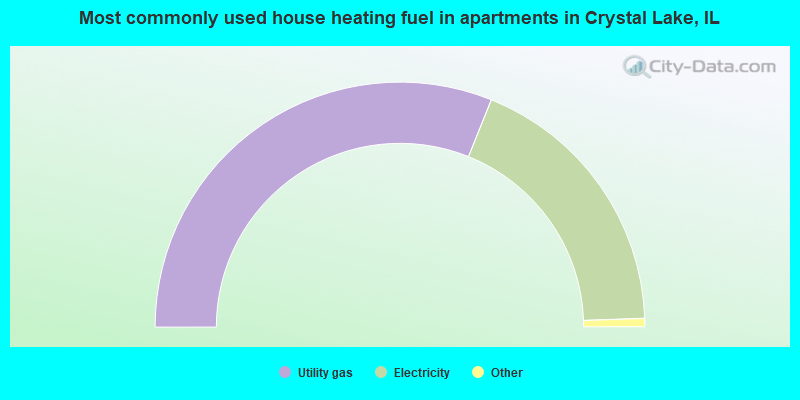
House heating fuel used in apartments - Utility gas (%)
House heating fuel used in apartments - Bottled, tank, or LP gas (%)
House heating fuel used in apartments - Electricity (%)
House heating fuel used in apartments - Fuel oil, kerosene, etc. (%)
House heating fuel used in apartments - Coal or coke (%)
House heating fuel used in apartments - Wood (%)
House heating fuel used in apartments - Solar energy (%)
House heating fuel used in apartments - Other fuel (%)
House heating fuel used in apartments - No fuel used (%)
Median year house/condo built: 1990Median year apartment built: 1981Household type by relationship:
Households: 40,542
Male householders: 7,268 (998 living alone ), Female householders: 7,534 (2,015 living alone )9,222 spouses (9,119 opposite-sex spouses ), 554 unmarried partners , (554 opposite-sex unmarried partners ), 13,461 children (12,911 natural , 108 adopted , 441 stepchildren ), 379 grandchildren , 345 brothers or sisters , 324 parents , 42 foster children , 334 other relatives , 693 non-relatives In group quarters: 381
Size of family households: 4,556 2-persons , 2,288 3-persons , 2,573 4-persons , 824 5-persons , 441 6-persons , 156 7-or-more-persons .
Size of nonfamily households: 3,468 1-person , 719 2-persons , 19 3-persons , 30 4-persons , 10 5-persons .
7,260 married couples with children. single-parent households (332 men , 1,123 women ).
86.5% of residents of Crystal Lake speak English at home. of residents speak Spanish at home (69% speak English very well , 18% speak English well , 10% speak English not well , 3% don't speak English at all ).of residents speak other Indo-European language at home (67% speak English very well , 23% speak English well , 6% speak English not well , 4% don't speak English at all ).of residents speak Asian or Pacific Island language at home (70% speak English very well , 10% speak English well , 11% speak English not well , 9% don't speak English at all ).of residents speak other language at home (35% speak English very well , 65% speak English well ).
Foreign born population: 4,045 (10.0%)of them are naturalized citizens )
Median number of rooms in houses and condos:
Median number of rooms in apartments
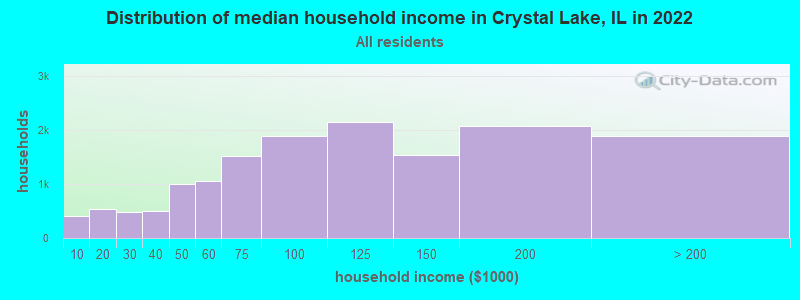
Crystal Lake, IL household income distribution 411 Less than $10,000531 $10,000 to $19,999476 $20,000 to $29,999504 $30,000 to $39,9991,006 $40,000 to $49,9991,060 $50,000 to $59,9991,516 $60,000 to $74,9991,886 $75,000 to $99,9992,148 $100,000 to $124,9991,546 $125,000 to $149,9992,081 $150,000 to $199,9991,884 $200,000 or more
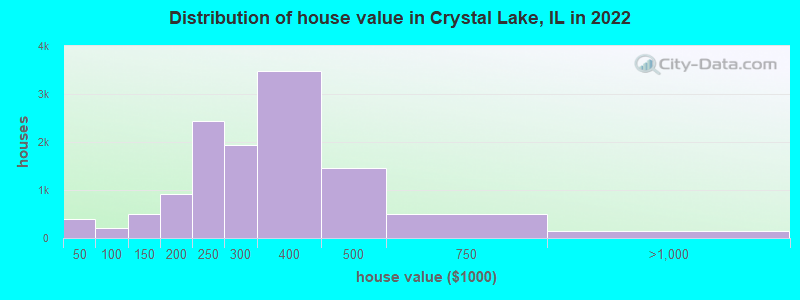
Home value of owner - occupied houses in 2022 in Crystal Lake, IL 111 Less than $10,00031 $10,000 to $14,999136 $15,000 to $19,99932 $20,000 to $24,99918 $25,000 to $29,99932 $30,000 to $34,99934 $40,000 to $49,99938 $50,000 to $59,9999 $60,000 to $69,99930 $70,000 to $79,99950 $80,000 to $89,99954 $90,000 to $99,999206 $100,000 to $124,999286 $125,000 to $149,999357 $150,000 to $174,999559 $175,000 to $199,9992,431 $200,000 to $249,9991,934 $250,000 to $299,9993,474 $300,000 to $399,9991,467 $400,000 to $499,999490 $500,000 to $749,999111 $750,000 to $999,99929 $1,000,000 to $1,499,9992 $1,500,000 to $1,999,999Rent paid by renters in 2022 in Crystal Lake, IL 47 $100 to $14926 $200 to $24916 $250 to $29921 $300 to $3497 $350 to $39937 $400 to $44964 $450 to $49925 $500 to $54943 $550 to $59913 $600 to $64942 $750 to $799256 $800 to $899257 $900 to $999722 $1,000 to $1,249642 $1,250 to $1,499677 $1,500 to $1,99999 $2,000 to $2,49941 $2,500 to $2,99961 $3,500 or more123 No cash rent
Percentage of workers working in this county: 63.8%Number of people working at home: 3,522 (16.4% of all workers )
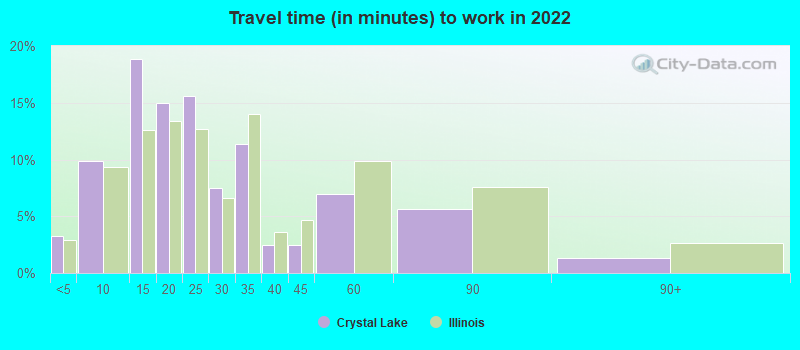
Travel time to work (commute)
Less than 5 minutes: 5705 to 9 minutes: 1,38910 to 14 minutes: 3,61915 to 19 minutes: 2,02020 to 24 minutes: 1,80025 to 29 minutes: 82630 to 34 minutes: 2,26635 to 39 minutes: 48140 to 44 minutes: 52345 to 59 minutes: 2,38660 to 89 minutes: 1,34290 or more minutes: 838
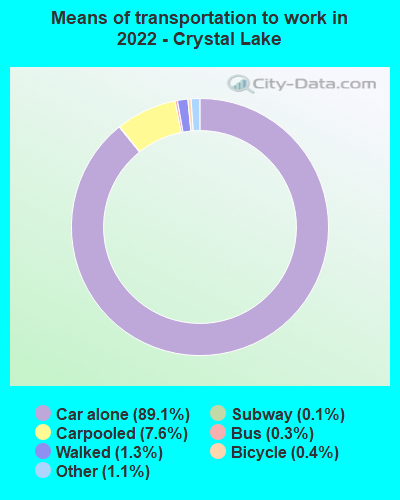
Means of transportation to work:
Drove a car alone: 19,069 (74.0%)Carpooled: 1,822 (7.1%)Bus : 65 (0.3%)Long-distance train or commuter rail : 16 (0.1%)Taxi: 358 (1.4%)Bicycle: 99 (0.4%)Walked: 294 (1.1%)Worked at home: 3,522 (13.7%)
Unemployment by race in 2022
Unemployment rate for White non-Hispanic residents 4.0% Males3.8% FemalesUnemployment rate for Black residents 7.4% Males25.6% FemalesUnemployment rate for American Indian and Alaska Native residents 13.8% FemalesUnemployment rate for Asian residents 7.7% Males2.7% FemalesUnemployment rate for two or more race residents 1.1% Males8.0% FemalesUnemployment rate for Hispanic or Latino residents 0.7% Males3.7% Females
Year of entry for the foreign-born population in Crystal Lake, Illinois
627 2010 or later 850 2000 to 2009 921 1990 to 1999 563 1980 to 1989 372 1970 to 1979 525 Before 1970
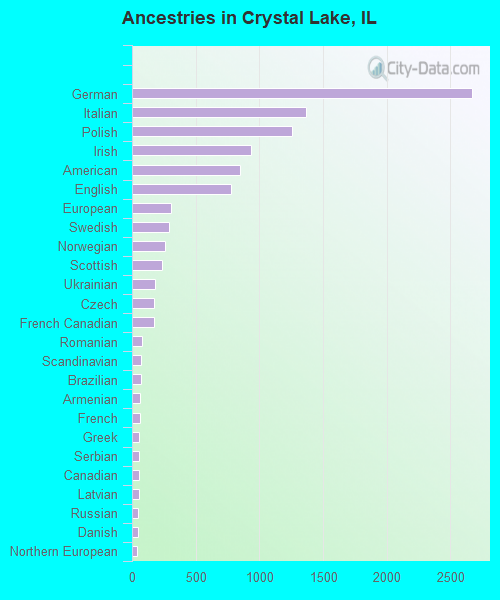
First ancestries reported:
German: 2,669 (18.3%)
Italian: 1,364 (9.4%)
Polish: 1,254 (8.6%)
Irish: 938 (6.4%)
American: 850 (5.8%)
English: 775 (5.3%)
European: 305 (2.1%)
Swedish: 289 (2.0%)
Norwegian: 261 (1.8%)
Scottish: 236 (1.6%)
Ukrainian: 182 (1.2%)
Czech: 173 (1.2%)
French Canadian: 170 (1.2%)
Romanian: 79 (0.5%)
Scandinavian: 72 (0.5%)
Brazilian: 68 (0.5%)
Armenian: 60 (0.4%)
French: 59 (0.4%)
Greek: 56 (0.4%)
Serbian: 55 (0.4%)
Canadian: 54 (0.4%)
Latvian: 54 (0.4%)
Russian: 49 (0.3%)
Danish: 47 (0.3%)
Northern European: 42 (0.3%)
Bulgarian: 41 (0.3%)
Hungarian: 40 (0.3%)
Welsh: 40 (0.3%)
Swiss: 39 (0.3%)
Eastern European: 39 (0.3%)
Croatian: 39 (0.3%)
Dutch: 30 (0.2%)
Belgian: 28 (0.2%)
Austrian: 25 (0.2%)
Lithuanian: 24 (0.2%)
Estonian: 23 (0.2%)
Scotch-Irish: 21 (0.1%)
Nigerian: 19 (0.1%)
Yugoslavian: 19 (0.1%)
Slovene: 17 (0.1%)
Slavic: 15 (0.1%)
British: 14 (0.10%)
Czechoslovakian: 13 (0.09%)
Lebanese: 11 (0.08%)
Finnish: 8 (0.05%)
Arab: 6 (0.04%)
Slovak: 3 (0.02%)
Most common places of birth for foreign-born residents (%): Mexico Crystal Lake:
28.7% (1,081)Illinois:
34.7% (626,958)
India Crystal Lake:
8.5% (320)Illinois:
9.2% (166,409)
Poland Crystal Lake:
6.7% (251)Illinois:
6.9% (124,474)
Philippines Crystal Lake:
6.6% (249)Illinois:
5.2% (93,003)
Colombia Crystal Lake:
5.9% (223)Illinois:
0.9% (16,553)
El Salvador Crystal Lake:
3.3% (123)Illinois:
0.6% (11,009)
Venezuela Crystal Lake:
3.1% (115)Illinois:
0.5% (9,688)
Germany Crystal Lake:
2.8% (106)Illinois:
1.0% (18,753)
Vietnam Crystal Lake:
2.7% (100)Illinois:
1.2% (22,269)
Other Eastern Europe Crystal Lake:
2.5% (93)Illinois:
0.5% (9,834)
China, excluding Hong Kong and Taiwan Crystal Lake:
2.2% (83)Illinois:
4.1% (74,364)
Ukraine Crystal Lake:
1.9% (73)Illinois:
1.6% (29,316)
Dominican Republic Crystal Lake:
1.9% (73)Illinois:
0.2% (3,867)
Chile Crystal Lake:
1.9% (72)Illinois:
0.1% (2,291)
Brazil Crystal Lake:
1.8% (66)Illinois:
0.5% (8,778)
Place of birth for U.S.-born residents:
This state: 29,883Other state: 6,360Northeast: 949Midwest: 3,502South: 997West: 916 92.4% of Crystal Lake residents lived in the same house 1 years ago.
Out of people who lived in different houses, 30.5% lived in this county.
Out of people who lived in different counties, 84.9% lived in Illinois.
Crystal Lake:
92.4%State average:
88.3%
Education attainment for males 25 years and older:
No schooling: 45Nursery to 4th grade: 2545th and 6th grade: 997th and 8th grade: 889th grade: 010th grade: 7411th grade: 3812th grade, no diploma: 296High school graduate (or equivalency): 3,267Less than 1 year of college: 807Some college more than 1 year, no degree: 1,950Associate degree: 1,104Bachelor's degree: 3,820Master's degree: 1,161Professional school degree: 205Doctorate degree: 276
Education attainment for females 25 years and older:
No schooling: 59Nursery to 4th grade: 155th and 6th grade: 157th and 8th grade: 319th grade: 7410th grade: 15111th grade: 4312th grade, no diploma: 113High school graduate (or equivalency): 3,176Less than 1 year of college: 1,060Some college more than 1 year, no degree: 2,241Associate degree: 1,408Bachelor's degree: 3,865Master's degree: 1,794Professional school degree: 136Doctorate degree: 55
Housing units in structures:
One, detached: 10,526One, attached: 1,664Two: 2363 or 4: 5415 to 9: 1,47310 to 19: 33020 to 49: 27750 or more: 317Mobile homes: 265Boats, RVs, vans, etc.: 11Median worth of mobile homes: $99,689
Housing units lacking complete plumbing facilities in 2022: 0.3%Housing units lacking complete kitchen facilities in 2022: 2.3%House/condo owner moved in on average 13 years ago
Renter moved in on average 5 years ago
Private vs. public school enrollment:
Students in private schools in grades 1 to 8 (elementary and middle school): 162 Students in private schools in grades 9 to 12 (high school): 74 Students in private undergraduate colleges: 534