Country Club Hills, IL (Illinois) Houses and Residents
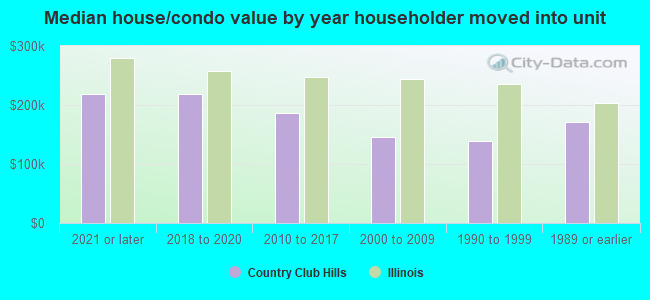
| Country Club Hills: | $167,684 |
| Illinois: | $251,600 |
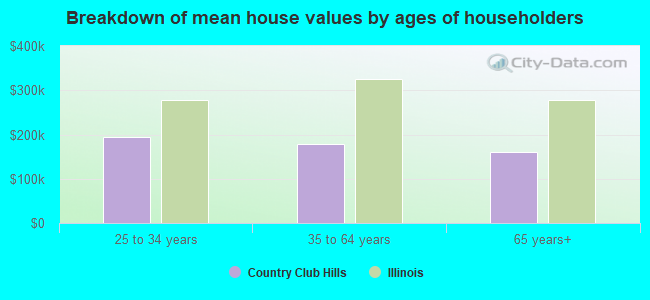
Mean price in 2022:
Detached houses: $197,805
Here: $197,805 State: $310,164 Townhouses or other attached units: $115,883
Here: $115,883 State: $286,230 In 3-to-4-unit structures: $142,742
Here: $142,742 State: $330,907 In 5-or-more-unit structures: $120,954
Here: $120,954 State: $318,887
Total population: 16,865 (Urban population: 16,202, Rural population: 0)
Houses: 6,006 (5,555 occupied: 4,450 owner occupied, 1,200 renter occupied)
| % of renters here: | 21% |
| State: | 33% |
Housing density: 1,302 houses/condos per square mile
Median price asked for vacant for-sale houses and condos in 2022: $164,701.
Median contract rent in 2022: $1,252 (lower quartile is $843, upper quartile is $1,802)
Median rent asked for vacant for-rent units in 2022: $984
Median gross rent in Country Club Hills, IL in 2022: $1,621
Housing units in Country Club Hills with a mortgage: 3,355 (135 second mortgage, 0 home equity loan, 110 both second mortgage and home equity loan)
Houses without a mortgage: 30
Median household income for houses/condos with a mortgage: $73,577
Median household income for apartments without a mortgage: $94,300
Median monthly housing costs: $1,359
Compare current foreclosures in Country Club Hills, IL:
| Photo | Address | Area | Beds / Baths | Price | Details |
|---|---|---|---|---|---|

|
#1
Idlewild Dr
Country Club Hills, IL 60478
|
1,300 sq. feet
|
1 baths 3 beds |
$279,900
|
show details |

|
#2
Castle Dargan D
Country Club Hills, IL 60478
|
3,998 sq. feet
|
2 baths 4 beds |
show details | |

|
#3
176th Pl
Country Club Hills, IL 60478
|
2,484 sq. feet
|
1 baths 3 beds |
show details | |

|
#4
177th St
Country Club Hills, IL 60478
|
839 sq. feet
|
2 baths 4 beds |
show details | |

|
#5
Maple Ave
Country Club Hills, IL 60478
|
2,698 sq. feet
|
2 baths 4 beds |
show details | |

|
#6
176th St
Country Club Hills, IL 60478
|
1,245 sq. feet
|
2 baths 4 beds |
show details | |

|
#7
187th St
Country Club Hills, IL 60478
|
2,296 sq. feet
|
2 baths 4 beds |
show details | |

|
#8
Provincetown Dr
Country Club Hills, IL 60478
|
1,306 sq. feet
|
1 baths - beds |
show details | |

|
#9
189th St
Country Club Hills, IL 60478
|
1,687 sq. feet
|
2 baths - beds |
show details | |

|
#10
Windsor Ln
Country Club Hills, IL 60478
|
1,180 sq. feet
|
1 baths - beds |
show details |
| Photo | Address | Area | Beds / Baths | Price | Details |
|---|---|---|---|---|---|

|
#11
Castle Dargan Dr
Country Club Hills, IL 60478
|
3,998 sq. feet
|
2 baths - beds |
show details | |

|
#12
Ravisloe Ter
Country Club Hills, IL 60478
|
1,150 sq. feet
|
1 baths - beds |
show details | |

|
#13
Hawthorne Dr
Country Club Hills, IL 60478
|
1,229 sq. feet
|
2 baths - beds |
show details | |

|
#14
187th Pl
Country Club Hills, IL 60478
|
2,084 sq. feet
|
2 baths - beds |
show details | |

|
#15
Eastgate Dr
Country Club Hills, IL 60478
|
1,118 sq. feet
|
1 baths - beds |
show details | |

|
#16
183rd St
Country Club Hills, IL 60478
|
2,628 sq. feet
|
2 baths - beds |
show details | |

|
#17
Idlewild Dr
Country Club Hills, IL 60478
|
1,243 sq. feet
|
2 baths - beds |
show details | |

|
#18
Dartry Dr
Country Club Hills, IL 60478
|
4,266 sq. feet
|
2 baths - beds |
show details | |

|
#19
Chestnut Ave
Country Club Hills, IL 60478
|
1,248 sq. feet
|
1 baths - beds |
show details | |

|
#20
Indian Hill Dr
Country Club Hills, IL 60478
|
1,320 sq. feet
|
1 baths - beds |
show details |
| Photo | Address | Area | Beds / Baths | Price | Details |
|---|---|---|---|---|---|

|
#21
176th Pl
Country Club Hills, IL 60478
|
1,245 sq. feet
|
2 baths - beds |
show details | |

|
#22
176th Pl
Country Club Hills, IL 60478
|
1,239 sq. feet
|
2 baths - beds |
show details | |

|
#23
169th St
Country Club Hills, IL 60478
|
1,470 sq. feet
|
1 baths - beds |
show details | |

|
#24
179th St
Country Club Hills, IL 60478
|
1,555 sq. feet
|
2 baths - beds |
show details | |

|
#25
Loretto Ln
Country Club Hills, IL 60478
|
1,170 sq. feet
|
1 baths - beds |
show details | |

|
#26
Nightengale Ter
Country Club Hills, IL 60478
|
2,046 sq. feet
|
2 baths - beds |
show details | |

|
#27
Cypress Ave
Country Club Hills, IL 60478
|
1,288 sq. feet
|
1 baths - beds |
show details | |

|
#28
186th Pl
Country Club Hills, IL 60478
|
1,256 sq. feet
|
1 baths - beds |
show details | |

|
#29
185th St
Country Club Hills, IL 60478
|
1,100 sq. feet
|
1 baths - beds |
show details | |

|
#30
Willow Ave
Country Club Hills, IL 60478
|
1,061 sq. feet
|
2 baths - beds |
show details |
| Photo | Address | Area | Beds / Baths | Price | Details |
|---|---|---|---|---|---|

|
#31
179th Pl
Country Club Hills, IL 60478
|
1,620 sq. feet
|
2 baths - beds |
show details | |

|
#32
Kostner Ave
Country Club Hills, IL 60478
|
1,462 sq. feet
|
2 baths - beds |
show details | |

|
#33
168th Pl
Country Club Hills, IL 60478
|
1,632 sq. feet
|
1 baths - beds |
show details | |

|
#34
Apple Tree Dr
Country Club Hills, IL 60478
|
960 sq. feet
|
1 baths - beds |
show details | |

|
#35
176th Pl
Country Club Hills, IL 60478
|
1,314 sq. feet
|
1 baths - beds |
show details | |

|
#36
Juneway Ct
Country Club Hills, IL 60478
|
1,128 sq. feet
|
2 baths - beds |
show details | |

|
#37
Winston Dr
Country Club Hills, IL 60478
|
1,248 sq. feet
|
1 baths - beds |
show details | |

|
#38
Hillcrest Dr
Country Club Hills, IL 60478
|
2,329 sq. feet
|
2 baths - beds |
show details | |

|
#39
Windsor Ln
Country Club Hills, IL 60478
|
1,704 sq. feet
|
2 baths - beds |
show details | |

|
#40
168th St
Country Club Hills, IL 60478
|
1,026 sq. feet
|
1 baths - beds |
show details |
| Photo | Address | Area | Beds / Baths | Price | Details |
|---|---|---|---|---|---|

|
#41
Ravisloe Ter
Country Club Hills, IL 60478
|
2,751 sq. feet
|
2 baths - beds |
show details | |

|
#42
177th St
Country Club Hills, IL 60478
|
1,136 sq. feet
|
1 baths - beds |
show details | |

|
#43
Greenview Ter
Country Club Hills, IL 60478
|
1,163 sq. feet
|
1 baths - beds |
show details | |

|
#44
Pheasant Ln
Country Club Hills, IL 60478
|
1,194 sq. feet
|
1 baths - beds |
show details | |

|
#45
178th Pl
Country Club Hills, IL 60478
|
900 sq. feet
|
1 baths - beds |
show details | |

|
#46
Springfield Ave
Country Club Hills, IL 60478
|
1,064 sq. feet
|
1 baths - beds |
show details | |

|
#47
168th Pl
Country Club Hills, IL 60478
|
1,187 sq. feet
|
2 baths - beds |
show details | |

|
#48
Maple Ave
Country Club Hills, IL 60478
|
3,065 sq. feet
|
3 baths - beds |
show details | |

|
#49
Thomas Ln
Country Club Hills, IL 60478
|
1,225 sq. feet
|
1 baths - beds |
show details | |

|
Check over 1 million property listings on Foreclosure.com!
|
browse all offers | |||


 | Country Club Hills (6 replies) |
| Demos of Flossmoor, Homewood, and Country Club Hills (31 replies) |
| Moving to the Homewood/Flossmoor area (59 replies) |
| President Preckwinkle Approve Housing Project in Country Club Hills (24 replies) |
| Country Club Hills? (5 replies) |
| Property Taxes and Population Decline in IL (65 replies) |

Median year apartment built: 1981
Household type by relationship:
Households: 16,209- Male householders: 1,980 (685 living alone), Female householders: 3,428 (889 living alone)
1,796 spouses (1,796 opposite-sex spouses), 415 unmarried partners, (415 opposite-sex unmarried partners), 5,381 children (5,155 natural, 13 adopted, 212 stepchildren), 1,684 grandchildren, 340 brothers or sisters, 204 parents, 0 foster children, 280 other relatives, 443 non-relatives
- In group quarters: 253
Size of family households: 1,368 2-persons, 791 3-persons, 787 4-persons, 400 5-persons, 152 6-persons, 124 7-or-more-persons.
Size of nonfamily households: 1,692 1-person, 252 2-persons, 46 3-persons, 5 4-persons.
978 married couples with children.
1,308 single-parent households (180 men, 1,128 women).
94.7% of residents of Country Club Hills speak English at home.
2.0% of residents speak Spanish at home (61% speak English very well, 16% speak English well, 22% speak English not well).
0.9% of residents speak other Indo-European language at home (72% speak English very well, 17% speak English well, 10% speak English not well).
0.8% of residents speak Asian or Pacific Island language at home (42% speak English very well, 57% speak English not well).
0.6% of residents speak other language at home (82% speak English very well, 18% speak English well).
Foreign born population: 786 (4.8%)
(68.8% of them are naturalized citizens)
| Here: | 6.5 |
| State: | 6.4 |
| Here: | 5.7 |
| State: | 4.1 |
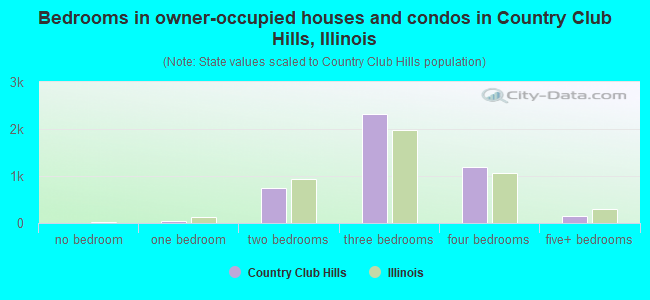
- Bedrooms in owner-occupied houses and condos in Country Club Hills, Illinois
- 0no bedroom
- 401 bedroom
- 7422 bedrooms
- 2,3233 bedrooms
- 1,2004 bedrooms
- 1465+ bedrooms
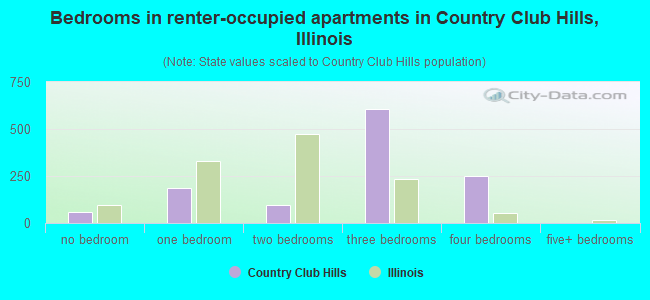
- Bedrooms in renter-occupied apartments in Country Club Hills, Illinois
- 56no bedroom
- 1881 bedroom
- 952 bedrooms
- 6093 bedrooms
- 2524 bedrooms
- 05+ bedrooms
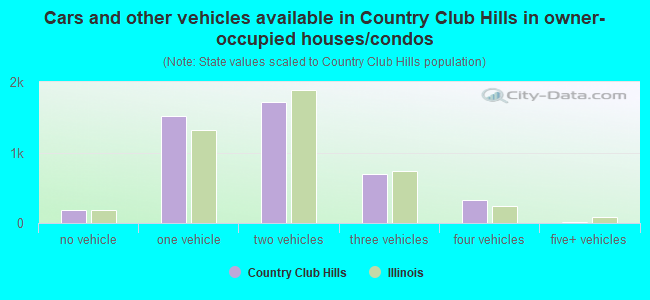
- Cars and other vehicles available in Country Club Hills in owner-occupied houses/condos
- 188no vehicle
- 1,5111 vehicle
- 1,7142 vehicles
- 6963 vehicles
- 3234 vehicles
- 195+ vehicles
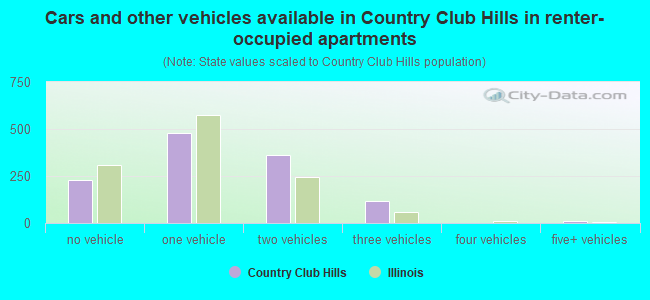
- Cars and other vehicles available in Country Club Hills in renter-occupied apartments
- 228no vehicle
- 4801 vehicle
- 3642 vehicles
- 1163 vehicles
- 04 vehicles
- 125+ vehicles
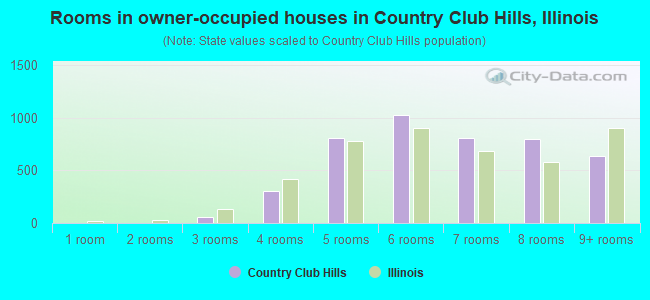
- Rooms in owner-occupied houses in Country Club Hills, Illinois
- 01 room
- 02 rooms
- 573 rooms
- 3054 rooms
- 8125 rooms
- 1,0296 rooms
- 8067 rooms
- 7998 rooms
- 6429+ rooms
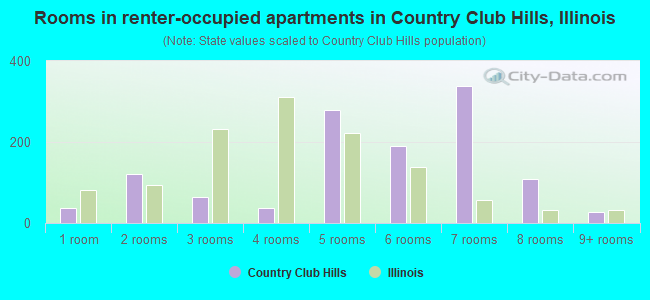
- Rooms in renter-occupied apartments in Country Club Hills, Illinois
- 361 room
- 1202 rooms
- 653 rooms
- 384 rooms
- 2795 rooms
- 1906 rooms
- 3387 rooms
- 1098 rooms
- 269+ rooms
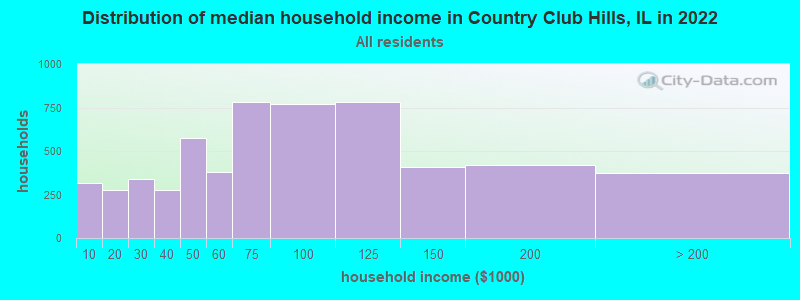
Country Club Hills, IL household income distribution

- 316Less than $10,000
- 275$10,000 to $19,999
- 341$20,000 to $29,999
- 274$30,000 to $39,999
- 577$40,000 to $49,999
- 381$50,000 to $59,999
- 779$60,000 to $74,999
- 771$75,000 to $99,999
- 784$100,000 to $124,999
- 406$125,000 to $149,999
- 419$150,000 to $199,999
- 373$200,000 or more
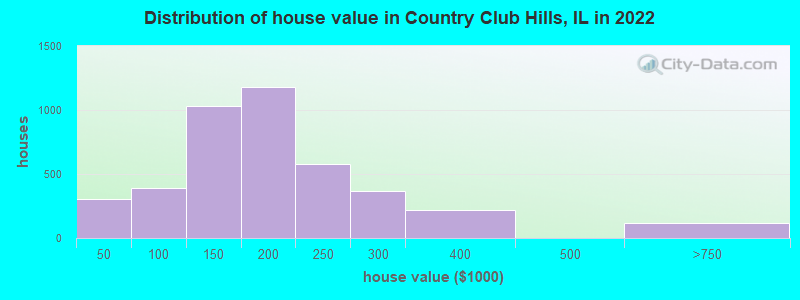
Home value of owner - occupied houses in 2022 in Country Club Hills, IL
-
- 203Less than $10,000
- 19$10,000 to $14,999
- 40$15,000 to $19,999
- 14$25,000 to $29,999
- 11$30,000 to $34,999
- 11$40,000 to $49,999
- 19$50,000 to $59,999
- 52$60,000 to $69,999
- 72$70,000 to $79,999
- 147$80,000 to $89,999
- 89$90,000 to $99,999
- 508$100,000 to $124,999
- 523$125,000 to $149,999
- 574$150,000 to $174,999
- 601$175,000 to $199,999
- 575$200,000 to $249,999
- 366$250,000 to $299,999
- 214$300,000 to $399,999
- 96$500,000 to $749,999
- 8$750,000 to $999,999
- 10$1,500,000 to $1,999,999
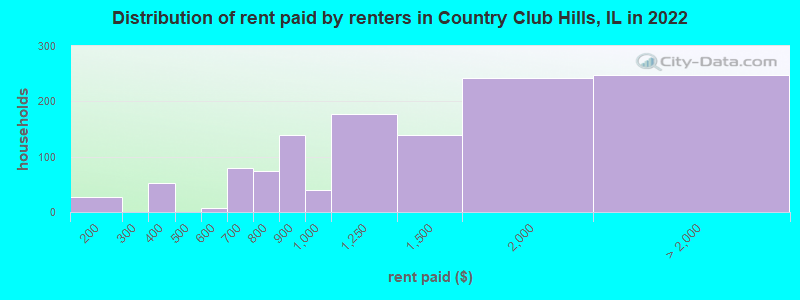
Rent paid by renters in 2022 in Country Club Hills, IL
-
- 14$100 to $149
- 13$150 to $199
- 52$350 to $399
- 7$500 to $549
- 33$600 to $649
- 45$650 to $699
- 13$700 to $749
- 60$750 to $799
- 140$800 to $899
- 39$900 to $999
- 178$1,000 to $1,249
- 139$1,250 to $1,499
- 241$1,500 to $1,999
- 152$2,000 to $2,499
- 26$2,500 to $2,999
- 67No cash rent
Percentage of workers working in this county: 82.7%
Number of people working at home: 1,134 (15.4% of all workers)
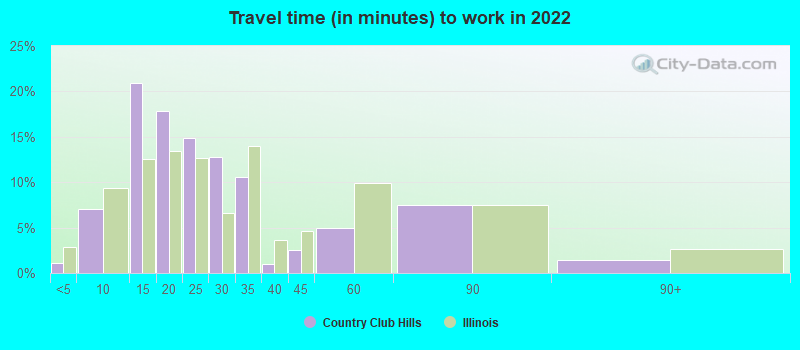
Travel time to work (commute)
- Less than 5 minutes: 24
- 5 to 9 minutes: 229
- 10 to 14 minutes: 709
- 15 to 19 minutes: 393
- 20 to 24 minutes: 1,053
- 25 to 29 minutes: 298
- 30 to 34 minutes: 1,078
- 35 to 39 minutes: 203
- 40 to 44 minutes: 299
- 45 to 59 minutes: 802
- 60 to 89 minutes: 828
- 90 or more minutes: 183
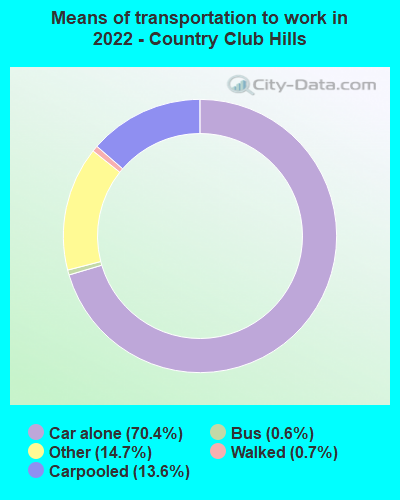
Means of transportation to work:
- Drove a car alone: 1,279 (47.2%)
- Carpooled: 264 (9.7%)
- Bus: 10 (0.4%)
- Taxi: 269 (9.9%)
- Walked: 12 (0.4%)
- Worked at home: 1,134 (41.9%)
- Unemployment by race in 2022
- Unemployment rate for White non-Hispanic residents
- 19.0%Males
- Unemployment rate for Black residents
- 3.9%Males
- 7.9%Females
- Unemployment rate for Asian residents
- 24.9%Males
- Unemployment rate for two or more race residents
- 62.7%Males
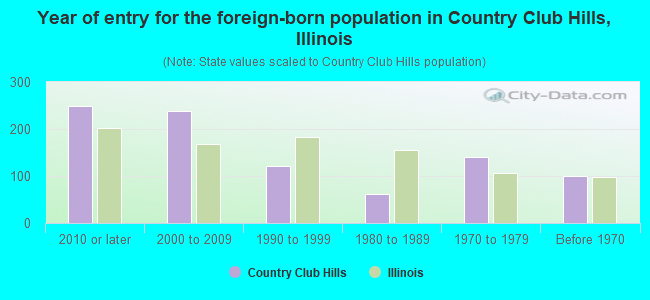
- Year of entry for the foreign-born population in Country Club Hills, Illinois
- 2482010 or later
- 2392000 to 2009
- 1211990 to 1999
- 621980 to 1989
- 1411970 to 1979
- 101Before 1970
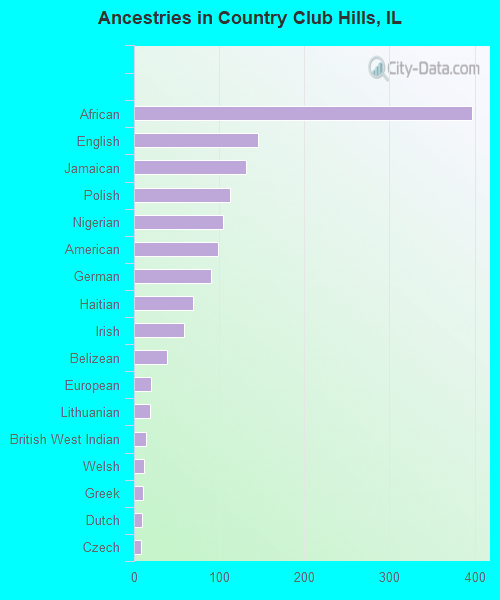
First ancestries reported:
- African: 397 (3.3%)
- English: 146 (1.2%)
- Jamaican: 132 (1.1%)
- Polish: 113 (0.9%)
- Nigerian: 104 (0.9%)
- American: 99 (0.8%)
- German: 91 (0.8%)
- Haitian: 69 (0.6%)
- Irish: 59 (0.5%)
- Belizean: 39 (0.3%)
- European: 20 (0.2%)
- Lithuanian: 19 (0.2%)
- British West Indian: 14 (0.1%)
- Welsh: 12 (0.1%)
- Greek: 10 (0.08%)
- Dutch: 9 (0.08%)
- Czech: 8 (0.07%)
- Bulgarian: 3 (0.03%)
Most common places of birth for foreign-born residents (%):
| Country Club Hills: | 21.2% (167) |
| Illinois: | 1.2% (21,186) |
| Country Club Hills: | 14.8% (116) |
| Illinois: | 34.7% (626,958) |
| Country Club Hills: | 14.4% (113) |
| Illinois: | 0.1% (1,549) |
| Country Club Hills: | 12.3% (97) |
| Illinois: | 5.2% (93,003) |
| Country Club Hills: | 10.1% (79) |
| Illinois: | 9.2% (166,409) |
| Country Club Hills: | 9.4% (74) |
| Illinois: | 0.3% (4,639) |
| Country Club Hills: | 7.1% (56) |
| Illinois: | 0.5% (8,168) |
| Country Club Hills: | 4.6% (36) |
| Illinois: | 0.3% (4,533) |
| Country Club Hills: | 3.3% (26) |
| Illinois: | 1.1% (19,306) |
| Country Club Hills: | 2.3% (18) |
| Illinois: | 0.1% (2,269) |
| Country Club Hills: | 2.0% (16) |
| Illinois: | 0.1% (1,861) |
| Country Club Hills: | 1.5% (12) |
| Illinois: | 4.1% (74,364) |
| Country Club Hills: | 1.5% (12) |
| Illinois: | 0.6% (10,720) |
Place of birth for U.S.-born residents:
- This state: 13,448
- Other state: 1,873
- Northeast: 67
- Midwest: 445
- South: 1,237
- West: 79
95.0% of Country Club Hills residents lived in the same house 1 years ago.
Out of people who lived in different houses, 44.6% lived in this county.
Out of people who lived in different counties, 100.0% lived in Illinois.
| Country Club Hills: | 95.0% |
| State average: | 88.3% |
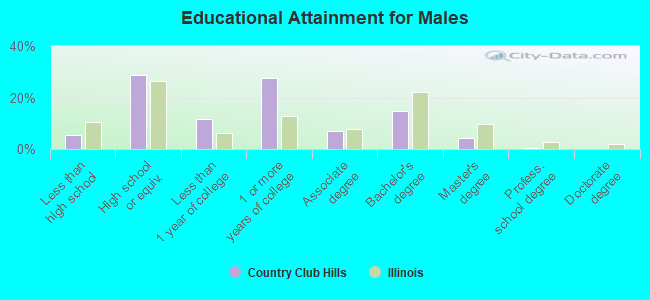
Education attainment for males 25 years and older:
- No schooling: 24
- Nursery to 4th grade: 4
- 5th and 6th grade: 0
- 7th and 8th grade: 86
- 9th grade: 0
- 10th grade: 18
- 11th grade: 45
- 12th grade, no diploma: 68
- High school graduate (or equivalency): 1,320
- Less than 1 year of college: 527
- Some college more than 1 year, no degree: 1,263
- Associate degree: 320
- Bachelor's degree: 675
- Master's degree: 193
- Professional school degree: 25
- Doctorate degree: 2
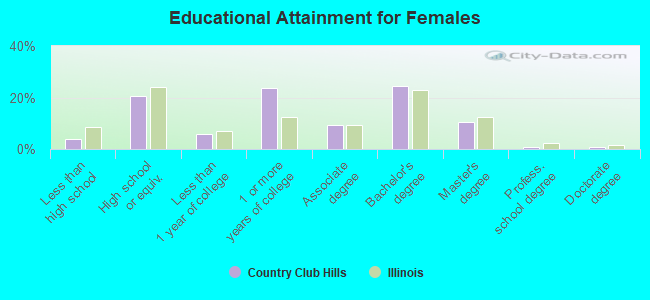
Education attainment for females 25 years and older:
- No schooling: 16
- Nursery to 4th grade: 2
- 5th and 6th grade: 34
- 7th and 8th grade: 36
- 9th grade: 0
- 10th grade: 19
- 11th grade: 75
- 12th grade, no diploma: 72
- High school graduate (or equivalency): 1,311
- Less than 1 year of college: 374
- Some college more than 1 year, no degree: 1,513
- Associate degree: 582
- Bachelor's degree: 1,554
- Master's degree: 655
- Professional school degree: 48
- Doctorate degree: 60


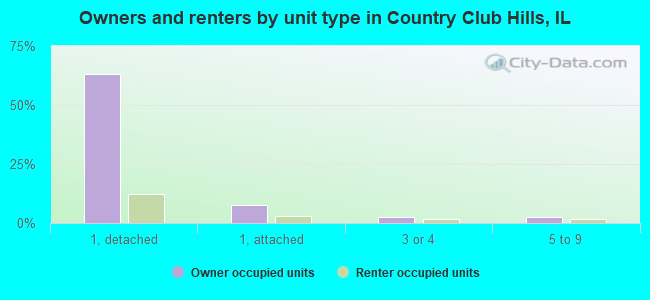
Housing units in structures:
- One, detached: 4,354
- One, attached: 956
- Two: 66
- 3 or 4: 213
- 5 to 9: 51
- 10 to 19: 122
- 20 to 49: 54
- 50 or more: 187
Housing units lacking complete kitchen facilities in 2022: 6.1%
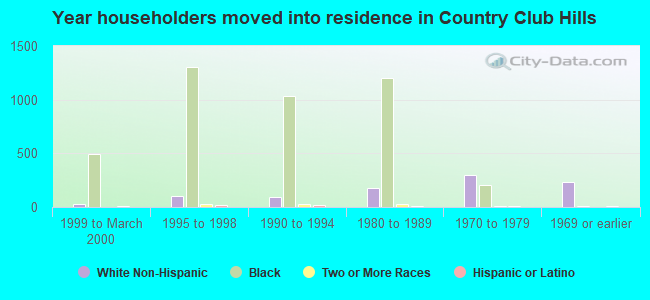
House/condo owner moved in on average 17 years ago
Renter moved in on average 3 years ago
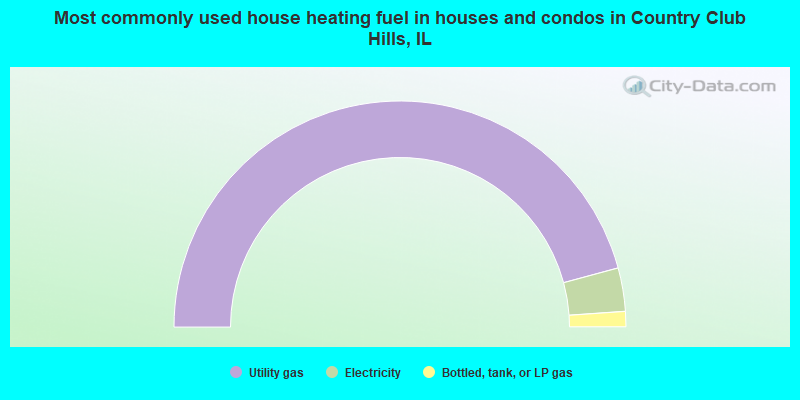
- 91.6%Utility gas
- 6.2%Electricity
- 2.2%Bottled, tank, or LP gas
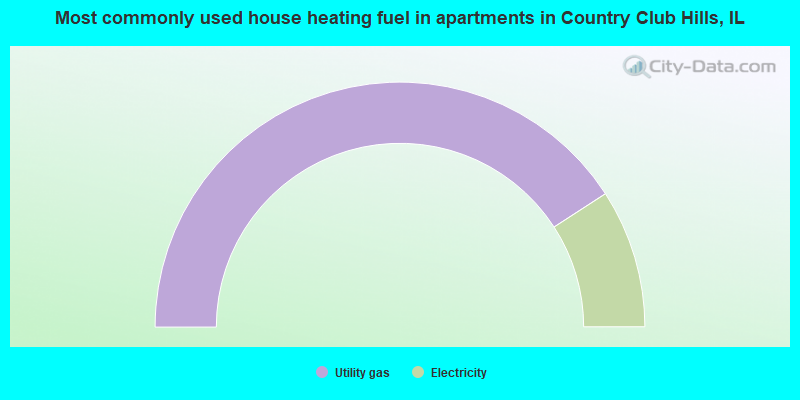
- 81.7%Utility gas
- 18.3%Electricity
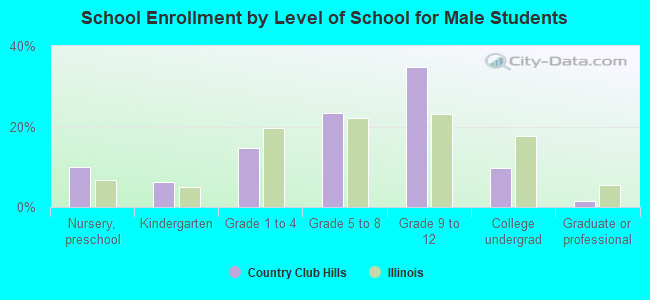
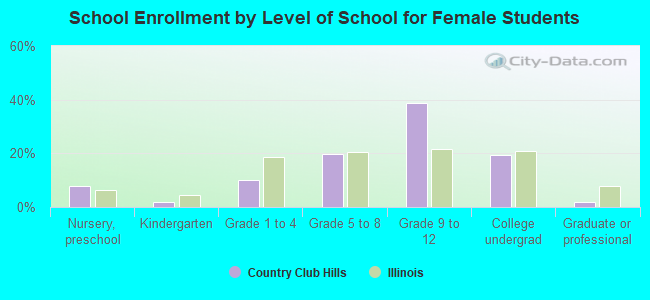
Private vs. public school enrollment:
| Here: | 18.0% |
| Illinois: | 13.3% |
| Here: | 11.6% |
| Illinois: | 9.9% |
| Here: | 24.9% |
| Illinois: | 27.4% |