Housing density: 1,299 houses/condos per square mile
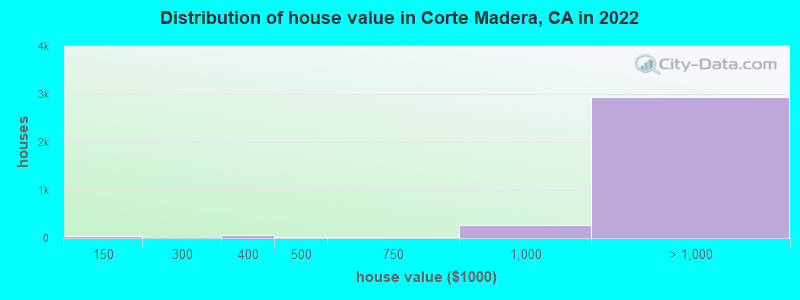
Median price asked for vacant for-sale houses and condos in 2022 in this county: $3,364,178.
Median contract rent in 2022: over $2,000 (lower quartile is over $2,000, upper quartile is over $2,000)
Median rent asked for vacant for-rent units in 2022: $2,595
Median gross rent in Corte Madera, CA in 2022: over $2,000
Housing units in Corte Madera with a mortgage: 2,004 (289 second mortgage, 39 home equity loan, 227 both second mortgage and home equity loan) Houses without a mortgage: 42
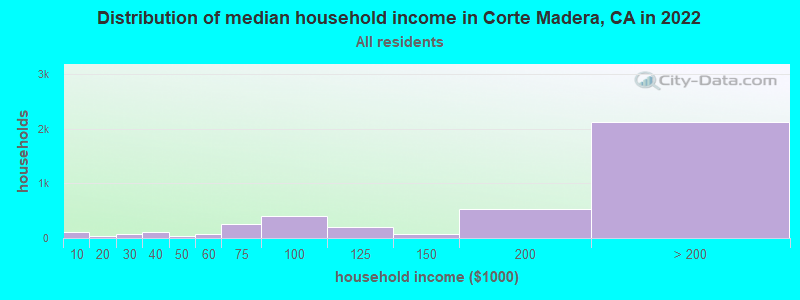
Median household income for houses/condos with a mortgage: $263,303
Median household income for apartments without a mortgage: $102,972
Median monthly housing costs: $3,652
Compare current foreclosures near Corte Madera, CA:
Size of family households: 1,274 2-persons, 813 3-persons, 722 4-persons, 109 5-persons.
Size of nonfamily households: 966 1-person, 148 2-persons.
1,997 married couples with children.
485 single-parent households (139 men, 346 women).
86.8% of residents of Corte Madera speak English at home.
4.1% of residents speak Spanish at home (94% speak English very well, 6% speak English well).
5.4% of residents speak other Indo-European language at home (79% speak English very well, 18% speak English well, 3% speak English not well).
3.2% of residents speak Asian or Pacific Island language at home (59% speak English very well, 33% speak English well, 8% speak English not well).
Foreign born population: 1,112 (11.1%)
(65.6% of them are naturalized citizens)
Percentage of workers working in this county: 65.7% Number of people working at home: 2,364 (51.9% of all workers)
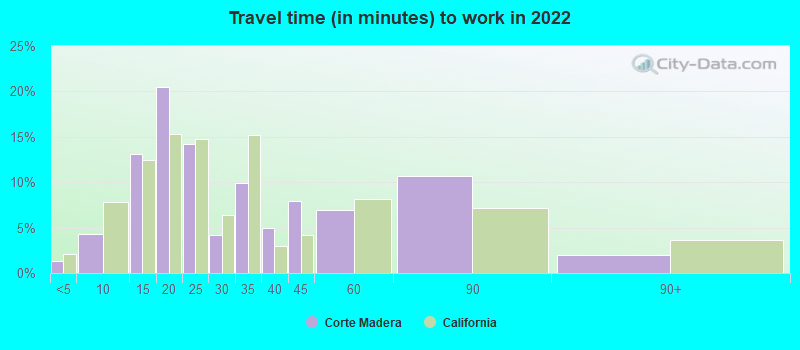
Travel time to work (commute)
Less than 5 minutes: 60
5 to 9 minutes: 44
10 to 14 minutes: 256
15 to 19 minutes: 376
20 to 24 minutes: 129
25 to 29 minutes: 161
30 to 34 minutes: 468
35 to 39 minutes: 30
40 to 44 minutes: 336
45 to 59 minutes: 218
60 to 89 minutes: 260
90 or more minutes: 114
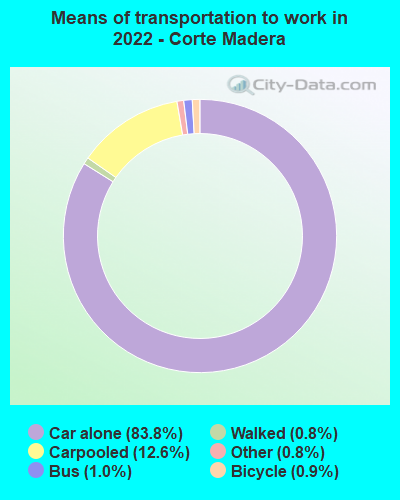
Means of transportation to work:
Drove a car alone: 4,268 (55.9%)
Carpooled: 613 (8.0%)
Bus: 69 (0.9%)
Taxi: 74 (1.0%)
Bicycle: 89 (1.2%)
Walked: 55 (0.7%)
Worked at home: 2,364 (31.0%)
Unemployment by race in 2022
Unemployment rate for White non-Hispanic residents
5.1%Males
3.3%Females
Unemployment rate for Black residents
62.1%Males
Unemployment rate for two or more race residents
4.2%Males
Year of entry for the foreign-born population in Corte Madera, California
2692010 or later
1372000 to 2009
2631990 to 1999
3051980 to 1989
1871970 to 1979
521Before 1970
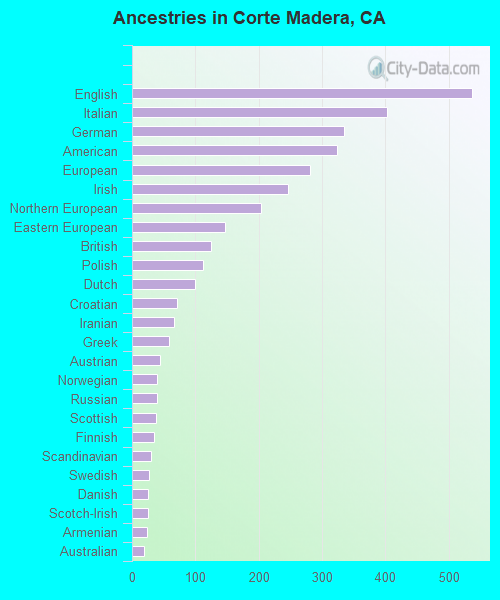
First ancestries reported:
English: 537 (12.3%)
Italian: 402 (9.2%)
German: 335 (7.7%)
American: 323 (7.4%)
European: 281 (6.4%)
Irish: 246 (5.6%)
Northern European: 203 (4.6%)
Eastern European: 147 (3.4%)
British: 124 (2.8%)
Polish: 112 (2.6%)
Dutch: 99 (2.3%)
Croatian: 71 (1.6%)
Iranian: 67 (1.5%)
Greek: 58 (1.3%)
Austrian: 44 (1.0%)
Norwegian: 40 (0.9%)
Russian: 39 (0.9%)
Scottish: 38 (0.9%)
Finnish: 35 (0.8%)
Scandinavian: 30 (0.7%)
Swedish: 27 (0.6%)
Danish: 26 (0.6%)
Scotch-Irish: 25 (0.6%)
Armenian: 23 (0.5%)
Australian: 19 (0.4%)
French: 16 (0.4%)
Lithuanian: 11 (0.3%)
Slovene: 10 (0.2%)
Most common places of birth for foreign-born residents (%):
Brazil
Corte Madera:
18.4% (206)
California:
0.5% (53,222)
United Kingdom, excluding England and Scotland
Corte Madera:
12.5% (140)
California:
0.6% (60,582)
China, excluding Hong Kong and Taiwan
Corte Madera:
7.8% (87)
California:
6.6% (684,672)
Korea
Corte Madera:
5.6% (63)
California:
3.0% (315,248)
England
Corte Madera:
5.2% (58)
California:
0.6% (57,953)
Bolivia
Corte Madera:
4.4% (49)
California:
0.1% (8,545)
Germany
Corte Madera:
4.0% (45)
California:
0.7% (73,304)
Greece
Corte Madera:
4.0% (45)
California:
0.1% (10,538)
Canada
Corte Madera:
3.9% (44)
California:
1.2% (127,477)
Fiji
Corte Madera:
3.7% (41)
California:
0.3% (33,937)
Japan
Corte Madera:
3.1% (35)
California:
1.0% (103,575)
Austria
Corte Madera:
2.9% (32)
California:
0.1% (6,773)
Netherlands
Corte Madera:
2.6% (29)
California:
0.2% (17,937)
Croatia
Corte Madera:
2.0% (22)
California:
0.0% (4,947)
Malaysia
Corte Madera:
1.9% (21)
California:
0.2% (17,929)
Colombia
Corte Madera:
1.5% (17)
California:
0.5% (55,249)
Place of birth for U.S.-born residents:
This state: 5,092
Other state: 3,469
Northeast: 1,388
Midwest: 794
South: 594
West: 707
88.9% of Corte Madera residents lived in the same house 1 years ago. Out of people who lived in different houses, 20.8% lived in this county. Out of people who lived in different counties, 71.7% lived in California.
Corte Madera:
88.9%
State average:
88.9%
Education attainment for males 25 years and older:
No schooling: 0
Nursery to 4th grade: 0
5th and 6th grade: 0
7th and 8th grade: 0
9th grade: 0
10th grade: 0
11th grade: 0
12th grade, no diploma: 0
High school graduate (or equivalency): 302
Less than 1 year of college: 130
Some college more than 1 year, no degree: 135
Associate degree: 106
Bachelor's degree: 1,335
Master's degree: 569
Professional school degree: 469
Doctorate degree: 336
Education attainment for females 25 years and older:
No schooling: 0
Nursery to 4th grade: 10
5th and 6th grade: 0
7th and 8th grade: 34
9th grade: 0
10th grade: 0
11th grade: 0
12th grade, no diploma: 0
High school graduate (or equivalency): 309
Less than 1 year of college: 158
Some college more than 1 year, no degree: 210
Associate degree: 159
Bachelor's degree: 1,463
Master's degree: 657
Professional school degree: 419
Doctorate degree: 180
Housing units in structures:
One, detached: 2,856
One, attached: 324
Two: 87
3 or 4: 108
5 to 9: 266
10 to 19: 199
20 to 49: 134
50 or more: 136
Housing units lacking complete kitchen facilities in 2022: 0.2%
House/condo owner moved in on average 12 years ago