Housing density: 1,361 houses/condos per square mile
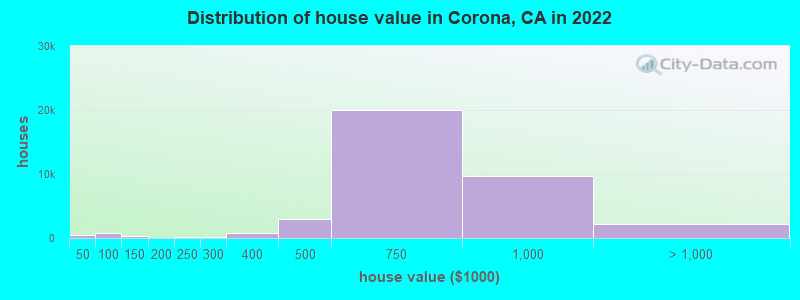
Median price asked for vacant for-sale houses and condos in 2022: $632,305.
Median contract rent in 2022: $1,993 (lower quartile is $1,584, upper quartile is over $2,000)
Median rent asked for vacant for-rent units in 2022: $1,661
Median gross rent in Corona, CA in 2022: over $2,000
Housing units in Corona with a mortgage: 21,220 (1,852 second mortgage, 0 home equity loan, 1,531 both second mortgage and home equity loan) Houses without a mortgage: 332
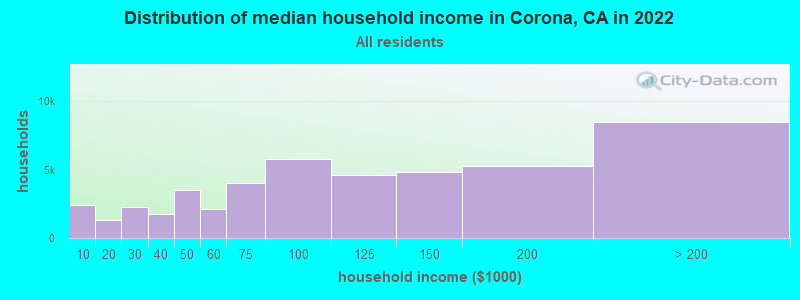
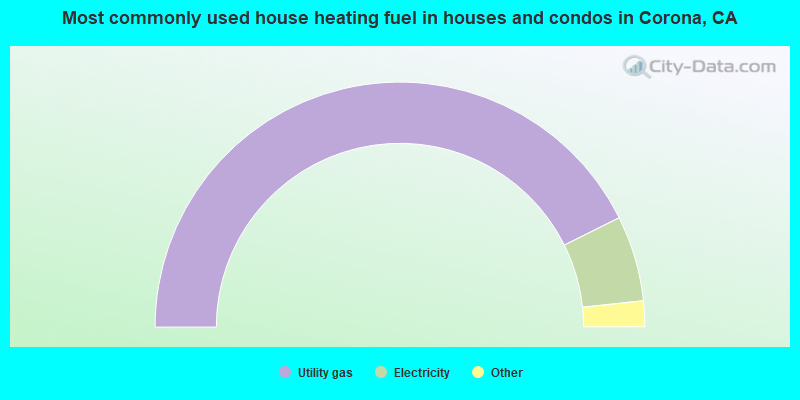
Median household income for houses/condos with a mortgage: $140,892
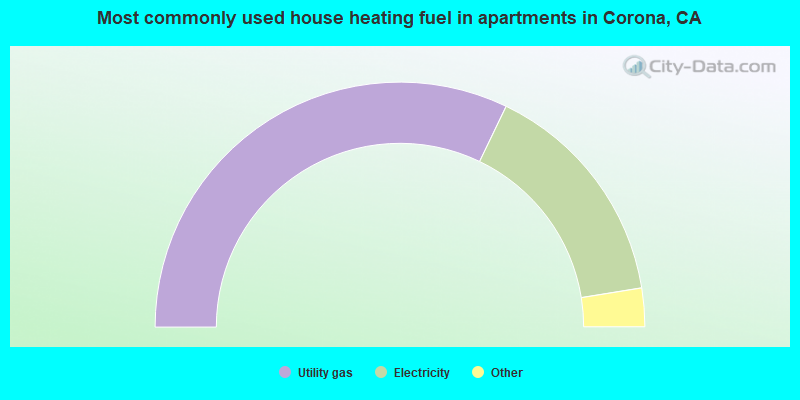
Median household income for apartments without a mortgage: $92,629
26,766 married couples with children.
7,427 single-parent households (1,363 men, 6,064 women).
50.9% of residents of Corona speak English at home.
36.3% of residents speak Spanish at home (69% speak English very well, 12% speak English well, 13% speak English not well, 6% don't speak English at all).
3.4% of residents speak other Indo-European language at home (65% speak English very well, 28% speak English well, 8% speak English not well).
5.5% of residents speak Asian or Pacific Island language at home (57% speak English very well, 23% speak English well, 15% speak English not well, 5% don't speak English at all).
4.0% of residents speak other language at home (93% speak English very well, 2% speak English well, 3% speak English not well, 2% don't speak English at all).
Foreign born population: 39,097 (24.5%)
(64.5% of them are naturalized citizens)
Percentage of workers working in this county: 62.7% Number of people working at home: 9,270 (11.3% of all workers)
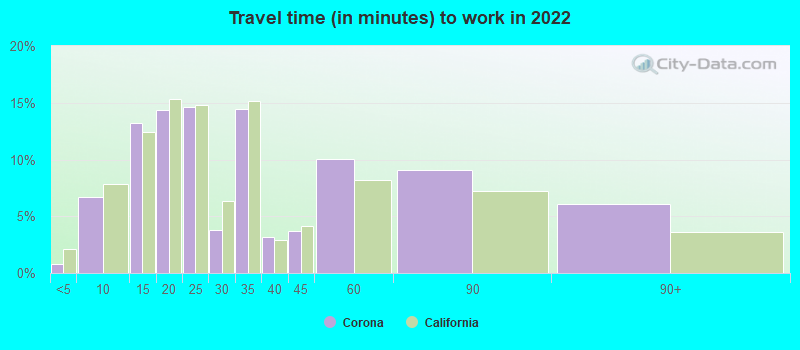
Travel time to work (commute)
Less than 5 minutes: 861
5 to 9 minutes: 4,664
10 to 14 minutes: 8,979
15 to 19 minutes: 6,727
20 to 24 minutes: 7,290
25 to 29 minutes: 4,131
30 to 34 minutes: 8,608
35 to 39 minutes: 1,455
40 to 44 minutes: 3,888
45 to 59 minutes: 9,560
60 to 89 minutes: 10,654
90 or more minutes: 3,062
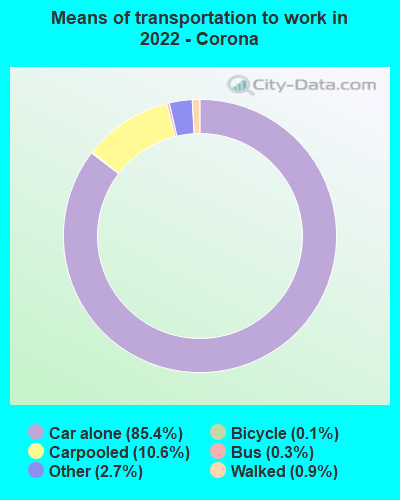
Means of transportation to work:
Drove a car alone: 62,872 (74.6%)
Carpooled: 8,487 (10.1%)
Bus: 172 (0.2%)
Subway or elevated rail: 9 (0.0%)
Long-distance train or commuter rail: 12 (0.0%)
Taxi: 2,038 (2.4%)
Bicycle: 120 (0.1%)
Walked: 674 (0.8%)
Worked at home: 9,270 (11.0%)
Unemployment by race in 2022
Unemployment rate for White non-Hispanic residents
2.3%Males
2.8%Females
Unemployment rate for Black residents
1.5%Males
3.3%Females
Unemployment rate for American Indian and Alaska Native residents
12.1%Males
4.8%Females
Unemployment rate for Asian residents
4.2%Males
5.5%Females
Unemployment rate for other race residents
3.9%Males
4.1%Females
Unemployment rate for two or more race residents
9.7%Males
5.3%Females
Unemployment rate for Hispanic or Latino residents
7.6%Males
4.6%Females
Year of entry for the foreign-born population in Corona, California
6,2522010 or later
9,4992000 to 2009
8,6181990 to 1999
9,3401980 to 1989
5,8051970 to 1979
3,140Before 1970
First ancestries reported:
European: 3,228 (3.0%)
English: 2,930 (2.8%)
German: 2,423 (2.3%)
American: 2,076 (2.0%)
Italian: 1,656 (1.6%)
Irish: 1,613 (1.5%)
Egyptian: 667 (0.6%)
Arab: 661 (0.6%)
Iranian: 649 (0.6%)
Polish: 607 (0.6%)
Afghan: 519 (0.5%)
Romanian: 516 (0.5%)
Syrian: 514 (0.5%)
Scottish: 485 (0.5%)
Norwegian: 468 (0.4%)
Iraqi: 339 (0.3%)
Palestinian: 328 (0.3%)
Jordanian: 267 (0.3%)
French: 243 (0.2%)
African: 234 (0.2%)
Czech: 213 (0.2%)
Hungarian: 203 (0.2%)
Russian: 199 (0.2%)
Canadian: 191 (0.2%)
Lebanese: 183 (0.2%)
Dutch: 176 (0.2%)
Armenian: 167 (0.2%)
Ethiopian: 157 (0.1%)
Kenyan: 156 (0.1%)
French Canadian: 153 (0.1%)
Swedish: 141 (0.1%)
British: 137 (0.1%)
Scotch-Irish: 134 (0.1%)
Eastern European: 132 (0.1%)
Croatian: 124 (0.1%)
Scandinavian: 107 (0.1%)
Nigerian: 94 (0.09%)
Portuguese: 75 (0.07%)
Haitian: 75 (0.07%)
Northern European: 61 (0.06%)
Jamaican: 56 (0.05%)
Greek: 55 (0.05%)
Welsh: 53 (0.05%)
Belgian: 50 (0.05%)
Danish: 44 (0.04%)
Assyrian: 38 (0.04%)
Swiss: 34 (0.03%)
Icelander: 29 (0.03%)
Lithuanian: 27 (0.03%)
Israeli: 26 (0.02%)
Ukrainian: 26 (0.02%)
Ghanaian: 24 (0.02%)
South African: 20 (0.02%)
Finnish: 18 (0.02%)
Turkish: 18 (0.02%)
Austrian: 17 (0.02%)
Pennsylvania German: 16 (0.02%)
Belizean: 14 (0.01%)
West Indian: 13 (0.01%)
Czechoslovakian: 12 (0.01%)
Cajun: 12 (0.01%)
Slavic: 12 (0.01%)
Australian: 11 (0.01%)
Brazilian: 10 (0.01%)
Basque: 8 (0.01%)
Slovak: 7 (0.01%)
Estonian: 7 (0.01%)
Maltese: 7 (0.01%)
Most common places of birth for foreign-born residents (%):
Mexico
Corona:
44.8% (17,446)
California:
37.2% (3,881,193)
Philippines
Corona:
6.5% (2,534)
California:
7.8% (818,297)
Vietnam
Corona:
4.1% (1,601)
California:
4.9% (512,335)
India
Corona:
3.9% (1,519)
California:
5.2% (539,184)
El Salvador
Corona:
3.6% (1,405)
California:
4.2% (440,287)
China, excluding Hong Kong and Taiwan
Corona:
3.3% (1,272)
California:
6.6% (684,672)
Korea
Corona:
3.1% (1,194)
California:
3.0% (315,248)
Syria
Corona:
2.1% (837)
California:
0.3% (30,949)
Afghanistan
Corona:
1.7% (653)
California:
0.5% (53,260)
Guatemala
Corona:
1.7% (647)
California:
2.8% (290,436)
Pakistan
Corona:
1.6% (618)
California:
0.5% (49,399)
Canada
Corona:
1.5% (589)
California:
1.2% (127,477)
Place of birth for U.S.-born residents:
This state: 105,765
Other state: 12,466
Northeast: 3,764
Midwest: 3,273
South: 2,525
West: 2,904
90.5% of Corona residents lived in the same house 1 years ago. Out of people who lived in different houses, 33.0% lived in this county. Out of people who lived in different counties, 86.8% lived in California.
Corona:
90.5%
State average:
88.9%
Education attainment for males 25 years and older:
No schooling: 1,962
Nursery to 4th grade: 1,580
5th and 6th grade: 1,651
7th and 8th grade: 480
9th grade: 620
10th grade: 377
11th grade: 386
12th grade, no diploma: 1,653
High school graduate (or equivalency): 12,874
Less than 1 year of college: 4,226
Some college more than 1 year, no degree: 5,430
Associate degree: 3,552
Bachelor's degree: 9,749
Master's degree: 2,727
Professional school degree: 778
Doctorate degree: 378
Education attainment for females 25 years and older:
No schooling: 2,108
Nursery to 4th grade: 965
5th and 6th grade: 1,251
7th and 8th grade: 432
9th grade: 645
10th grade: 251
11th grade: 613
12th grade, no diploma: 977
High school graduate (or equivalency): 15,258
Less than 1 year of college: 3,087
Some college more than 1 year, no degree: 6,765
Associate degree: 4,014
Bachelor's degree: 10,834
Master's degree: 4,768
Professional school degree: 672
Doctorate degree: 626
Housing units in structures:
One, detached: 31,538
One, attached: 2,483
Two: 647
3 or 4: 1,921
5 to 9: 2,717
10 to 19: 2,240
20 to 49: 2,013
50 or more: 3,234
Mobile homes: 1,004
Boats, RVs, vans, etc.: 39
Median worth of mobile homes: $175,300
Housing units lacking complete plumbing facilities in 2022: 1.1%
Housing units lacking complete kitchen facilities in 2022: 2.2%
House/condo owner moved in on average 11 years ago