Coral Gables, FL (Florida) Houses and Residents
| Coral Gables: | $1,115,095 |
| Florida: | $354,100 |
Mean price in 2022:
Detached houses: $1,961,901
Here: $1,961,901 State: $500,941 Townhouses or other attached units: $1,251,100
Here: $1,251,100 State: $370,869 In 2-unit structures: $799,515
Here: $799,515 State: $423,188 In 3-to-4-unit structures: $600,065
Here: $600,065 State: $309,944 In 5-or-more-unit structures: $1,072,529
Here: $1,072,529 State: $447,145 Mobile homes: $98,211
Here: $98,211 State: $113,202
Total population: 51,227 (Urban population: 42,202, Rural population: 0)
Houses: 22,155 (19,303 occupied: 12,570 owner occupied, 6,990 renter occupied)
| % of renters here: | 36% |
| State: | 33% |
Housing density: 1,687 houses/condos per square mile
Median price asked for vacant for-sale houses and condos in 2022: $3,131,706.
Median contract rent in 2022: $1,995 (lower quartile is $1,439, upper quartile is over $2,000)
Median rent asked for vacant for-rent units in 2022: $2,986
Median gross rent in Coral Gables, FL in 2022: over $2,000
Housing units in Coral Gables with a mortgage: 6,352 (840 second mortgage, 23 home equity loan, 795 both second mortgage and home equity loan)
Houses without a mortgage: 366
Median household income for houses/condos with a mortgage: $207,656
Median household income for apartments without a mortgage: $128,202
Median monthly housing costs: $2,416
Compare current foreclosures near Coral Gables, FL:
| Photo | Address | Area | Beds / Baths | Price | Details |
|---|---|---|---|---|---|

|
#1
E 35th St
Hialeah, FL 33013
|
1,690 sq. feet
|
1 baths 2 beds |
$436,000
|
show details |

|
#2
174th St Apt 1818
North Miami Beach, FL 33160
|
1,275 sq. feet
|
2 baths 2 beds |
$425,000
|
show details |

|
#3
NE 1st Ave Unit #2200
Miami, FL 33132
|
- sq. feet
|
2 baths 1 beds |
$715,000
|
show details |

|
#4
SW 107th Pl
Miami, FL 33157
|
2,196 sq. feet
|
2 baths 3 beds |
show details | |

|
#5
W 28th Ct Unit 106
Hialeah, FL 33018
|
850 sq. feet
|
2 baths 2 beds |
show details | |

|
#6
SW 87th Pl Dr
Miami, FL 33165
|
1,545 sq. feet
|
2 baths 3 beds |
show details | |

|
#7
SW 122nd St
Miami, FL 33186
|
2,310 sq. feet
|
3 baths 4 beds |
show details | |

|
#8
SW 38th Ln
Miami, FL 33165
|
1,233 sq. feet
|
2 baths 2 beds |
show details | |

|
#9
SW 79th St # 7
Miami, FL 33143
|
768 sq. feet
|
1 baths 1 beds |
show details | |

|
#10
Lenox Ave Apt 17
Miami Beach, FL 33139
|
569 sq. feet
|
1 baths 1 beds |
show details |
| Photo | Address | Area | Beds / Baths | Price | Details |
|---|---|---|---|---|---|

|
#11
NW 111th St
Hialeah, FL 33012
|
2,540 sq. feet
|
3 baths 5 beds |
show details | |

|
#12
North East 9th Place
Miami, FL 33162
|
1,972 sq. feet
|
2 baths 3 beds |
show details | |

|
#13
NW 19th 354
Miami, FL 33136
|
1,114 sq. feet
|
1 baths 4 beds |
show details | |

|
#14
NE Miami Gardens Dr Apt 101
Miami, FL 33179
|
560 sq. feet
|
1 baths 1 beds |
show details | |

|
#15
NW 10th Ave
Miami, FL 33128
|
2,973 sq. feet
|
1 baths 2 beds |
show details | |

|
#16
NE 2nd Ave
Miami, FL 33132
|
662 sq. feet
|
1 baths 1 beds |
show details | |

|
#17
NW 10th Ave
Miami, FL 33169
|
3,419 sq. feet
|
4 baths 6 beds |
show details | |

|
#18
NW 136th Ct
Miami, FL 33182
|
2,605 sq. feet
|
2 baths 4 beds |
show details | |

|
#19
SW 161st Ave
Miami, FL 33196
|
1,972 sq. feet
|
2 baths 3 beds |
show details | |

|
#20
SW 148th Pl
Miami, FL 33196
|
1,763 sq. feet
|
2 baths 3 beds |
show details |
| Photo | Address | Area | Beds / Baths | Price | Details |
|---|---|---|---|---|---|

|
#21
- 830 NW 23rd Ct
Miami, FL 33125
|
- sq. feet
|
4 baths 6 beds |
show details | |

|
#22
SW 145th St
Miami, FL 33176
|
4,070 sq. feet
|
4 baths 4 beds |
show details | |

|
#23
Marine Dr
Miami, FL 33189
|
2,198 sq. feet
|
3 baths 4 beds |
show details | |

|
#24
SW 19th St
Miami, FL 33145
|
2,689 sq. feet
|
3 baths 5 beds |
show details | |

|
#25
SW 8t 406a
Miami, FL 33144
|
934 sq. feet
|
2 baths 2 beds |
show details | |

|
#26
E 20th St
Hialeah, FL 33013
|
1,444 sq. feet
|
1 baths 2 beds |
show details | |

|
#27
SW 3rd Ave
Miami, FL 33145
|
1,666 sq. feet
|
3 baths 3 beds |
show details | |

|
#28
NW 177th Ter
Miami, FL 33169
|
1,368 sq. feet
|
2 baths 3 beds |
show details | |

|
#29
NW 177th St Apt 107
Hialeah, FL 33015
|
967 sq. feet
|
2 baths 2 beds |
show details | |

|
#30
SW 54th Ct
Hollywood, FL 33027
|
3,077 sq. feet
|
4 baths 4 beds |
show details |
| Photo | Address | Area | Beds / Baths | Price | Details |
|---|---|---|---|---|---|

|
#31
SW 144th Ct
Miami, FL 33186
|
2,084 sq. feet
|
2 baths 4 beds |
show details | |

|
#32
NW 42nd Ave Apt 407
Miami, FL 33126
|
958 sq. feet
|
2 baths 2 beds |
show details | |

|
#33
SW 117th Ct
Miami, FL 33175
|
2,047 sq. feet
|
3 baths 4 beds |
show details | |

|
#34
SW 31st St
Miami, FL 33155
|
2,110 sq. feet
|
3 baths 3 beds |
show details | |

|
#35
SW 9th Ln
Miami, FL 33194
|
1,775 sq. feet
|
3 baths 3 beds |
show details | |

|
#36
SW 153rd Ter
Miami, FL 33177
|
1,842 sq. feet
|
2 baths 4 beds |
show details | |

|
#37
E 9th Ct
Hialeah, FL 33013
|
1,541 sq. feet
|
1 baths 3 beds |
show details | |

|
#38
NE 15th Ave Apt 402
Miami, FL 33161
|
1,050 sq. feet
|
2 baths 2 beds |
show details | |

|
#39
SW 148th Path
Miami, FL 33196
|
1,371 sq. feet
|
2 baths 3 beds |
show details | |

|
#40
SW 26th St
Miami, FL 33165
|
2,150 sq. feet
|
3 baths 3 beds |
show details |
| Photo | Address | Area | Beds / Baths | Price | Details |
|---|---|---|---|---|---|

|
#41
NW 102nd St
Miami, FL 33147
|
1,501 sq. feet
|
2 baths 4 beds |
show details | |

|
#42
E 8th Ln
Hialeah, FL 33013
|
1,696 sq. feet
|
1 baths 3 beds |
show details | |

|
#43
Sans Souci C104
Miami, FL 33181
|
1,304 sq. feet
|
2 baths 2 beds |
show details | |

|
#44
SW 145th Ave
Miami, FL 33177
|
1,782 sq. feet
|
2 baths 4 beds |
show details | |

|
#45
SW 190th Ter
Miami, FL 33177
|
1,128 sq. feet
|
1 baths 3 beds |
show details | |

|
#46
E 9th Pl
Hialeah, FL 33010
|
1,551 sq. feet
|
1 baths 2 beds |
show details | |

|
#47
SW 113th St
Miami, FL 33176
|
1,989 sq. feet
|
2 baths 4 beds |
show details | |

|
#48
NW 30th Ave
Miami, FL 33142
|
820 sq. feet
|
1 baths 2 beds |
show details | |

|
#49
NW 158th Street Rd
Opa Locka, FL 33054
|
1,448 sq. feet
|
1 baths 3 beds |
show details | |

|
Check over 1 million property listings on Foreclosure.com!
|
browse all offers | |||


 | Downtown Coral Gables Condos? (19 replies) |
| Any Personal Experience with Coral Gables Condos? (2 replies) |
| Moving to Miami - Rent a condo or at an apartment complex? Traffic? Brickell / Edgewater (5 replies) |
| Will house and condo/apartment prices rise? (8 replies) |
| Condo HOA Fees (4 replies) |
| Good Areas for 1-BR Apartments / Price Range (2 replies) |

Median year apartment built: 1974
Household type by relationship:
Households: 49,429- Male householders: 9,605 (2,447 living alone), Female householders: 9,240 (3,974 living alone)
9,112 spouses (8,967 opposite-sex spouses), 999 unmarried partners, (927 opposite-sex unmarried partners), 11,599 children (11,164 natural, 181 adopted, 253 stepchildren), 226 grandchildren, 227 brothers or sisters, 748 parents, 0 foster children, 350 other relatives, 1,223 non-relatives
- In group quarters: 6,095
Size of family households: 5,709 2-persons, 2,542 3-persons, 2,233 4-persons, 695 5-persons, 209 6-persons.
Size of nonfamily households: 6,882 1-person, 1,181 2-persons, 147 3-persons, 10 4-persons.
6,378 married couples with children.
1,465 single-parent households (453 men, 1,012 women).
38.7% of residents of Coral Gables speak English at home.
53.3% of residents speak Spanish at home (76% speak English very well, 14% speak English well, 8% speak English not well, 2% don't speak English at all).
5.9% of residents speak other Indo-European language at home (86% speak English very well, 8% speak English well, 4% speak English not well, 2% don't speak English at all).
1.8% of residents speak Asian or Pacific Island language at home (56% speak English very well, 27% speak English well, 15% speak English not well, 2% don't speak English at all).
0.3% of residents speak other language at home (82% speak English very well, 3% speak English well, 15% don't speak English at all).
Foreign born population: 19,343 (39.1%)
(67.6% of them are naturalized citizens)
| Here: | 6.7 |
| State: | 5.9 |
| Here: | 3.3 |
| State: | 4.2 |

- Bedrooms in owner-occupied houses and condos in Coral Gables, Florida
- 203no bedroom
- 4951 bedroom
- 2,3362 bedrooms
- 4,5623 bedrooms
- 3,4114 bedrooms
- 1,5635+ bedrooms

- Bedrooms in renter-occupied apartments in Coral Gables, Florida
- 910no bedroom
- 2,5901 bedroom
- 2,4502 bedrooms
- 8193 bedrooms
- 954 bedrooms
- 1275+ bedrooms

- Cars and other vehicles available in Coral Gables in owner-occupied houses/condos
- 669no vehicle
- 4,3321 vehicle
- 5,1462 vehicles
- 1,7583 vehicles
- 4334 vehicles
- 2325+ vehicles

- Cars and other vehicles available in Coral Gables in renter-occupied apartments
- 712no vehicle
- 4,1811 vehicle
- 1,7032 vehicles
- 3313 vehicles
- 624 vehicles
- 05+ vehicles

- Rooms in owner-occupied houses in Coral Gables, Florida
- 1511 room
- 652 rooms
- 8013 rooms
- 1,3314 rooms
- 1,5035 rooms
- 2,0216 rooms
- 2,1147 rooms
- 2,1898 rooms
- 2,3959+ rooms

- Rooms in renter-occupied apartments in Coral Gables, Florida
- 7971 room
- 1,1362 rooms
- 1,9043 rooms
- 1,2084 rooms
- 9485 rooms
- 5276 rooms
- 1737 rooms
- 608 rooms
- 2389+ rooms


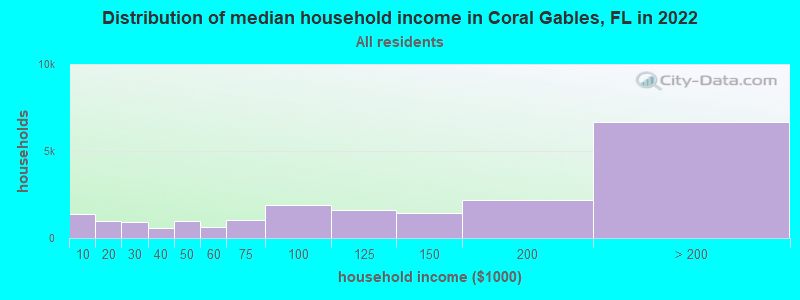
Coral Gables, FL household income distribution

- 1,394Less than $10,000
- 961$10,000 to $19,999
- 913$20,000 to $29,999
- 556$30,000 to $39,999
- 953$40,000 to $49,999
- 638$50,000 to $59,999
- 1,026$60,000 to $74,999
- 1,888$75,000 to $99,999
- 1,634$100,000 to $124,999
- 1,458$125,000 to $149,999
- 2,183$150,000 to $199,999
- 6,681$200,000 or more
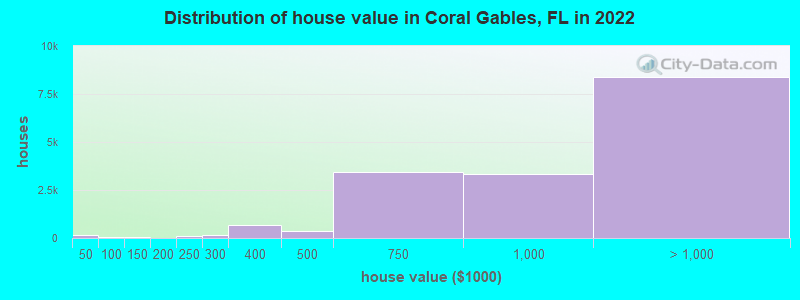
Home value of owner - occupied houses in 2022 in Coral Gables, FL
-
- 82Less than $10,000
- 25$10,000 to $14,999
- 7$15,000 to $19,999
- 28$35,000 to $39,999
- 9$50,000 to $59,999
- 20$60,000 to $69,999
- 5$90,000 to $99,999
- 21$100,000 to $124,999
- 29$125,000 to $149,999
- 9$150,000 to $174,999
- 9$175,000 to $199,999
- 130$200,000 to $249,999
- 158$250,000 to $299,999
- 699$300,000 to $399,999
- 379$400,000 to $499,999
- 3,432$500,000 to $749,999
- 3,317$750,000 to $999,999
- 2,972$1,000,000 to $1,499,999
- 1,937$1,500,000 to $1,999,999
- 3,467$2,000,000 or more
Rent paid by renters in 2022 in Coral Gables, FL
-
- 10$250 to $299
- 37$350 to $399
- 18$450 to $499
- 11$550 to $599
- 75$600 to $649
- 168$800 to $899
- 94$900 to $999
- 632$1,000 to $1,249
- 933$1,250 to $1,499
- 1,543$1,500 to $1,999
- 1,181$2,000 to $2,499
- 1,002$2,500 to $2,999
- 535$3,000 to $3,499
- 1,303$3,500 or more
- 272No cash rent

Percentage of workers working in this county: 96.1%
Number of people working at home: 6,077 (26.5% of all workers)
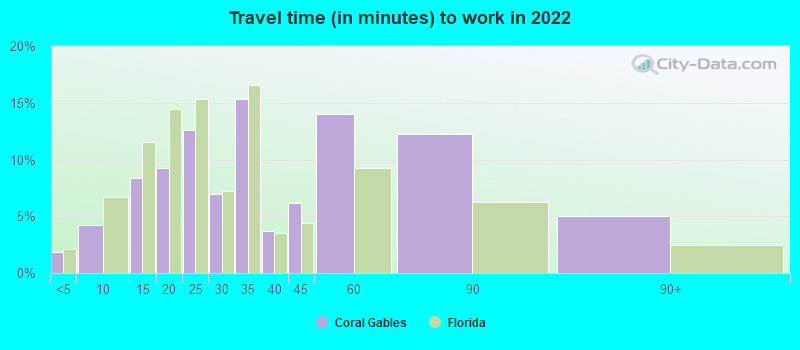
Travel time to work (commute)
- Less than 5 minutes: 757
- 5 to 9 minutes: 1,244
- 10 to 14 minutes: 2,379
- 15 to 19 minutes: 2,347
- 20 to 24 minutes: 3,318
- 25 to 29 minutes: 1,850
- 30 to 34 minutes: 2,692
- 35 to 39 minutes: 534
- 40 to 44 minutes: 829
- 45 to 59 minutes: 1,455
- 60 to 89 minutes: 521
- 90 or more minutes: 181
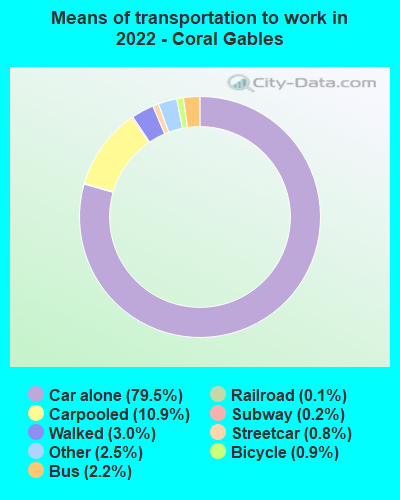
Means of transportation to work:
- Drove a car alone: 36,212 (67.8%)
- Carpooled: 5,602 (10.5%)
- Bus: 942 (1.8%)
- Subway or elevated rail: 544 (1.0%)
- Long-distance train or commuter rail: 102 (0.2%)
- Light rail, streetcar or trolley: 78 (0.1%)
- Taxi: 1,429 (2.7%)
- Bicycle: 532 (1.0%)
- Walked: 1,563 (2.9%)
- Worked at home: 6,077 (11.4%)
- Unemployment by race in 2022
- Unemployment rate for White non-Hispanic residents
- 2.8%Males
- 2.6%Females
- Unemployment rate for Black residents
- 9.4%Males
- 37.4%Females
- Unemployment rate for Asian residents
- 11.3%Males
- 5.3%Females
- Unemployment rate for other race residents
- 9.5%Males
- 4.6%Females
- Unemployment rate for two or more race residents
- 1.9%Males
- 3.3%Females
- Unemployment rate for Hispanic or Latino residents
- 2.4%Males
- 3.0%Females

- Year of entry for the foreign-born population in Coral Gables, Florida
- 7,1852010 or later
- 2,7032000 to 2009
- 1,6241990 to 1999
- 2,4701980 to 1989
- 1,9991970 to 1979
- 7,560Before 1970

First ancestries reported:
- American: 1,111 (4.1%)
- Italian: 964 (3.6%)
- German: 555 (2.1%)
- English: 542 (2.0%)
- European: 401 (1.5%)
- Irish: 353 (1.3%)
- Brazilian: 276 (1.0%)
- French: 264 (1.0%)
- British: 255 (0.9%)
- Polish: 240 (0.9%)
- Lebanese: 207 (0.8%)
- Russian: 201 (0.7%)
- Greek: 145 (0.5%)
- Iranian: 145 (0.5%)
- Portuguese: 132 (0.5%)
- Eastern European: 113 (0.4%)
- Swiss: 109 (0.4%)
- French Canadian: 84 (0.3%)
- Scottish: 76 (0.3%)
- Austrian: 71 (0.3%)
- Turkish: 59 (0.2%)
- Belgian: 54 (0.2%)
- Arab: 50 (0.2%)
- Iraqi: 44 (0.2%)
- Welsh: 43 (0.2%)
- Canadian: 41 (0.2%)
- Guyanese: 39 (0.1%)
- West Indian: 38 (0.1%)
- Romanian: 37 (0.1%)
- African: 36 (0.1%)
- Ukrainian: 33 (0.1%)
- Israeli: 32 (0.1%)
- Dutch: 32 (0.1%)
- Swedish: 29 (0.1%)
- Northern European: 25 (0.09%)
- Haitian: 25 (0.09%)
- Moroccan: 22 (0.08%)
- Scotch-Irish: 22 (0.08%)
- Yugoslavian: 22 (0.08%)
- Latvian: 21 (0.08%)
- Bulgarian: 21 (0.08%)
- Jamaican: 21 (0.08%)
- Trinidadian and Tobagonian: 17 (0.06%)
- Bahamian: 17 (0.06%)
- Scandinavian: 16 (0.06%)
- Sudanese: 16 (0.06%)
- Norwegian: 15 (0.06%)
- Hungarian: 14 (0.05%)
- Kenyan: 14 (0.05%)
- Slovak: 13 (0.05%)
- Armenian: 11 (0.04%)
- South African: 7 (0.03%)
- Slavic: 6 (0.02%)
- British West Indian: 6 (0.02%)
- Czech: 4 (0.01%)
Most common places of birth for foreign-born residents (%):
| Coral Gables: | 35.2% (6,806) |
| Florida: | 22.0% (1,006,576) |
| Coral Gables: | 14.7% (2,838) |
| Florida: | 5.7% (262,042) |
| Coral Gables: | 8.2% (1,589) |
| Florida: | 6.5% (298,669) |
| Coral Gables: | 5.1% (994) |
| Florida: | 5.6% (257,152) |
| Coral Gables: | 3.7% (719) |
| Florida: | 2.7% (122,906) |
| Coral Gables: | 3.4% (651) |
| Florida: | 1.3% (57,263) |
| Coral Gables: | 3.1% (609) |
| Florida: | 2.3% (105,066) |
| Coral Gables: | 2.5% (481) |
| Florida: | 0.5% (21,571) |
| Coral Gables: | 2.0% (384) |
| Florida: | 3.0% (137,727) |
| Coral Gables: | 1.9% (375) |
| Florida: | 2.1% (96,693) |
| Coral Gables: | 1.7% (322) |
| Florida: | 2.4% (109,132) |
| Coral Gables: | 1.5% (294) |
| Florida: | 1.2% (56,071) |
Place of birth for U.S.-born residents:
- This state: 15,394
- Other state: 13,027
- Northeast: 6,435
- Midwest: 2,131
- South: 2,558
- West: 1,992
79.8% of Coral Gables residents lived in the same house 1 years ago.
Out of people who lived in different houses, 36.7% lived in this county.
Out of people who lived in different counties, 32.5% lived in Florida.
| Coral Gables: | 79.8% |
| State average: | 86.3% |
Education attainment for males 25 years and older:
- No schooling: 19
- Nursery to 4th grade: 47
- 5th and 6th grade: 12
- 7th and 8th grade: 25
- 9th grade: 18
- 10th grade: 13
- 11th grade: 26
- 12th grade, no diploma: 106
- High school graduate (or equivalency): 1,515
- Less than 1 year of college: 359
- Some college more than 1 year, no degree: 748
- Associate degree: 788
- Bachelor's degree: 5,296
- Master's degree: 3,444
- Professional school degree: 2,679
- Doctorate degree: 1,041

Education attainment for females 25 years and older:
- No schooling: 182
- Nursery to 4th grade: 0
- 5th and 6th grade: 58
- 7th and 8th grade: 42
- 9th grade: 67
- 10th grade: 67
- 11th grade: 39
- 12th grade, no diploma: 161
- High school graduate (or equivalency): 1,848
- Less than 1 year of college: 511
- Some college more than 1 year, no degree: 1,393
- Associate degree: 1,191
- Bachelor's degree: 5,731
- Master's degree: 3,847
- Professional school degree: 1,585
- Doctorate degree: 572


Housing units in structures:
- One, detached: 11,273
- One, attached: 590
- Two: 316
- 3 or 4: 678
- 5 to 9: 638
- 10 to 19: 1,889
- 20 to 49: 1,673
- 50 or more: 5,008
- Mobile homes: 35
- Boats, RVs, vans, etc.: 48
Housing units lacking complete kitchen facilities in 2022: 1.2%
House/condo owner moved in on average 10 years ago
Renter moved in on average 1 years ago

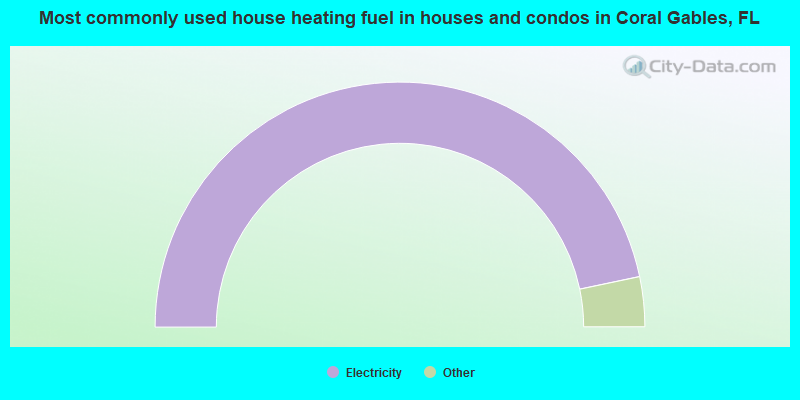
- 93.4%Electricity
- 3.8%No fuel used
- 1.4%Bottled, tank, or LP gas
- 0.8%Utility gas
- 0.5%Solar energy
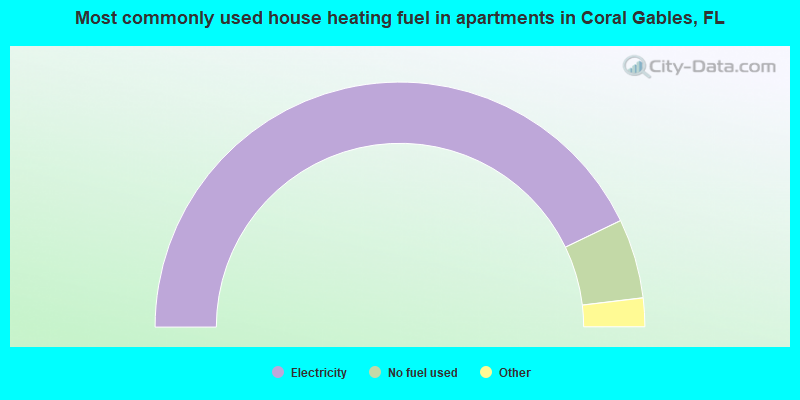
- 85.7%Electricity
- 10.5%No fuel used
- 3.4%Utility gas
- 0.3%Other fuel
- 0.2%Bottled, tank, or LP gas
Private vs. public school enrollment:
| Here: | 44.9% |
| Florida: | 15.8% |
| Here: | 63.6% |
| Florida: | 12.9% |
| Here: | 72.6% |
| Florida: | 23.6% |


