Columbus, MS (Mississippi) Houses and Residents
| Columbus: | $129,462 |
| Mississippi: | $162,500 |
Total population: 23,248 (All urban)
Houses: 12,082 (9,997 occupied: 4,673 owner occupied, 5,430 renter occupied)
| % of renters here: | 54% |
| State: | 30% |
Housing density: 564 houses/condos per square mile
Median price asked for vacant for-sale houses and condos in 2022: $131,907.
Median contract rent in 2022: $599 (lower quartile is $458, upper quartile is $783)
Median rent asked for vacant for-rent units in 2022: $866
Median gross rent in Columbus, MS in 2022: $862
Housing units in Columbus with a mortgage: 2,460 (173 second mortgage, 0 home equity loan, 156 both second mortgage and home equity loan)
Houses without a mortgage: 0
Median household income for houses/condos with a mortgage: $58,614
Median household income for apartments without a mortgage: $46,491
Median monthly housing costs: $815
Compare current foreclosures in Columbus, MS:
| Photo | Address | Area | Beds / Baths | Price | Details |
|---|---|---|---|---|---|

|
#1
Crenshaw Dr
Columbus, MS 39702
|
1,687 sq. feet
|
2 baths 3 beds |
show details | |

|
#2
Sonia Dr
Columbus, MS 39702
|
2,201 sq. feet
|
2 baths 3 beds |
show details | |

|
#3
Highway 69 S
Columbus, MS 39702
|
3,354 sq. feet
|
1 baths - beds |
show details | |

|
#4
Champion Rd
Columbus, MS 39705
|
1 sq. feet
|
2 baths 3 beds |
show details | |

|
#5
Swedenburg Cir
Columbus, MS 39702
|
1,056 sq. feet
|
- baths - beds |
show details | |

|
#6
Windy Ridge Cir
Columbus, MS 39702
|
2,469 sq. feet
|
- baths 4 beds |
show details | |

|
#7
Thornton Dr
Columbus, MS 39702
|
1,550 sq. feet
|
- baths 3 beds |
show details | |

|
#8
18th St N
Columbus, MS 39701
|
2 sq. feet
|
1 baths - beds |
show details | |

|
#9
Wolfe Rd
Columbus, MS 39705
|
1,515 sq. feet
|
- baths - beds |
show details | |

|
#10
Gaylane Dr
Columbus, MS 39702
|
- sq. feet
|
- baths - beds |
show details |
| Photo | Address | Area | Beds / Baths | Price | Details |
|---|---|---|---|---|---|

|
#11
Springdale Dr
Columbus, MS 39702
|
1,752 sq. feet
|
- baths - beds |
show details | |

|
#12
N Lehmberg Rd Lot 47
Columbus, MS 39702
|
- sq. feet
|
- baths - beds |
show details | |

|
#13
Byrnes Cir
Columbus, MS 39701
|
- sq. feet
|
- baths - beds |
show details | |

|
#14
26th St N
Columbus, MS 39701
|
1,323 sq. feet
|
- baths - beds |
show details | |

|
#15
Deerfield Dr Apt 25
Columbus, MS 39702
|
- sq. feet
|
- baths - beds |
show details | |

|
#16
2nd Ave N
Columbus, MS 39701
|
- sq. feet
|
- baths - beds |
show details | |

|
#17
S Lehmberg Rd Apt 175
Columbus, MS 39702
|
- sq. feet
|
- baths - beds |
show details | |

|
#18
Sonia Dr
Columbus, MS 39702
|
1,544 sq. feet
|
- baths - beds |
show details | |

|
#19
Cypress St
Columbus, MS 39702
|
- sq. feet
|
- baths - beds |
show details | |

|
#20
Brisbane Dr Apt 1
Columbus, MS 39702
|
- sq. feet
|
- baths - beds |
show details |
| Photo | Address | Area | Beds / Baths | Price | Details |
|---|---|---|---|---|---|

|
#21
Sonia Dr
Columbus, MS 39702
|
1,610 sq. feet
|
- baths - beds |
show details | |

|
#22
New Hope Rd
Columbus, MS 39702
|
- sq. feet
|
- baths - beds |
show details | |

|
#23
Deerfield Dr Apt 43
Columbus, MS 39702
|
- sq. feet
|
- baths - beds |
show details | |

|
#24
Ray Harris Rd
Columbus, MS 39701
|
- sq. feet
|
- baths - beds |
show details | |

|
#25
Military Rd
Columbus, MS 39705
|
- sq. feet
|
- baths - beds |
show details | |

|
#26
S Lehmberg Rd Apt 32
Columbus, MS 39702
|
- sq. feet
|
- baths - beds |
show details | |

|
#27
Lincoln Rd
Columbus, MS 39705
|
1,725 sq. feet
|
- baths - beds |
show details | |

|
#28
Yellow Brick Rd
Columbus, MS 39702
|
1,895 sq. feet
|
- baths - beds |
show details | |

|
#29
Ryan Pl
Columbus, MS 39702
|
1,531 sq. feet
|
- baths - beds |
show details | |

|
#30
Newbell Rd Apt 30
Columbus, MS 39705
|
- sq. feet
|
- baths - beds |
show details |
| Photo | Address | Area | Beds / Baths | Price | Details |
|---|---|---|---|---|---|

|
#31
Victory Loop
Columbus, MS 39702
|
1,290 sq. feet
|
- baths - beds |
show details | |

|
#32
N Lehmberg Rd Lot 107
Columbus, MS 39702
|
- sq. feet
|
- baths - beds |
show details | |

|
#33
5th Ave N
Columbus, MS 39701
|
- sq. feet
|
- baths - beds |
show details | |

|
#34
Suffolk Dr
Columbus, MS 39702
|
- sq. feet
|
- baths - beds |
show details | |

|
#35
4th Ave S
Columbus, MS 39701
|
804 sq. feet
|
- baths - beds |
show details | |

|
#36
Sherwood Dr
Columbus, MS 39705
|
1,500 sq. feet
|
- baths - beds |
show details | |

|
#37
18th St N
Columbus, MS 39701
|
- sq. feet
|
- baths - beds |
show details | |

|
#38
Poplar St
Columbus, MS 39702
|
936 sq. feet
|
- baths - beds |
show details | |

|
#39
N Mccrary Rd
Columbus, MS 39702
|
- sq. feet
|
- baths - beds |
show details | |

|
#40
13th St S
Columbus, MS 39701
|
- sq. feet
|
- baths - beds |
show details |
| Photo | Address | Area | Beds / Baths | Price | Details |
|---|---|---|---|---|---|

|
#41
Caribou Cv
Columbus, MS 39705
|
1,052 sq. feet
|
- baths - beds |
show details | |

|
#42
Kaye Dr
Columbus, MS 39702
|
- sq. feet
|
- baths - beds |
show details | |

|
#43
Scott Dr
Columbus, MS 39702
|
1,025 sq. feet
|
- baths - beds |
show details | |

|
#44
16th St N
Columbus, MS 39701
|
- sq. feet
|
- baths - beds |
show details | |

|
#45
Maderia Dr
Columbus, MS 39702
|
1,278 sq. feet
|
- baths - beds |
show details | |

|
#46
Old Aberdeen Rd
Columbus, MS 39705
|
1,910 sq. feet
|
- baths - beds |
show details | |

|
#47
3rd Ave N
Columbus, MS 39701
|
1,438 sq. feet
|
- baths - beds |
show details | |

|
#48
15th St S
Columbus, MS 39701
|
- sq. feet
|
- baths - beds |
show details | |

|
#49
Tabernacle Rd
Columbus, MS 39702
|
1,041 sq. feet
|
- baths - beds |
show details | |

|
Check over 1 million property listings on Foreclosure.com!
|
browse all offers | |||

Latest news about housing in Columbus, MS collected exclusively by city-data.com from local newspapers, TV, and radio stations

 | Finding rental houses in Starkville / Columbus (0 replies) |
| All these states complaining about Californians moving there..... (116 replies) |
| The Decline of Jackson (29 replies) |
| Poor Mississippi (33 replies) |
| Traveling to Columbus, MS in June (7 replies) |
| Columbus hit by tornado (3 replies) |

Median year apartment built: 1976
Household type by relationship:
Households: 23,744- Male householders: 3,930 (1,863 living alone), Female householders: 5,871 (2,424 living alone)
2,597 spouses (2,570 opposite-sex spouses), 588 unmarried partners, (588 opposite-sex unmarried partners), 6,512 children (6,266 natural, 69 adopted, 175 stepchildren), 710 grandchildren, 502 brothers or sisters, 243 parents, 71 foster children, 299 other relatives, 911 non-relatives
- In group quarters: 1,505
Size of family households: 2,516 2-persons, 1,331 3-persons, 614 4-persons, 349 5-persons, 189 6-persons, 51 7-or-more-persons.
Size of nonfamily households: 4,495 1-person, 509 2-persons, 19 3-persons, 6 4-persons, 62 5-persons.
1,045 married couples with children.
2,535 single-parent households (266 men, 2,269 women).
96.9% of residents of Columbus speak English at home.
1.8% of residents speak Spanish at home (60% speak English very well, 33% speak English well, 4% speak English not well, 4% don't speak English at all).
1.0% of residents speak other Indo-European language at home (86% speak English very well, 8% speak English well, 6% speak English not well).
0.3% of residents speak Asian or Pacific Island language at home (27% speak English very well, 73% speak English well).
Foreign born population: 517 (2.2%)
(47.4% of them are naturalized citizens)
| Here: | 6.3 |
| State: | 6.3 |
| Here: | 4.8 |
| State: | 4.8 |

- Bedrooms in owner-occupied houses and condos in Columbus, Mississippi
- 12no bedroom
- 1091 bedroom
- 3592 bedrooms
- 2,8173 bedrooms
- 1,3054 bedrooms
- 715+ bedrooms

- Bedrooms in renter-occupied apartments in Columbus, Mississippi
- 145no bedroom
- 7481 bedroom
- 1,9952 bedrooms
- 2,1133 bedrooms
- 4004 bedrooms
- 295+ bedrooms

- Cars and other vehicles available in Columbus in owner-occupied houses/condos
- 251no vehicle
- 1,3281 vehicle
- 1,8142 vehicles
- 1,0473 vehicles
- 1574 vehicles
- 775+ vehicles

- Cars and other vehicles available in Columbus in renter-occupied apartments
- 875no vehicle
- 2,9181 vehicle
- 1,2312 vehicles
- 3293 vehicles
- 634 vehicles
- 145+ vehicles

- Rooms in owner-occupied houses in Columbus, Mississippi
- 121 room
- 102 rooms
- 183 rooms
- 1404 rooms
- 1,1115 rooms
- 1,2396 rooms
- 5977 rooms
- 7668 rooms
- 7789+ rooms

- Rooms in renter-occupied apartments in Columbus, Mississippi
- 1401 room
- 952 rooms
- 5923 rooms
- 1,6164 rooms
- 1,3885 rooms
- 9656 rooms
- 4867 rooms
- 1328 rooms
- 159+ rooms


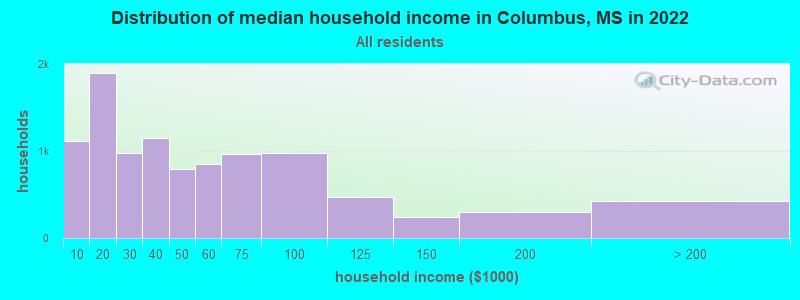
Columbus, MS household income distribution

- 1,111Less than $10,000
- 1,892$10,000 to $19,999
- 982$20,000 to $29,999
- 1,153$30,000 to $39,999
- 797$40,000 to $49,999
- 848$50,000 to $59,999
- 965$60,000 to $74,999
- 981$75,000 to $99,999
- 469$100,000 to $124,999
- 243$125,000 to $149,999
- 294$150,000 to $199,999
- 422$200,000 or more
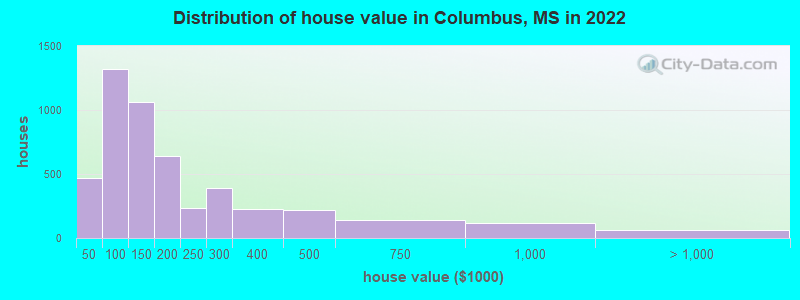
Home value of owner - occupied houses in 2022 in Columbus, MS
-
- 99Less than $10,000
- 7$15,000 to $19,999
- 30$20,000 to $24,999
- 51$25,000 to $29,999
- 26$30,000 to $34,999
- 44$35,000 to $39,999
- 209$40,000 to $49,999
- 289$50,000 to $59,999
- 131$60,000 to $69,999
- 237$70,000 to $79,999
- 319$80,000 to $89,999
- 129$90,000 to $99,999
- 802$100,000 to $124,999
- 262$125,000 to $149,999
- 393$150,000 to $174,999
- 250$175,000 to $199,999
- 233$200,000 to $249,999
- 394$250,000 to $299,999
- 227$300,000 to $399,999
- 218$400,000 to $499,999
- 141$500,000 to $749,999
- 113$750,000 to $999,999
- 11$1,000,000 to $1,499,999
- 51$2,000,000 or more
Rent paid by renters in 2022 in Columbus, MS
-
- 94Less than $100
- 115$100 to $149
- 142$150 to $199
- 26$200 to $249
- 81$250 to $299
- 155$300 to $349
- 232$350 to $399
- 241$400 to $449
- 331$450 to $499
- 445$500 to $549
- 312$550 to $599
- 606$600 to $649
- 407$650 to $699
- 237$700 to $749
- 307$750 to $799
- 276$800 to $899
- 162$900 to $999
- 257$1,000 to $1,249
- 233$1,250 to $1,499
- 39$1,500 to $1,999
- 11$2,000 to $2,499
- 10$2,500 to $2,999
- 581No cash rent

Percentage of workers working in this county: 81.3%
Number of people working at home: 604 (6.5% of all workers)
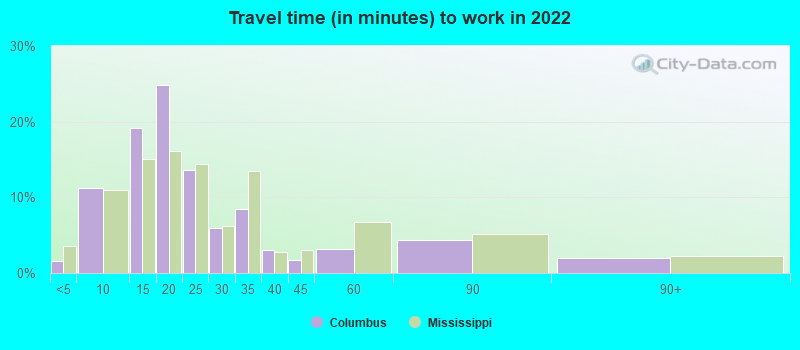
Travel time to work (commute)
- Less than 5 minutes: 229
- 5 to 9 minutes: 1,244
- 10 to 14 minutes: 2,266
- 15 to 19 minutes: 2,029
- 20 to 24 minutes: 940
- 25 to 29 minutes: 640
- 30 to 34 minutes: 453
- 35 to 39 minutes: 53
- 40 to 44 minutes: 32
- 45 to 59 minutes: 83
- 60 to 89 minutes: 364
- 90 or more minutes: 258
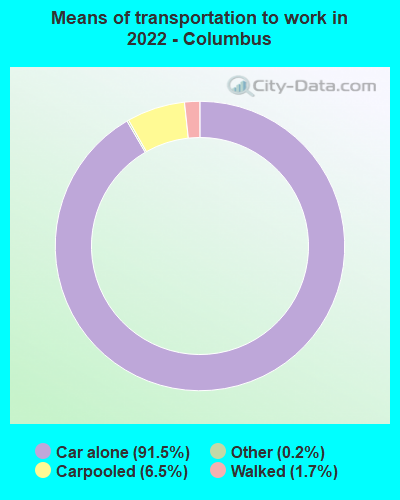
Means of transportation to work:
- Drove a car alone: 14,666 (86.8%)
- Carpooled: 1,151 (6.8%)
- Ferryboat: 25 (0.1%)
- Taxi: 31 (0.2%)
- Bicycle: 8 (0.0%)
- Walked: 333 (2.0%)
- Worked at home: 604 (3.6%)
- Unemployment by race in 2022
- Unemployment rate for White non-Hispanic residents
- 2.2%Males
- 3.4%Females
- Unemployment rate for Black residents
- 4.5%Males
- 14.0%Females
- Unemployment rate for two or more race residents
- 6.8%Males
- 14.8%Females

- Year of entry for the foreign-born population in Columbus, Mississippi
- 2092010 or later
- 652000 to 2009
- 211990 to 1999
- 361980 to 1989
- 391970 to 1979
- 90Before 1970

First ancestries reported:
- English: 1,488 (9.1%)
- American: 1,093 (6.7%)
- Irish: 396 (2.4%)
- Jamaican: 118 (0.7%)
- German: 111 (0.7%)
- European: 108 (0.7%)
- Scotch-Irish: 53 (0.3%)
- Czech: 48 (0.3%)
- Scottish: 45 (0.3%)
- French: 38 (0.2%)
- British: 19 (0.1%)
- Italian: 18 (0.1%)
- Swedish: 15 (0.09%)
- Brazilian: 11 (0.07%)
- Norwegian: 11 (0.07%)
- African: 11 (0.07%)
- Russian: 5 (0.03%)
Most common places of birth for foreign-born residents (%):
| Columbus: | 23.6% (130) |
| Mississippi: | 25.4% (17,354) |
| Columbus: | 21.3% (117) |
| Mississippi: | 6.3% (4,325) |
| Columbus: | 12.0% (66) |
| Mississippi: | 1.5% (1,043) |
| Columbus: | 6.2% (34) |
| Mississippi: | 0.2% (127) |
| Columbus: | 5.1% (28) |
| Mississippi: | 4.7% (3,211) |
| Columbus: | 4.5% (25) |
| Mississippi: | 0.2% (154) |
| Columbus: | 3.8% (21) |
| Mississippi: | 0.8% (518) |
| Columbus: | 3.1% (17) |
| Mississippi: | 4.3% (2,948) |
| Columbus: | 2.9% (16) |
| Mississippi: | 0.1% (56) |
| Columbus: | 2.7% (15) |
| Mississippi: | 5.8% (3,948) |
| Columbus: | 2.4% (13) |
| Mississippi: | 0.4% (259) |
| Columbus: | 2.2% (12) |
| Mississippi: | 1.3% (899) |
| Columbus: | 2.2% (12) |
| Mississippi: | 0.8% (556) |
Place of birth for U.S.-born residents:
- This state: 17,561
- Other state: 5,526
- Northeast: 380
- Midwest: 1,518
- South: 3,331
- West: 268
83.9% of Columbus residents lived in the same house 1 years ago.
Out of people who lived in different houses, 36.1% lived in this county.
Out of people who lived in different counties, 57.5% lived in Mississippi.
| Columbus: | 83.9% |
| State average: | 88.9% |
Education attainment for males 25 years and older:
- No schooling: 88
- Nursery to 4th grade: 0
- 5th and 6th grade: 60
- 7th and 8th grade: 147
- 9th grade: 103
- 10th grade: 160
- 11th grade: 294
- 12th grade, no diploma: 68
- High school graduate (or equivalency): 2,574
- Less than 1 year of college: 499
- Some college more than 1 year, no degree: 1,169
- Associate degree: 357
- Bachelor's degree: 711
- Master's degree: 583
- Professional school degree: 307
- Doctorate degree: 120

Education attainment for females 25 years and older:
- No schooling: 241
- Nursery to 4th grade: 24
- 5th and 6th grade: 55
- 7th and 8th grade: 172
- 9th grade: 115
- 10th grade: 129
- 11th grade: 237
- 12th grade, no diploma: 79
- High school graduate (or equivalency): 2,817
- Less than 1 year of college: 441
- Some college more than 1 year, no degree: 1,336
- Associate degree: 850
- Bachelor's degree: 1,528
- Master's degree: 679
- Professional school degree: 85
- Doctorate degree: 79


Housing units in structures:
- One, detached: 7,880
- One, attached: 129
- Two: 936
- 3 or 4: 557
- 5 to 9: 1,426
- 10 to 19: 578
- 20 to 49: 118
- 50 or more: 179
- Mobile homes: 275
Median worth of mobile homes: $43,403
Housing units lacking complete kitchen facilities in 2022: 6.6%
House/condo owner moved in on average 17 years ago
Renter moved in on average 3 years ago

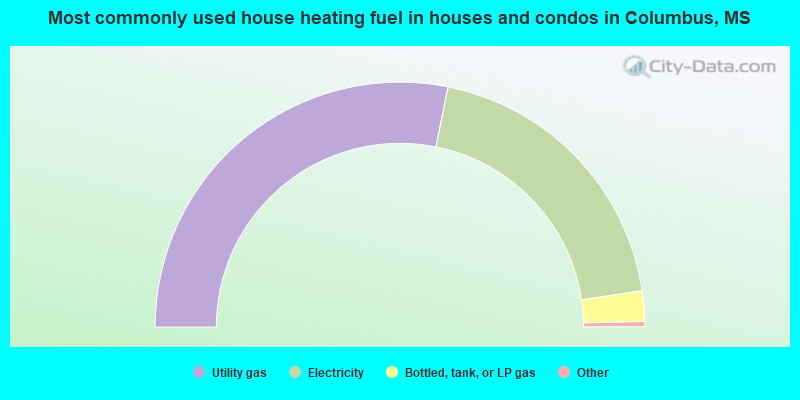
- 56.3%Utility gas
- 39.0%Electricity
- 4.0%Bottled, tank, or LP gas
- 0.3%No fuel used
- 0.2%Fuel oil, kerosene, etc.
- 0.2%Wood
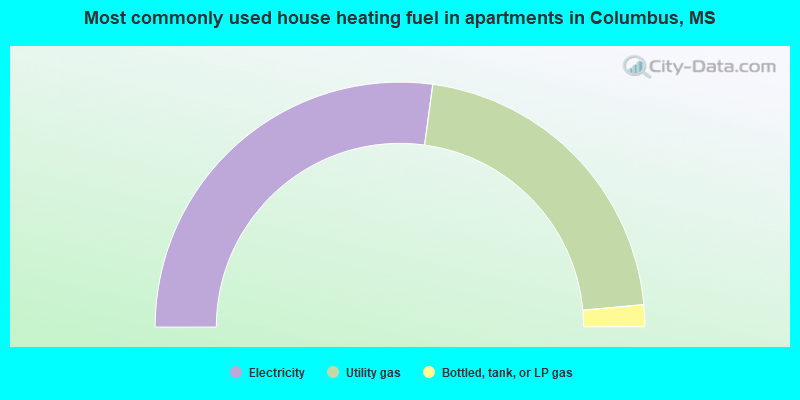
- 54.3%Electricity
- 42.8%Utility gas
- 2.9%Bottled, tank, or LP gas
Private vs. public school enrollment:
| Here: | 4.7% |
| Mississippi: | 16.1% |
| Here: | 10.2% |
| Mississippi: | 14.6% |
| Here: | 8.6% |
| Mississippi: | 12.8% |


