Columbine, CO (Colorado) Houses and Residents
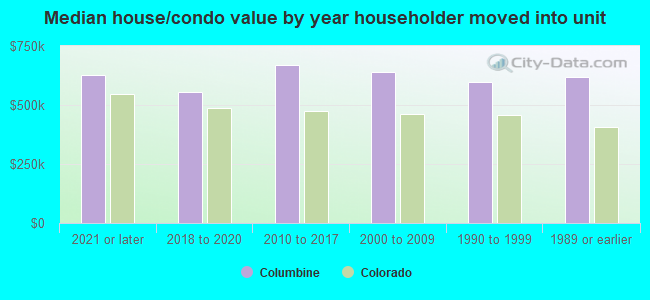
| Columbine: | $629,002 |
| Colorado: | $531,100 |
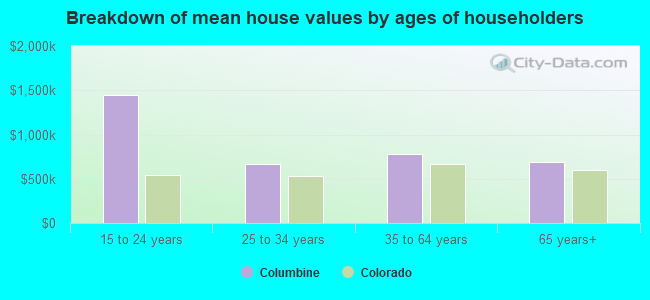
Mean price in 2022:
Detached houses: $733,063
Here: $733,063 State: $676,667 Townhouses or other attached units: $467,881
Here: $467,881 State: $526,340 In 3-to-4-unit structures: $530,104
Here: $530,104 State: $385,502 In 5-or-more-unit structures: $308,679
Here: $308,679 State: $417,586 Mobile homes: $177,855
Here: $177,855 State: $115,510
Total population: 24,280 (Urban population: 24,051, Rural population: 0)
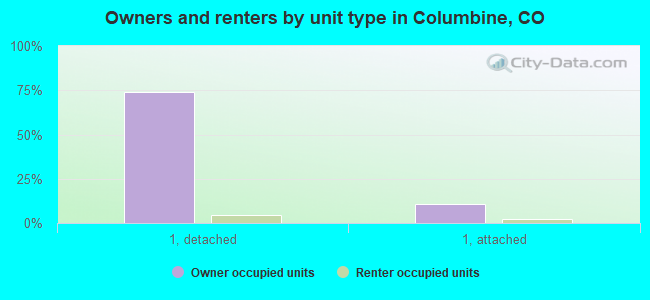
Houses: 10,098 (9,854 occupied: 8,653 owner occupied, 1,124 renter occupied)
| % of renters here: | 11% |
| State: | 34% |
Housing density: 1,521 houses/condos per square mile
Median price asked for vacant for-sale houses and condos in 2022: $666,772.
Median contract rent in 2022: over $2,000 (lower quartile is $1,736, upper quartile is over $2,000)
Median rent asked for vacant for-rent units in 2022: $3,878
Median gross rent in Columbine, CO in 2022: over $2,000
Housing units in Columbine with a mortgage: 6,157 (790 second mortgage, 21 home equity loan, 735 both second mortgage and home equity loan)
Houses without a mortgage: 173
Median household income for houses/condos with a mortgage: $147,537
Median household income for apartments without a mortgage: $88,954
Median monthly housing costs: $2,001
Compare current foreclosures near Columbine, CO:
| Photo | Address | Area | Beds / Baths | Price | Details |
|---|---|---|---|---|---|

|
#1
S Columbine Dr
Morrison, CO 80465
|
2,280 sq. feet
|
2 baths 3 beds |
$529,900
|
show details |

|
#2
Curtis St
Denver, CO 80205
|
822 sq. feet
|
3 baths 4 beds |
$499,900
|
show details |

|
#3
E Kentucky Ave Unit D
Denver, CO 80246
|
745 sq. feet
|
1 baths 2 beds |
show details | |

|
#4
S Memphis Way Apt K
Aurora, CO 80017
|
706 sq. feet
|
1 baths 1 beds |
show details | |

|
#5
S Fillmore Cir
Littleton, CO 80122
|
1,036 sq. feet
|
3 baths 3 beds |
show details | |

|
#6
W Alaska Pl
Denver, CO 80219
|
1,646 sq. feet
|
2 baths 2 beds |
show details | |

|
#7
Anaconda Ct
Castle Rock, CO 80108
|
3,788 sq. feet
|
4 baths 4 beds |
show details | |

|
#8
W Hampden Ave
Denver, CO 80227
|
922 sq. feet
|
1 baths 2 beds |
show details | |

|
#9
Neville Ln
Golden, CO 80401
|
2,655 sq. feet
|
4 baths 4 beds |
show details | |

|
#10
S Newland St
Denver, CO 80227
|
1,760 sq. feet
|
2 baths 2 beds |
show details |
| Photo | Address | Area | Beds / Baths | Price | Details |
|---|---|---|---|---|---|

|
#11
Charissglen Ln
Littleton, CO 80126
|
4,450 sq. feet
|
3 baths 4 beds |
show details | |

|
#12
S Upham St
Denver, CO 80227
|
2,750 sq. feet
|
3 baths 3 beds |
show details | |

|
#13
S Pitkin Cir
Aurora, CO 80013
|
1,320 sq. feet
|
2 baths 3 beds |
show details | |

|
#14
Vivian Ct
Arvada, CO 80004
|
1,463 sq. feet
|
1 baths 3 beds |
show details | |

|
#15
Dover St
Wheat Ridge, CO 80033
|
3,400 sq. feet
|
3 baths 5 beds |
show details | |

|
#16
W 61st Ave
Arvada, CO 80004
|
1,183 sq. feet
|
1 baths 5 beds |
show details | |

|
#17
S Fox St
Englewood, CO 80110
|
1,584 sq. feet
|
2 baths 4 beds |
show details | |

|
#18
S Joplin Way
Aurora, CO 80013
|
1,132 sq. feet
|
2 baths 3 beds |
show details | |

|
#19
W 64th Ave
Arvada, CO 80003
|
1,109 sq. feet
|
2 baths 3 beds |
show details | |

|
#20
E Temple Dr
Aurora, CO 80015
|
858 sq. feet
|
1 baths 3 beds |
show details |
| Photo | Address | Area | Beds / Baths | Price | Details |
|---|---|---|---|---|---|

|
#21
S Jasper Way
Aurora, CO 80013
|
1,036 sq. feet
|
1 baths 2 beds |
show details | |

|
#22
S Stuart St
Denver, CO 80219
|
639 sq. feet
|
1 baths 2 beds |
show details | |

|
#23
Lewis St
Arvada, CO 80004
|
1,402 sq. feet
|
1 baths 3 beds |
show details | |

|
#24
Florence St
Aurora, CO 80010
|
725 sq. feet
|
1 baths 2 beds |
show details | |

|
#25
S Depew St
Denver, CO 80226
|
1,097 sq. feet
|
1 baths 4 beds |
show details | |

|
#26
S Kalispell Ct
Englewood, CO 80112
|
1,240 sq. feet
|
2 baths 3 beds |
show details | |

|
#27
S Galapago St
Englewood, CO 80110
|
1,040 sq. feet
|
2 baths 3 beds |
show details | |

|
#28
Soapstone Way
Castle Rock, CO 80108
|
3,750 sq. feet
|
4 baths 5 beds |
show details | |

|
#29
E 2nd Ave # 101c
Aurora, CO 80011
|
982 sq. feet
|
2 baths 2 beds |
show details | |

|
#30
E Harvard Ave
Aurora, CO 80013
|
1,279 sq. feet
|
2 baths 3 beds |
show details |
| Photo | Address | Area | Beds / Baths | Price | Details |
|---|---|---|---|---|---|

|
#31
16th St Apt 504
Denver, CO 80202
|
708 sq. feet
|
1 baths 1 beds |
show details | |

|
#32
Eaton St
Arvada, CO 80003
|
1,346 sq. feet
|
2 baths 3 beds |
show details | |

|
#33
S Elmira St Apt 10
Denver, CO 80231
|
3,043 sq. feet
|
3 baths 3 beds |
show details | |

|
#34
E Eastman Pl
Aurora, CO 80013
|
1,526 sq. feet
|
2 baths 3 beds |
show details | |

|
#35
W 65th Pl
Denver, CO 80221
|
1,491 sq. feet
|
2 baths 3 beds |
show details | |

|
#36
Scranton St
Aurora, CO 80011
|
1,092 sq. feet
|
2 baths 3 beds |
show details | |

|
#37
E Asbury Ave
Aurora, CO 80013
|
1,646 sq. feet
|
3 baths 3 beds |
show details | |

|
#38
Bucknell Cir
Littleton, CO 80129
|
1,592 sq. feet
|
3 baths 3 beds |
show details | |

|
#39
Quaker St
Golden, CO 80401
|
660 sq. feet
|
1 baths 1 beds |
show details | |

|
#40
S Nelson St
Denver, CO 80226
|
1,213 sq. feet
|
2 baths 4 beds |
show details |
| Photo | Address | Area | Beds / Baths | Price | Details |
|---|---|---|---|---|---|

|
#41
W 29th Ave
Denver, CO 80215
|
1,388 sq. feet
|
3 baths 5 beds |
show details | |

|
#42
Newton St
Arvada, CO 80003
|
2,392 sq. feet
|
4 baths 4 beds |
show details | |

|
#43
Fenton St
Arvada, CO 80003
|
1,306 sq. feet
|
2 baths 3 beds |
show details | |

|
#44
Glengate Cir
Littleton, CO 80130
|
3,342 sq. feet
|
4 baths 3 beds |
show details | |

|
#45
Norfolk Pl
Castle Rock, CO 80108
|
2,478 sq. feet
|
3 baths 3 beds |
show details | |

|
#46
E Davies Pl
Englewood, CO 80112
|
1,116 sq. feet
|
2 baths 4 beds |
show details | |

|
#47
S Akron Way
Denver, CO 80247
|
2,663 sq. feet
|
2 baths 3 beds |
show details | |

|
#48
Vaughn St
Aurora, CO 80011
|
1,421 sq. feet
|
2 baths 3 beds |
show details | |

|
#49
S Harlan St Unit 171
Denver, CO 80235
|
983 sq. feet
|
2 baths 2 beds |
show details | |

|
Check over 1 million property listings on Foreclosure.com!
|
browse all offers | |||

Latest news about housing in Columbine, CO collected exclusively by city-data.com from local newspapers, TV, and radio stations

 | Peace Out Denver: Review of 10 years living on the Front Range (66 replies) |
| Best steakhouse, east-ish? (30 replies) |
| Denver Real Estate Discussion / Opinion Thread (NO Data Charts) (1076 replies) |
| Denver Real Estate News (Data and Charts only) (425 replies) |
| Littleton? Highlands Ranch? Centennial? (11 replies) |
| BOLO: if you see this woman, contact the authorities (64 replies) |

Median year apartment built: 1987
Household type by relationship:
Households: 25,744- Male householders: 5,000 (650 living alone), Female householders: 4,581 (1,042 living alone)
6,043 spouses (5,983 opposite-sex spouses), 557 unmarried partners, (522 opposite-sex unmarried partners), 7,667 children (7,241 natural, 216 adopted, 209 stepchildren), 354 grandchildren, 219 brothers or sisters, 95 parents, 0 foster children, 564 other relatives, 520 non-relatives
- In group quarters: 140
Size of family households: 3,583 2-persons, 1,767 3-persons, 1,269 4-persons, 362 5-persons, 340 6-persons, 90 7-or-more-persons.
Size of nonfamily households: 1,778 1-person, 381 2-persons, 41 3-persons, 44 4-persons.
4,195 married couples with children.
991 single-parent households (541 men, 450 women).
95.0% of residents of Columbine speak English at home.
1.9% of residents speak Spanish at home (82% speak English very well, 5% speak English well, 13% speak English not well).
1.9% of residents speak other Indo-European language at home (89% speak English very well, 8% speak English well, 3% speak English not well).
0.6% of residents speak Asian or Pacific Island language at home (59% speak English very well, 24% speak English well, 16% speak English not well).
1.1% of residents speak other language at home (30% speak English very well, 70% speak English not well).
Foreign born population: 987 (3.8%)
(93.3% of them are naturalized citizens)
| Here: | 7.8 |
| State: | 6.8 |
| Here: | 5.6 |
| State: | 4.0 |
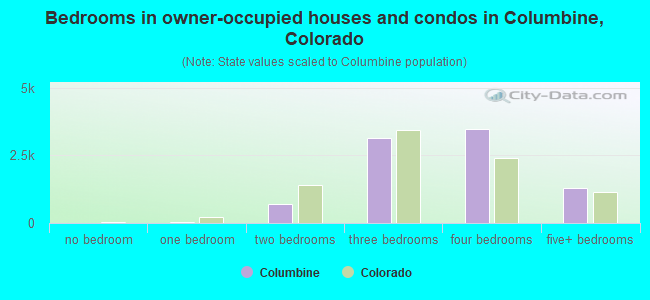
- Bedrooms in owner-occupied houses and condos in Columbine, Colorado
- 0no bedroom
- 441 bedroom
- 6992 bedrooms
- 3,1353 bedrooms
- 3,4734 bedrooms
- 1,3035+ bedrooms
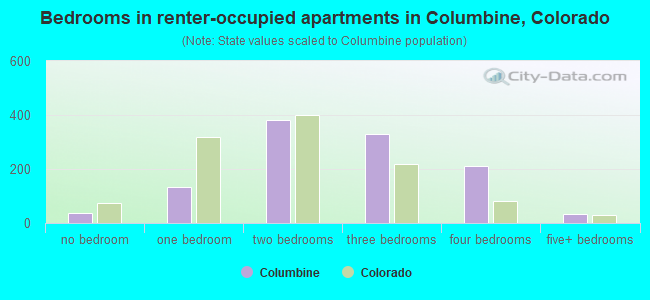
- Bedrooms in renter-occupied apartments in Columbine, Colorado
- 37no bedroom
- 1341 bedroom
- 3802 bedrooms
- 3303 bedrooms
- 2114 bedrooms
- 325+ bedrooms
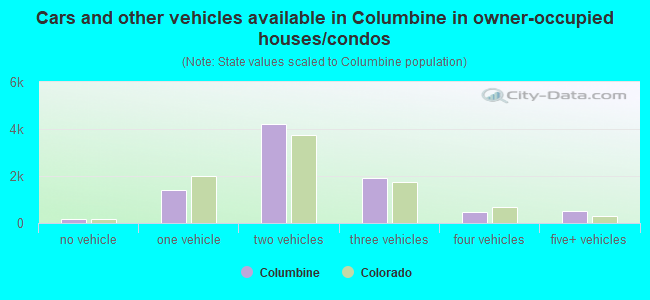
- Cars and other vehicles available in Columbine in owner-occupied houses/condos
- 158no vehicle
- 1,4071 vehicle
- 4,2082 vehicles
- 1,9243 vehicles
- 4624 vehicles
- 4945+ vehicles
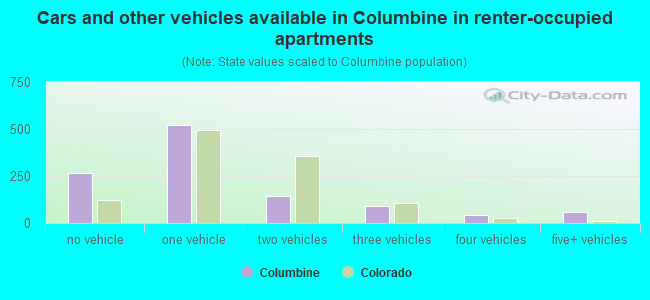
- Cars and other vehicles available in Columbine in renter-occupied apartments
- 264no vehicle
- 5231 vehicle
- 1462 vehicles
- 923 vehicles
- 424 vehicles
- 585+ vehicles
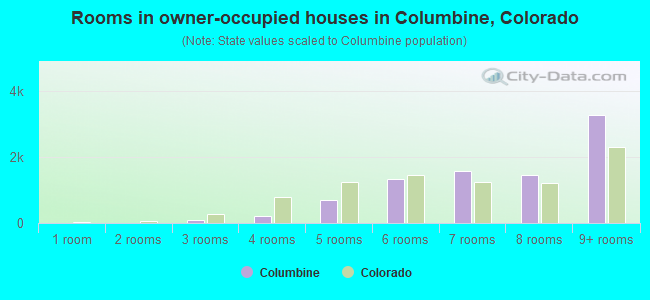
- Rooms in owner-occupied houses in Columbine, Colorado
- 01 room
- 02 rooms
- 983 rooms
- 2074 rooms
- 6895 rooms
- 1,3266 rooms
- 1,5867 rooms
- 1,4648 rooms
- 3,2839+ rooms
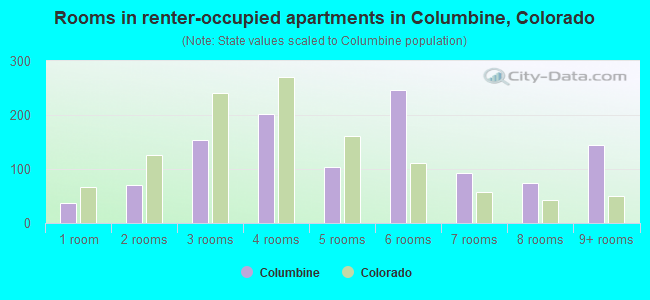
- Rooms in renter-occupied apartments in Columbine, Colorado
- 371 room
- 712 rooms
- 1543 rooms
- 2014 rooms
- 1045 rooms
- 2466 rooms
- 937 rooms
- 748 rooms
- 1449+ rooms
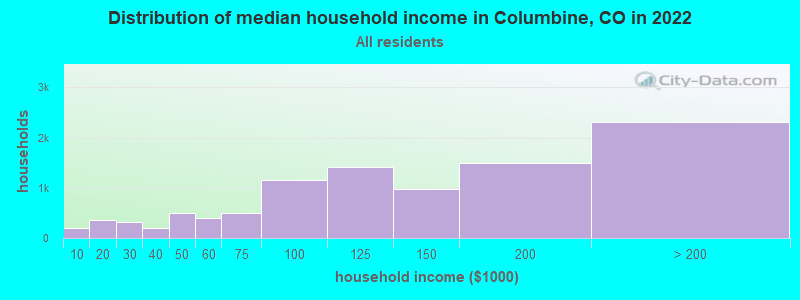
Columbine, CO household income distribution

- 195Less than $10,000
- 355$10,000 to $19,999
- 325$20,000 to $29,999
- 199$30,000 to $39,999
- 491$40,000 to $49,999
- 396$50,000 to $59,999
- 495$60,000 to $74,999
- 1,151$75,000 to $99,999
- 1,413$100,000 to $124,999
- 970$125,000 to $149,999
- 1,483$150,000 to $199,999
- 2,309$200,000 or more
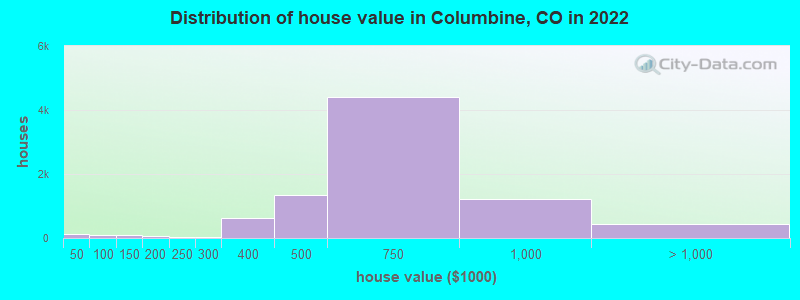
Home value of owner - occupied houses in 2022 in Columbine, CO
-
- 92Less than $10,000
- 11$20,000 to $24,999
- 7$40,000 to $49,999
- 43$50,000 to $59,999
- 34$80,000 to $89,999
- 7$90,000 to $99,999
- 67$100,000 to $124,999
- 12$125,000 to $149,999
- 69$150,000 to $174,999
- 5$175,000 to $199,999
- 23$200,000 to $249,999
- 46$250,000 to $299,999
- 633$300,000 to $399,999
- 1,350$400,000 to $499,999
- 4,392$500,000 to $749,999
- 1,227$750,000 to $999,999
- 260$1,000,000 to $1,499,999
- 86$1,500,000 to $1,999,999
- 76$2,000,000 or more
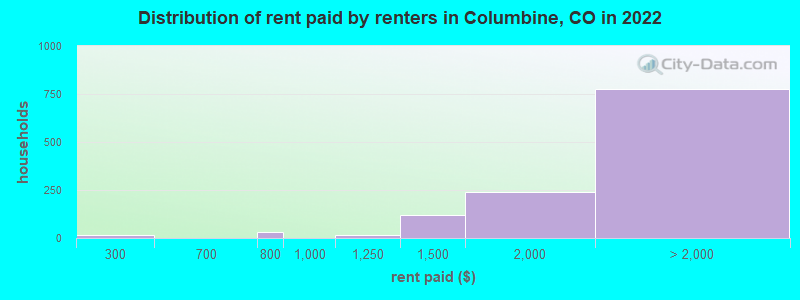
Rent paid by renters in 2022 in Columbine, CO
-
- 16$250 to $299
- 30$700 to $749
- 16$1,000 to $1,249
- 117$1,250 to $1,499
- 236$1,500 to $1,999
- 444$2,000 to $2,499
- 219$2,500 to $2,999
- 67$3,500 or more
- 44No cash rent
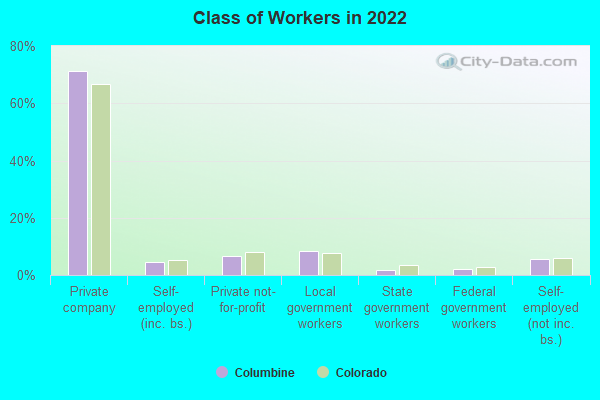
Percentage of workers working in this county: 57.1%
Number of people working at home: 2,876 (21.6% of all workers)
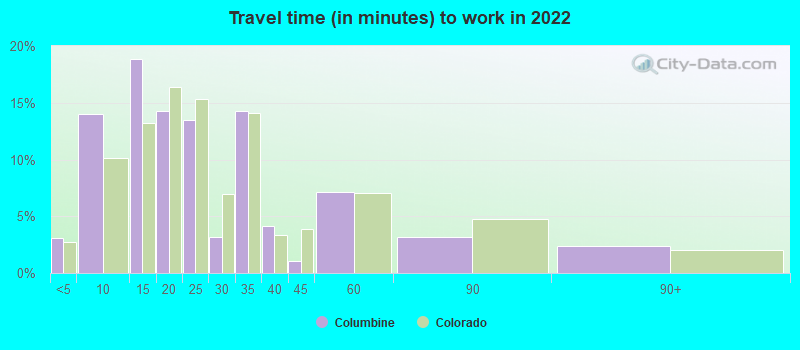
Travel time to work (commute)
- Less than 5 minutes: 172
- 5 to 9 minutes: 719
- 10 to 14 minutes: 1,401
- 15 to 19 minutes: 1,685
- 20 to 24 minutes: 1,232
- 25 to 29 minutes: 745
- 30 to 34 minutes: 2,066
- 35 to 39 minutes: 403
- 40 to 44 minutes: 538
- 45 to 59 minutes: 756
- 60 to 89 minutes: 340
- 90 or more minutes: 191
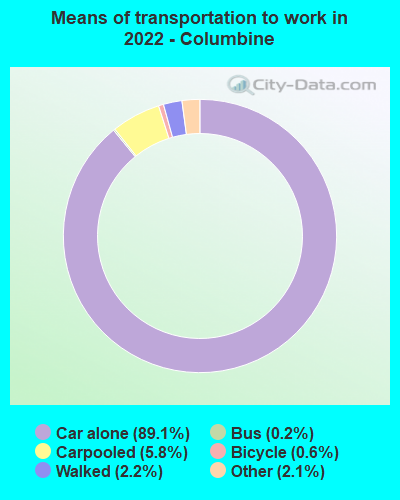
Means of transportation to work:
- Drove a car alone: 3,728 (54.8%)
- Carpooled: 238 (3.5%)
- Bus: 10 (0.1%)
- Taxi: 100 (1.5%)
- Bicycle: 14 (0.2%)
- Walked: 90 (1.3%)
- Worked at home: 2,876 (42.3%)
- Unemployment by race in 2022
- Unemployment rate for White non-Hispanic residents
- 3.4%Males
- 2.8%Females
- Unemployment rate for two or more race residents
- 1.8%Males
- Unemployment rate for Hispanic or Latino residents
- 2.6%Males
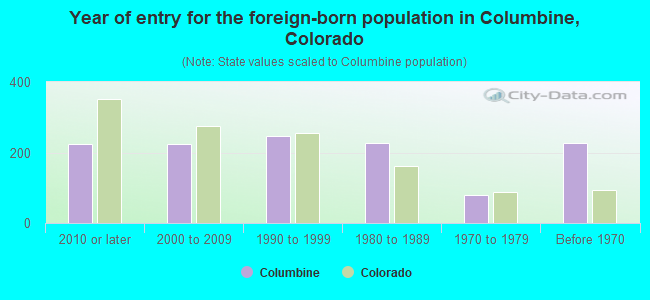
- Year of entry for the foreign-born population in Columbine, Colorado
- 2232010 or later
- 2252000 to 2009
- 2471990 to 1999
- 2271980 to 1989
- 801970 to 1979
- 227Before 1970
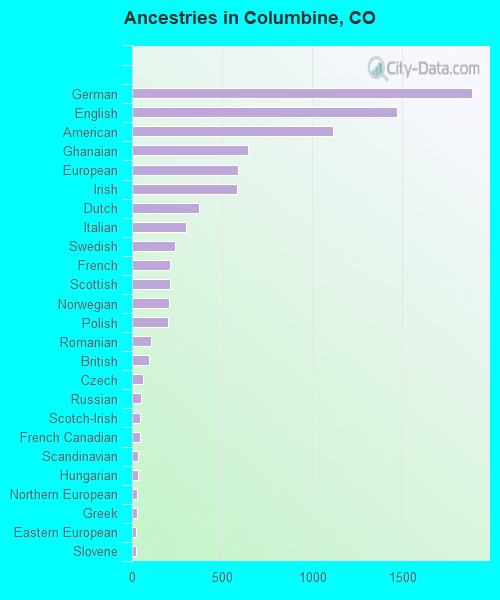
First ancestries reported:
- German: 1,886 (17.7%)
- English: 1,471 (13.8%)
- American: 1,114 (10.5%)
- Ghanaian: 646 (6.1%)
- European: 589 (5.5%)
- Irish: 582 (5.5%)
- Dutch: 371 (3.5%)
- Italian: 297 (2.8%)
- Swedish: 237 (2.2%)
- French: 213 (2.0%)
- Scottish: 212 (2.0%)
- Norwegian: 205 (1.9%)
- Polish: 197 (1.9%)
- Romanian: 105 (1.0%)
- British: 92 (0.9%)
- Czech: 63 (0.6%)
- Russian: 48 (0.5%)
- Scotch-Irish: 47 (0.4%)
- French Canadian: 43 (0.4%)
- Scandinavian: 36 (0.3%)
- Hungarian: 35 (0.3%)
- Northern European: 29 (0.3%)
- Greek: 27 (0.3%)
- Eastern European: 23 (0.2%)
- Slovene: 22 (0.2%)
- Ukrainian: 22 (0.2%)
- Austrian: 16 (0.2%)
- Armenian: 13 (0.1%)
- African: 11 (0.1%)
- Icelander: 9 (0.08%)
- Canadian: 9 (0.08%)
- Slavic: 8 (0.08%)
- Iranian: 8 (0.08%)
- Assyrian: 8 (0.08%)
- Latvian: 7 (0.07%)
- Australian: 7 (0.07%)
- Swiss: 7 (0.07%)
- Croatian: 6 (0.06%)
- Danish: 5 (0.05%)
- Welsh: 3 (0.03%)
Most common places of birth for foreign-born residents (%):
| Columbine: | 32.2% (352) |
| Colorado: | 0.7% (3,596) |
| Columbine: | 10.0% (109) |
| Colorado: | 2.5% (13,706) |
| Columbine: | 9.4% (103) |
| Colorado: | 2.7% (15,026) |
| Columbine: | 8.7% (95) |
| Colorado: | 0.3% (1,615) |
| Columbine: | 7.8% (85) |
| Colorado: | 38.3% (209,491) |
| Columbine: | 6.9% (75) |
| Colorado: | 0.5% (2,620) |
| Columbine: | 4.8% (52) |
| Colorado: | 2.3% (12,342) |
| Columbine: | 3.5% (38) |
| Colorado: | 3.3% (17,998) |
| Columbine: | 3.3% (36) |
| Colorado: | 0.3% (1,849) |
| Columbine: | 3.3% (36) |
| Colorado: | 3.0% (16,616) |
| Columbine: | 2.4% (26) |
| Colorado: | 0.2% (823) |
| Columbine: | 2.3% (25) |
| Colorado: | 2.2% (12,150) |
| Columbine: | 1.7% (19) |
| Colorado: | 0.7% (3,563) |
| Columbine: | 1.7% (19) |
| Colorado: | 0.6% (3,144) |
Place of birth for U.S.-born residents:
- This state: 12,488
- Other state: 12,085
- Northeast: 1,486
- Midwest: 5,397
- South: 2,246
- West: 2,932
91.8% of Columbine residents lived in the same house 1 years ago.
Out of people who lived in different houses, 33.0% lived in this county.
Out of people who lived in different counties, 66.5% lived in Colorado.
| Columbine: | 91.8% |
| State average: | 83.6% |
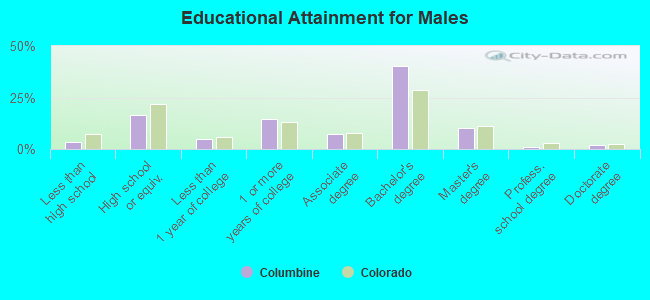
Education attainment for males 25 years and older:
- No schooling: 107
- Nursery to 4th grade: 10
- 5th and 6th grade: 0
- 7th and 8th grade: 0
- 9th grade: 46
- 10th grade: 0
- 11th grade: 60
- 12th grade, no diploma: 89
- High school graduate (or equivalency): 1,484
- Less than 1 year of college: 428
- Some college more than 1 year, no degree: 1,331
- Associate degree: 662
- Bachelor's degree: 3,633
- Master's degree: 943
- Professional school degree: 84
- Doctorate degree: 173
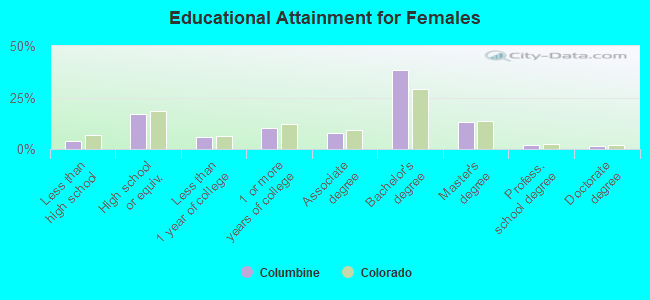
Education attainment for females 25 years and older:
- No schooling: 227
- Nursery to 4th grade: 0
- 5th and 6th grade: 0
- 7th and 8th grade: 15
- 9th grade: 0
- 10th grade: 27
- 11th grade: 23
- 12th grade, no diploma: 88
- High school graduate (or equivalency): 1,630
- Less than 1 year of college: 547
- Some college more than 1 year, no degree: 973
- Associate degree: 732
- Bachelor's degree: 3,640
- Master's degree: 1,264
- Professional school degree: 170
- Doctorate degree: 142


Housing units in structures:
- One, detached: 8,019
- One, attached: 1,054
- 3 or 4: 180
- 5 to 9: 259
- 10 to 19: 165
- 20 to 49: 161
- 50 or more: 217
- Mobile homes: 20
- Boats, RVs, vans, etc.: 20
Housing units lacking complete kitchen facilities in 2022: 1.0%
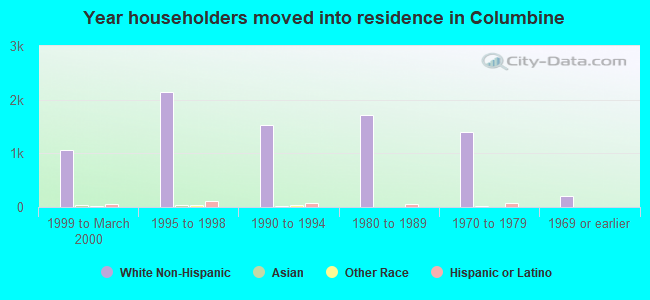
House/condo owner moved in on average 10 years ago
Renter moved in on average 5 years ago
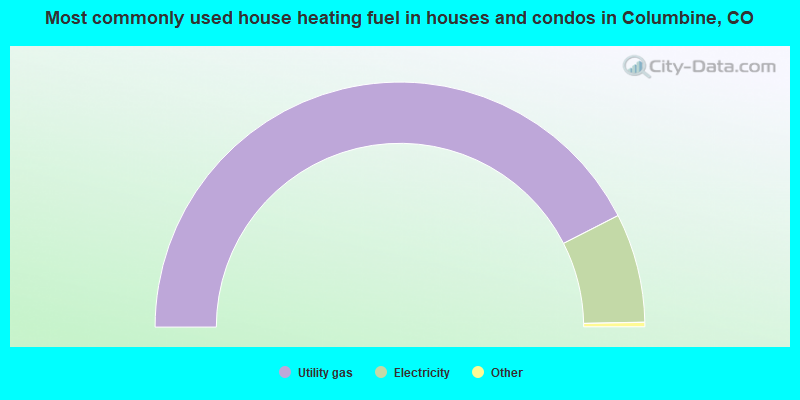
- 84.9%Utility gas
- 14.4%Electricity
- 0.3%Bottled, tank, or LP gas
- 0.2%Other fuel
- 0.1%Solar energy
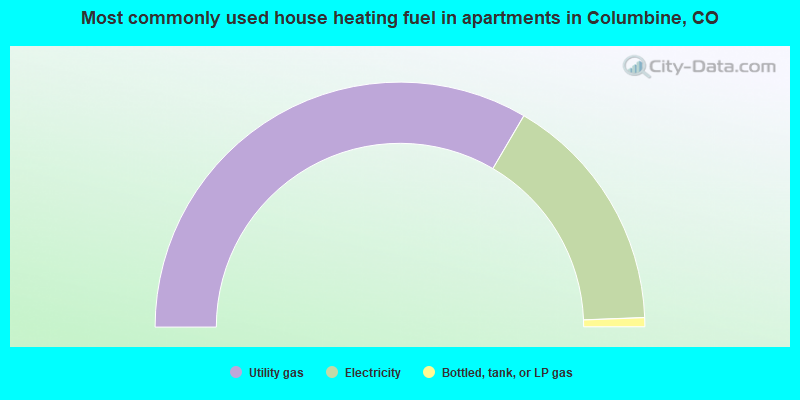
- 66.9%Utility gas
- 31.9%Electricity
- 1.2%Bottled, tank, or LP gas
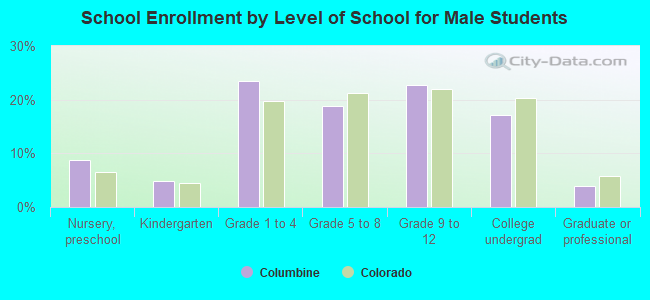
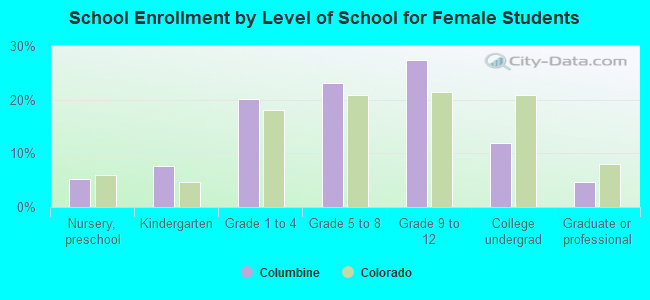
Private vs. public school enrollment:
| Here: | 17.1% |
| Colorado: | 11.4% |
| Here: | 7.8% |
| Colorado: | 8.5% |
| Here: | 9.2% |
| Colorado: | 14.0% |