Columbia, MO (Missouri) Houses and Residents
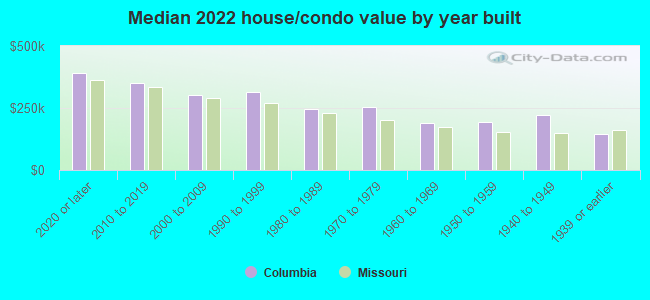
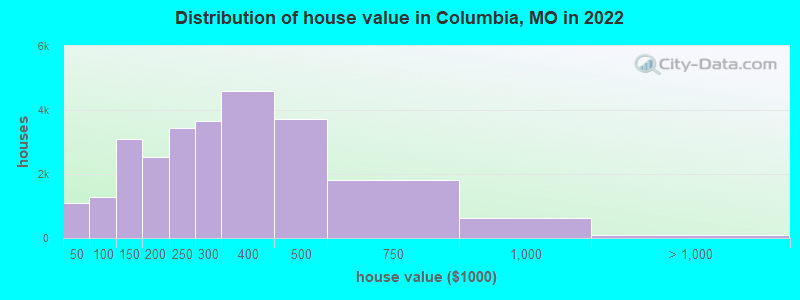
Estimated median house or condo value in 2022: $271,800 (it was $110,700 in 2000 )
Columbia:
$271,800Missouri:
$221,200
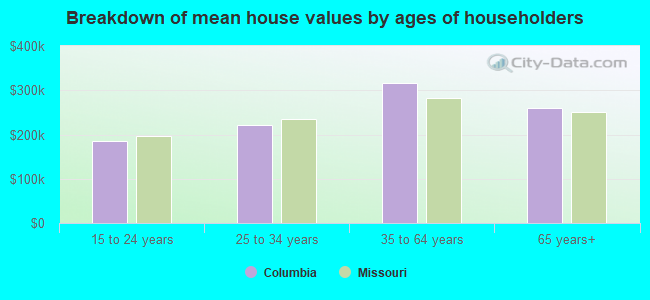
Lower value quartile - upper value quartile: $178,300 - $395,800Mean price in 2022: Detached houses: $318,488 Here:
$318,488State:
$278,068
Townhouses or other attached units: $328,323 Here:
$328,323State:
$260,773
In 2-unit structures: $89,792 Here:
$89,792State:
$172,667
In 3-to-4-unit structures: $257,003 Here:
$257,003State:
$181,162
In 5-or-more-unit structures: $233,902 Here:
$233,902State:
$263,082
Mobile homes: $73,645 Here:
$73,645State:
$95,912
Total population: 116,906 (Urban population: 83,798, Rural population: 982 (all nonfarm) )
Houses: 55,962 (52,954 occupied: 25,821 owner occupied, 27,133 renter occupied )
% of renters here:
51%State:
32%
Housing density: 1,055 houses/condos per square mile
Median price asked for vacant for-sale houses and condos in 2022: $211,033.
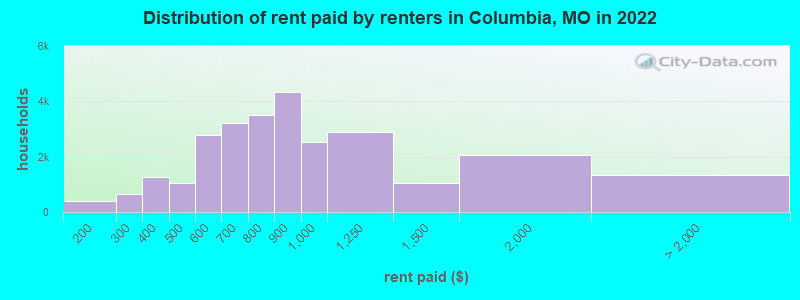
Median contract rent in 2022: $809 (lower quartile is $625, upper quartile is $1,012)
Median rent asked for vacant for-rent units in 2022: $754
Median gross rent in Columbia, MO in 2022: $968
Housing units in Columbia with a mortgage: 15,601 (1,539 second mortgage, 0 home equity loan, 1,193 both second mortgage and home equity loan )Houses without a mortgage: 0
Median household income for houses/condos with a mortgage: $111,973
Median household income for apartments without a mortgage: $61,897
Median monthly housing costs: $997
Data:
Median house or condo value ($)
Median house or condo value ($ change since 2000)
Median house or condo value ($) - White
Median house or condo value ($) - Black or African American
Median house or condo value ($) - Asian
Median house or condo value ($) - Hispanic or Latino
Median house or condo value ($) - American Indian and Alaska Native
Median house or condo value ($) - Multirace
Median house or condo value ($) - Other Race
Median price asked for mobile homes ($)
Household density (households per square mile)
Mean house or condo value by units in structure - 1, detached ($)
Mean house or condo value by units in structure - 1, attached ($)
Mean house or condo value by units in structure - 2 ($)
Mean house or condo value by units in structure by units in structure - 3 or 4 ($)
Mean house or condo value by units in structure - 5 or more ($)
Mean house or condo value by units in structure - Boat, RV, van, etc. ($)
Mean house or condo value by units in structure - Mobile home ($)
Median contract rent ($)
Median contract rent - Lower quartile ($)
Median contract rent - Upper quartile ($)
Median gross rent ($)
Urban houses (%)
Rural houses (%)
Houses occupied (%)
Houses occupied (% change since 2000)
Houses owner occupied (%)
Houses owner occupied (% change since 2000)
Houses renter occupied (%)
Houses renter occupied (% change since 2000)
Vacant housing units - For rent (%)
Vacant housing units - For rent (% change since 2000)
Vacant housing units - For sale only (%)
Vacant housing units - For sale only (% change since 2000)
Vacant housing units - Rented or sold, not occupied (%)
Vacant housing units - Rented or sold, not occupied (% change since 2000)
Vacant housing units - For seasonal, recreational, or occasional use (%)
Vacant housing units - For seasonal, recreational, or occasional use (% change since 2000)
Vacant housing units - For migrant workers (%)
Vacant housing units - For migrant workers (% change since 2000)
Vacant housing units - Other vacant (%)
Vacant housing units - Other vacant (% change since 2000)
Median monthly housing costs ($)
Median household income for houses/condos with a mortgage ($)
Median household income for houses/condos without a mortgage ($)
Median household income ($)
Median household income ($) - White
Median household income ($) - Black or African American
Median household income ($) - Asian
Median household income ($) - Hispanic or Latino
Median household income ($) - American Indian and Alaska Native
Median household income ($) - Multirace
Median household income ($) - Other Race
Mortgage status - with mortgage (%)
Mortgage status - with second mortgage (%)
Mortgage status - with home equity loan (%)
Mortgage status - with both second mortgage and home equity loan (%)
Mortgage status - without a mortgage (%)
Median year house/condo built
Median year apartment built
Household type by relationship - Male householder living alone (%)
Household type by relationship - Male householder not living alone (%)
Household type by relationship - Female householder living alone (%)
Household type by relationship - Female householder not living alone (%)
Household type by relationship - Opposite-Sex spouse (%)
Household type by relationship - Same-Sex spouse (%)
Household type by relationship - Opposite-Sex unmarried partner (%)
Household type by relationship - Same-Sex unmarried partner (%)
Household type by relationship - In group quarters (%)
Size of family households - 2-person household (%)
Size of family households - 3-person household (%)
Size of family households - 4-person household (%)
Size of family households - 5-person household (%)
Size of family households - 6-person household (%)
Size of family households - 7-or-more-person household (%)
Size of nonfamily households - 1-person household (%)
Size of nonfamily households - 2-person household (%)
Size of nonfamily households - 3-person household (%)
Size of nonfamily households - 4-person household (%)
Size of nonfamily households - 5-person household (%)
Size of nonfamily households - 6-person household (%)
Size of nonfamily households - 7-or-moreperson household (%)
Year house built - Built 2010 or later (%)
Year house built - Built 2000 to 2009 (%)
Year house built - Built 1990 to 1999 (%)
Year house built - Built 1980 to 1989 (%)
Year house built - Built 1970 to 1979 (%)
Year house built - Built 1960 to 1969 (%)
Year house built - Built 1950 to 1959 (%)
Year house built - Built 1940 to 1949 (%)
Year house built - Built 1939 or earlier (%)
Median number of rooms in houses and condos
Median number of rooms in apartments
Median number of bedrooms in owner occupied houses
Mean number of bedrooms in owner occupied houses
Median number of bedrooms in renter occupied houses
Mean number of bedrooms in renter occupied houses
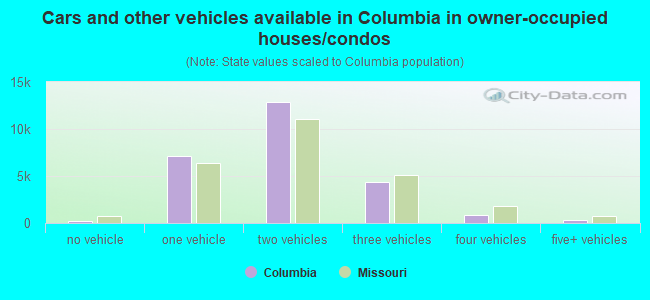
Median number of vehichles in owner occupied houses
Mean number of vehichles in owner occupied houses
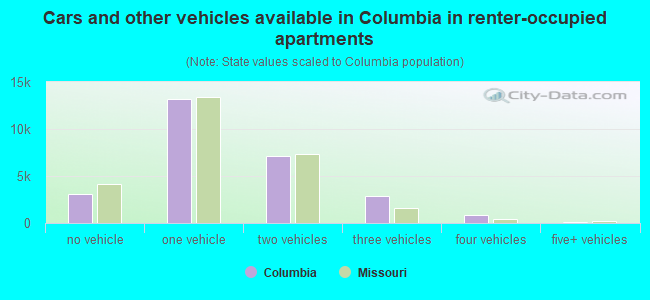
Median number of vehichles in renter occupied houses
Mean number of vehichles in renter occupied houses
Rooms in owner-occupied houses - 1 room (%)
Rooms in owner-occupied houses - 2 rooms (%)
Rooms in owner-occupied houses - 3 rooms (%)
Rooms in owner-occupied houses - 4 rooms (%)
Rooms in owner-occupied houses - 5 rooms (%)
Rooms in owner-occupied houses - 6 rooms (%)
Rooms in owner-occupied houses - 7 rooms (%)
Rooms in owner-occupied houses - 8 rooms (%)
Rooms in owner-occupied houses - 9+ rooms (%)
Rooms in renter-occupied houses - 1 room (%)
Rooms in renter-occupied houses - 2 rooms (%)
Rooms in renter-occupied houses - 3 rooms (%)
Rooms in renter-occupied houses - 4 rooms (%)
Rooms in renter-occupied houses - 5 rooms (%)
Rooms in renter-occupied houses - 6 rooms (%)
Rooms in renter-occupied houses - 7 rooms (%)
Rooms in renter-occupied houses - 8 rooms (%)
Rooms in renter-occupied houses - 9+ rooms (%)
Bedrooms in owner-occupied houses - no bedrooms (%)
Bedrooms in owner-occupied houses - 1 bedroom (%)
Bedrooms in owner-occupied houses - 2 bedrooms (%)
Bedrooms in owner-occupied houses - 3 bedrooms (%)
Bedrooms in owner-occupied houses - 4 bedrooms (%)
Bedrooms in owner-occupied houses - 5+ bedrooms (%)
Bedrooms in renter-occupied houses - no bedrooms (%)
Bedrooms in renter-occupied houses - 1 bedroom (%)
Bedrooms in renter-occupied houses - 2 bedrooms (%)
Bedrooms in renter-occupied houses - 3 bedrooms (%)
Bedrooms in renter-occupied houses - 4 bedrooms (%)
Bedrooms in renter-occupied houses - 5+ bedrooms (%)
Vehicles available in owner-occupied houses - no vehicle available (%)
Vehicles available in owner-occupied houses - 1 vehicle available(%)
Vehicles available in owner-occupied houses - 2 Vehicles available (%)
Vehicles available in owner-occupied houses - 3 Vehicles available (%)
Vehicles available in owner-occupied houses - 4 Vehicles available (%)
Vehicles available in owner-occupied houses - 5+ Vehicles available (%)
Vehicles available in renter-occupied houses - no vehicle available (%)
Vehicles available in renter-occupied houses - 1 vehicle available (%)
Vehicles available in renter-occupied houses - 2 Vehicles available (%)
Vehicles available in renter-occupied houses - 3 Vehicles available (%)
Vehicles available in renter-occupied houses - 4 Vehicles available (%)
Vehicles available in renter-occupied houses - 5+ Vehicles available (%)
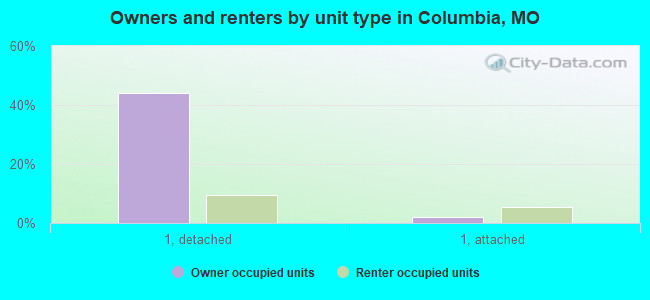
Housing units in structures - 1, detached (%)
Housing units in structures - 1, attached (%)
Housing units in structures - 2 (%)
Housing units in structures - 3 or 4 (%)
Housing units in structures - 5 to 9 (%)
Housing units in structures - 10 to 19 (%)
Housing units in structures - 20 to 49 (%)
Housing units in structures - 50 or more (%)
Housing units in structures - Mobile home (%)
Housing units in structures - Boat, RV, van, etc. (%)
Housing units in structures - Owners - 1, detached (%)
Housing units in structures - Owners - 1, attached (%)
Housing units in structures - Owners - 2 (%)
Housing units in structures - Owners - 3 or 4 (%)
Housing units in structures - Owners - 5 to 9 (%)
Housing units in structures - Owners - 10 to 19 (%)
Housing units in structures - Owners - 20 to 49 (%)
Housing units in structures - Owners - 50 or more (%)
Housing units in structures - Owners - Mobile home (%)
Housing units in structures - Owners - Boat, RV, van, etc. (%)
Housing units in structures - Renters - 1, detached (%)
Housing units in structures - Renters - 1, attached (%)
Housing units in structures - Renters - 2 (%)
Housing units in structures - Renters - 3 or 4 (%)
Housing units in structures - Renters - 5 to 9 (%)
Housing units in structures - Renters - 10 to 19 (%)
Housing units in structures - Renters - 20 to 49 (%)
Housing units in structures - Renters - 50 or more (%)
Housing units in structures - Renters - Mobile home (%)
Housing units in structures - Renters - Boat, RV, van, etc. (%)
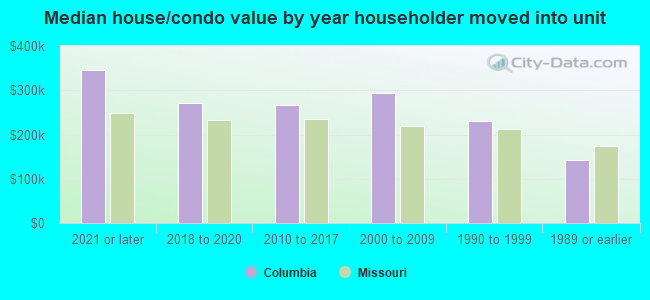
House/condo owner moved in on average (years ago)
Renter moved in on average (years ago)
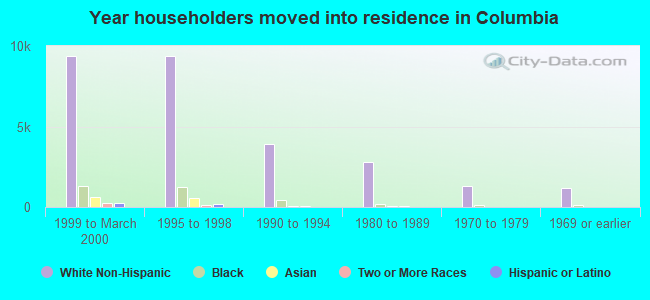
Year householder moved into unit - Moved in 1999 to March 2000 (%)
Year householder moved into unit - Moved in 1999 to March 2000 (%) - White
Year householder moved into unit - Moved in 1999 to March 2000 (%) - Black or African American
Year householder moved into unit - Moved in 1999 to March 2000 (%) - Asian
Year householder moved into unit - Moved in 1999 to March 2000 (%) - Hispanic or Latino
Year householder moved into unit - Moved in 1999 to March 2000 (%) - American Indian and Alaska Native
Year householder moved into unit - Moved in 1999 to March 2000 (%) - Multirace
Year householder moved into unit - Moved in 1999 to March 2000 (%) - Other Race
Year householder moved into unit - Moved in 1995 to 1998 (%)
Year householder moved into unit - Moved in 1995 to 1998 (%) - White
Year householder moved into unit - Moved in 1995 to 1998 (%) - Black or African American
Year householder moved into unit - Moved in 1995 to 1998 (%) - Asian
Year householder moved into unit - Moved in 1995 to 1998 (%) - Hispanic or Latino
Year householder moved into unit - Moved in 1995 to 1998 (%) - American Indian and Alaska Native
Year householder moved into unit - Moved in 1995 to 1998 (%) - Multirace
Year householder moved into unit - Moved in 1995 to 1998 (%) - Other Race
Year householder moved into unit - Moved in 1990 to 1994 (%)
Year householder moved into unit - Moved in 1990 to 1994 (%) - White
Year householder moved into unit - Moved in 1990 to 1994 (%) - Black or African American
Year householder moved into unit - Moved in 1990 to 1994 (%) - Asian
Year householder moved into unit - Moved in 1990 to 1994 (%) - Hispanic or Latino
Year householder moved into unit - Moved in 1990 to 1994 (%) - American Indian and Alaska Native
Year householder moved into unit - Moved in 1990 to 1994 (%) - Multirace
Year householder moved into unit - Moved in 1990 to 1994 (%) - Other Race
Year householder moved into unit - Moved in 1980 to 1989 (%)
Year householder moved into unit - Moved in 1980 to 1989 (%) - White
Year householder moved into unit - Moved in 1980 to 1989 (%) - Black or African American
Year householder moved into unit - Moved in 1980 to 1989 (%) - Asian
Year householder moved into unit - Moved in 1980 to 1989 (%) - Hispanic or Latino
Year householder moved into unit - Moved in 1980 to 1989 (%) - American Indian and Alaska Native
Year householder moved into unit - Moved in 1980 to 1989 (%) - Multirace
Year householder moved into unit - Moved in 1980 to 1989 (%) - Other Race
Year householder moved into unit - Moved in 1970 to 1979 (%)
Year householder moved into unit - Moved in 1970 to 1979 (%) - White
Year householder moved into unit - Moved in 1970 to 1979 (%) - Black or African American
Year householder moved into unit - Moved in 1970 to 1979 (%) - Asian
Year householder moved into unit - Moved in 1970 to 1979 (%) - Hispanic or Latino
Year householder moved into unit - Moved in 1970 to 1979 (%) - American Indian and Alaska Native
Year householder moved into unit - Moved in 1970 to 1979 (%) - Multirace
Year householder moved into unit - Moved in 1970 to 1979 (%) - Other Race
Year householder moved into unit - Moved in 1969 or earlier (%)
Year householder moved into unit - Moved in 1969 or earlier (%) - White
Year householder moved into unit - Moved in 1969 or earlier (%) - Black or African American
Year householder moved into unit - Moved in 1969 or earlier (%) - Asian
Year householder moved into unit - Moved in 1969 or earlier (%) - Hispanic or Latino
Year householder moved into unit - Moved in 1969 or earlier (%) - American Indian and Alaska Native
Year householder moved into unit - Moved in 1969 or earlier (%) - Multirace
Year householder moved into unit - Moved in 1969 or earlier (%) - Other Race
Housing units lacking complete plumbing facilities (%)
Housing units lacking complete kitchen facilities (%)
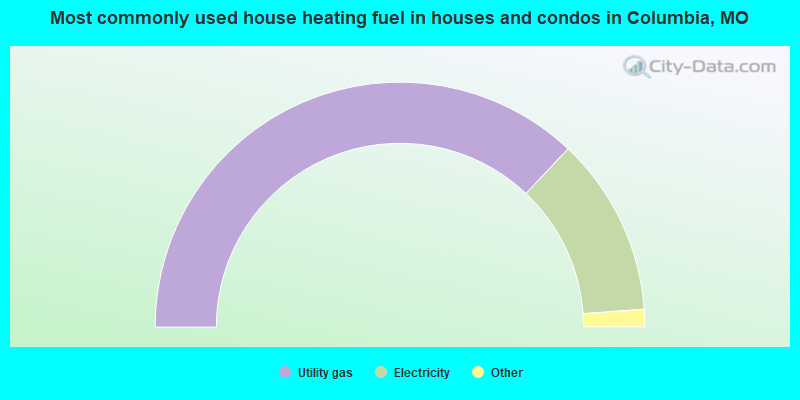
House heating fuel used in houses and condos - Utility gas (%)
House heating fuel used in houses and condos - Bottled, tank, or LP gas (%)
House heating fuel used in houses and condos - Electricity (%)
House heating fuel used in houses and condos - Fuel oil, kerosene, etc. (%)
House heating fuel used in houses and condos - Coal or coke (%)
House heating fuel used in houses and condos - Wood (%)
House heating fuel used in houses and condos - Solar energy (%)
House heating fuel used in houses and condos - Other fuel (%)
House heating fuel used in houses and condos - No fuel used (%)
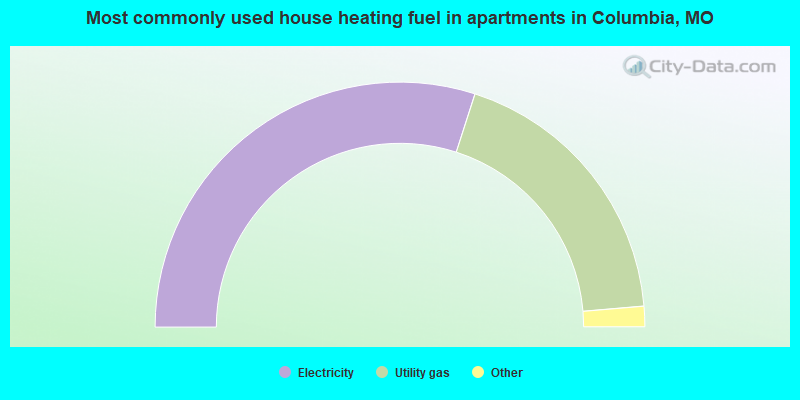
House heating fuel used in apartments - Utility gas (%)
House heating fuel used in apartments - Bottled, tank, or LP gas (%)
House heating fuel used in apartments - Electricity (%)
House heating fuel used in apartments - Fuel oil, kerosene, etc. (%)
House heating fuel used in apartments - Coal or coke (%)
House heating fuel used in apartments - Wood (%)
House heating fuel used in apartments - Solar energy (%)
House heating fuel used in apartments - Other fuel (%)
House heating fuel used in apartments - No fuel used (%)
Latest news about housing in Columbia, MO collected exclusively by city-data.com from local newspapers, TV, and radio stations
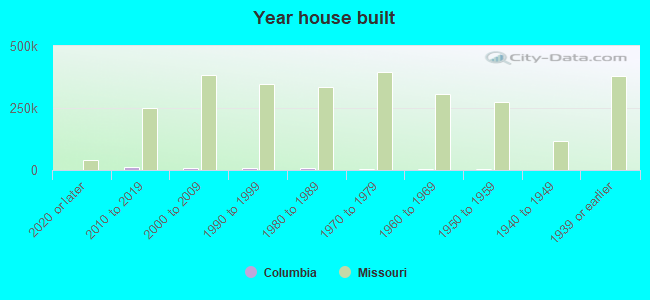
Median year house/condo built: 1996Median year apartment built: 1990Household type by relationship:
Households: 128,545
Male householders: 24,205 (7,956 living alone ), Female householders: 28,749 (11,200 living alone )17,727 spouses (17,580 opposite-sex spouses ), 4,267 unmarried partners , (4,069 opposite-sex unmarried partners ), 29,086 children (27,143 natural , 805 adopted , 1,138 stepchildren ), 557 grandchildren , 1,259 brothers or sisters , 876 parents , 272 foster children , 340 other relatives , 11,901 non-relatives In group quarters: 9,306
Size of family households: 11,197 2-persons , 6,698 3-persons , 4,065 4-persons , 1,692 5-persons , 771 6-persons , 217 7-or-more-persons .
Size of nonfamily households: 19,156 1-person , 5,664 2-persons , 1,120 3-persons , 2,283 4-persons , 91 5-persons .
15,821 married couples with children. single-parent households (1,132 men , 6,199 women ).
89.3% of residents of Columbia speak English at home. of residents speak Spanish at home (67% speak English very well , 24% speak English well , 7% speak English not well , 3% don't speak English at all ).of residents speak other Indo-European language at home (79% speak English very well , 11% speak English well , 10% speak English not well ).of residents speak Asian or Pacific Island language at home (46% speak English very well , 39% speak English well , 13% speak English not well , 2% don't speak English at all ).of residents speak other language at home (66% speak English very well , 15% speak English well , 11% speak English not well , 8% don't speak English at all ).
Foreign born population: 8,609 (6.7%)of them are naturalized citizens )
Median number of rooms in houses and condos:
Median number of rooms in apartments
Owner-occupied Renter-occupied
Bedrooms in owner-occupied houses and condos in Columbia, Missouri
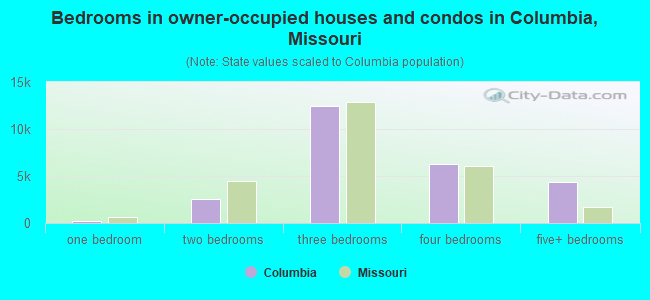
0 no bedroom 256 1 bedroom 2,522 2 bedrooms 12,394 3 bedrooms 6,256 4 bedrooms 4,393 5+ bedrooms
Bedrooms in renter-occupied apartments in Columbia, Missouri
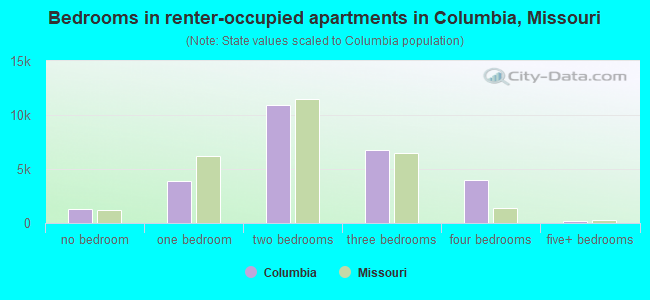
1,297 no bedroom 3,904 1 bedroom 10,952 2 bedrooms 6,762 3 bedrooms 4,007 4 bedrooms 211 5+ bedrooms
Owner-occupied Renter-occupied
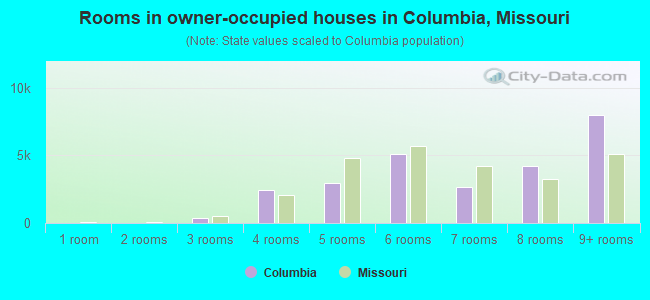
Rooms in owner-occupied houses in Columbia, Missouri
0 1 room 0 2 rooms 397 3 rooms 2,458 4 rooms 2,967 5 rooms 5,115 6 rooms 2,661 7 rooms 4,241 8 rooms 7,982 9+ rooms
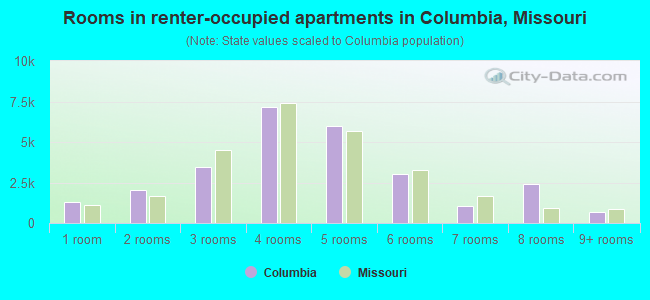
Rooms in renter-occupied apartments in Columbia, Missouri
1,297 1 room 2,048 2 rooms 3,440 3 rooms 7,181 4 rooms 5,970 5 rooms 3,026 6 rooms 1,060 7 rooms 2,412 8 rooms 699 9+ rooms
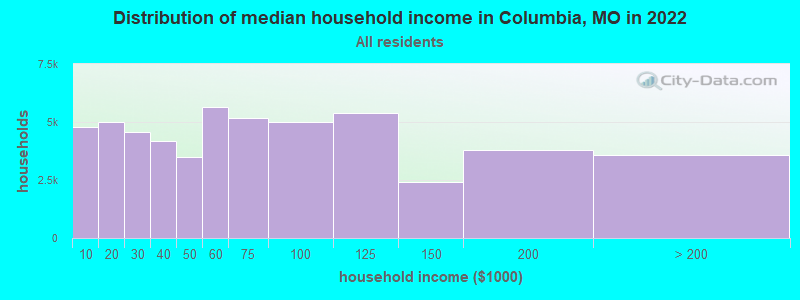
Columbia, MO household income distribution 4,767 Less than $10,0004,979 $10,000 to $19,9994,556 $20,000 to $29,9994,190 $30,000 to $39,9993,474 $40,000 to $49,9995,647 $50,000 to $59,9995,185 $60,000 to $74,9995,017 $75,000 to $99,9995,371 $100,000 to $124,9992,406 $125,000 to $149,9993,802 $150,000 to $199,9993,560 $200,000 or more
Home value of owner - occupied houses in 2022 in Columbia, MO 530 Less than $10,000268 $10,000 to $14,99992 $15,000 to $19,99938 $20,000 to $24,99954 $25,000 to $29,999102 $40,000 to $49,99951 $50,000 to $59,999241 $60,000 to $69,99990 $70,000 to $79,999565 $80,000 to $89,999223 $90,000 to $99,9991,151 $100,000 to $124,9991,947 $125,000 to $149,999881 $150,000 to $174,9991,665 $175,000 to $199,9993,422 $200,000 to $249,9993,650 $250,000 to $299,9994,590 $300,000 to $399,9993,725 $400,000 to $499,9991,806 $500,000 to $749,999631 $750,000 to $999,99999 $1,500,000 to $1,999,999Rent paid by renters in 2022 in Columbia, MO 346 $100 to $14960 $150 to $199587 $200 to $24951 $250 to $299584 $300 to $349689 $350 to $399426 $400 to $449638 $450 to $4991,725 $500 to $5491,067 $550 to $599921 $600 to $6492,282 $650 to $6991,730 $700 to $7491,784 $750 to $7994,346 $800 to $8992,547 $900 to $9992,885 $1,000 to $1,2491,054 $1,250 to $1,4992,077 $1,500 to $1,999672 $2,000 to $2,49994 $3,000 to $3,499568 No cash rent
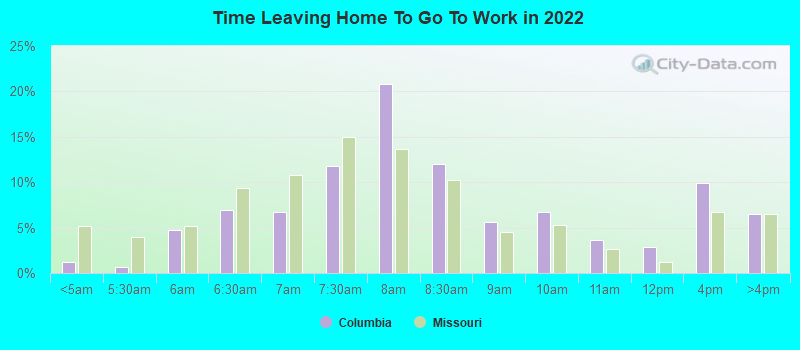
Percentage of workers working in this county: 91.6%Number of people working at home: 6,517 (9.9% of all workers )
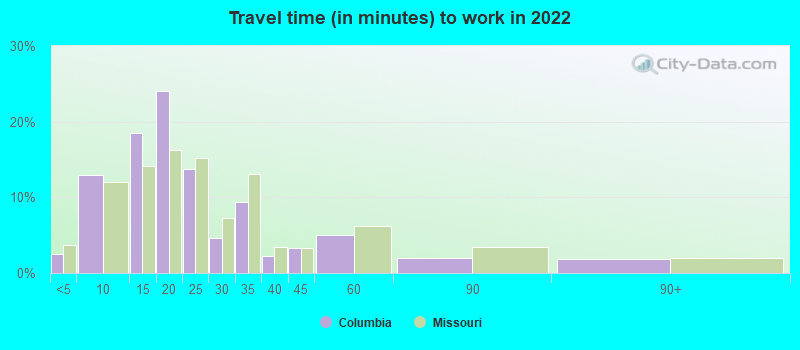
Travel time to work (commute)
Less than 5 minutes: 1,7185 to 9 minutes: 9,16810 to 14 minutes: 13,72915 to 19 minutes: 16,05620 to 24 minutes: 7,14125 to 29 minutes: 1,87330 to 34 minutes: 2,86535 to 39 minutes: 1,32840 to 44 minutes: 1,06245 to 59 minutes: 1,62260 to 89 minutes: 72990 or more minutes: 539
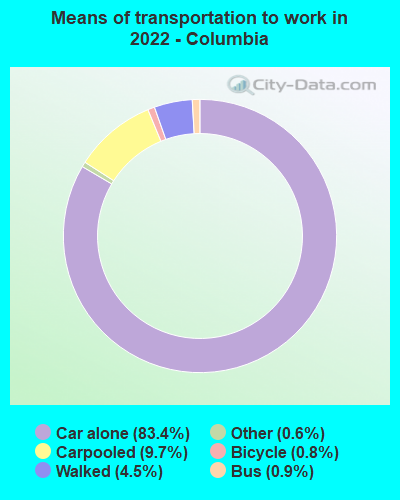
Means of transportation to work:
Drove a car alone: 69,060 (76.3%)Carpooled: 8,143 (9.0%)Bus : 623 (0.7%)Long-distance train or commuter rail : 24 (0.0%)Light rail, streetcar or trolley : 8 (0.0%)Taxi: 476 (0.5%)Bicycle: 735 (0.8%)Walked: 3,558 (3.9%)Worked at home: 6,517 (7.2%)
Unemployment by race in 2022
Unemployment rate for White non-Hispanic residents 3.9% Males7.3% FemalesUnemployment rate for Black residents 5.0% Males4.2% FemalesUnemployment rate for Asian residents 1.5% Males11.8% FemalesUnemployment rate for other race residents 4.1% FemalesUnemployment rate for two or more race residents 5.8% Males1.6% FemalesUnemployment rate for Hispanic or Latino residents 1.2% Males1.8% Females
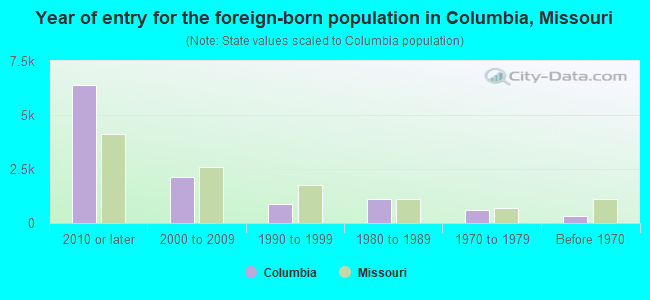
Year of entry for the foreign-born population in Columbia, Missouri
6,370 2010 or later 2,152 2000 to 2009 858 1990 to 1999 1,107 1980 to 1989 619 1970 to 1979 309 Before 1970
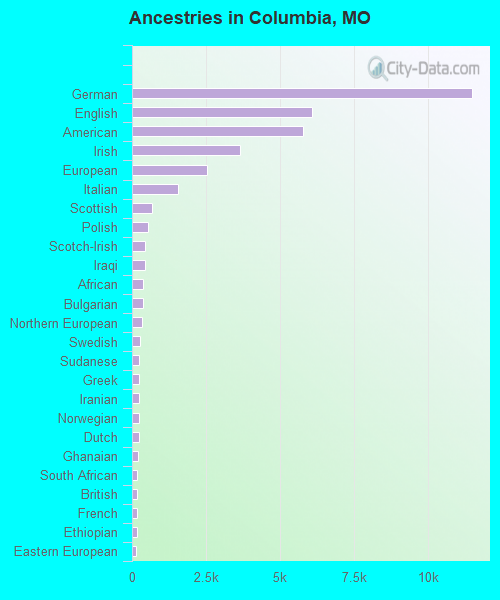
First ancestries reported:
German: 11,498 (19.4%)
English: 6,083 (10.2%)
American: 5,766 (9.7%)
Irish: 3,658 (6.2%)
European: 2,536 (4.3%)
Italian: 1,549 (2.6%)
Scottish: 681 (1.1%)
Polish: 528 (0.9%)
Scotch-Irish: 441 (0.7%)
Iraqi: 428 (0.7%)
African: 375 (0.6%)
Bulgarian: 361 (0.6%)
Northern European: 322 (0.5%)
Swedish: 255 (0.4%)
Sudanese: 248 (0.4%)
Greek: 244 (0.4%)
Iranian: 240 (0.4%)
Norwegian: 226 (0.4%)
Dutch: 225 (0.4%)
Ghanaian: 219 (0.4%)
South African: 184 (0.3%)
British: 177 (0.3%)
French: 172 (0.3%)
Ethiopian: 162 (0.3%)
Eastern European: 147 (0.2%)
Hungarian: 144 (0.2%)
Russian: 140 (0.2%)
Czech: 139 (0.2%)
Scandinavian: 137 (0.2%)
Ukrainian: 123 (0.2%)
Lebanese: 115 (0.2%)
Nigerian: 105 (0.2%)
Romanian: 101 (0.2%)
Jamaican: 100 (0.2%)
Welsh: 86 (0.1%)
French Canadian: 84 (0.1%)
Haitian: 82 (0.1%)
Belgian: 79 (0.1%)
Turkish: 77 (0.1%)
Kenyan: 71 (0.1%)
Syrian: 68 (0.1%)
Egyptian: 47 (0.08%)
Lithuanian: 47 (0.08%)
Danish: 41 (0.07%)
Israeli: 33 (0.06%)
Sierra Leonean: 32 (0.05%)
Australian: 31 (0.05%)
Albanian: 31 (0.05%)
Arab: 25 (0.04%)
Yugoslavian: 25 (0.04%)
Cajun: 24 (0.04%)
Croatian: 23 (0.04%)
Finnish: 22 (0.04%)
Trinidadian and Tobagonian: 21 (0.04%)
Armenian: 19 (0.03%)
Moroccan: 19 (0.03%)
Slovak: 16 (0.03%)
Czechoslovakian: 14 (0.02%)
Swiss: 14 (0.02%)
Jordanian: 11 (0.02%)
Assyrian: 9 (0.02%)
Canadian: 9 (0.02%)
Slovene: 8 (0.01%)
Celtic: 6 (0.01%)
Brazilian: 6 (0.01%)
Zimbabwean: 5 (0.01%)
New Zealander: 4 (0.01%)
Portuguese: 4 (0.01%)
Most common places of birth for foreign-born residents (%): China, excluding Hong Kong and Taiwan Columbia:
18.3% (1,886)Missouri:
6.6% (17,002)
Korea Columbia:
11.8% (1,210)Missouri:
2.9% (7,525)
India Columbia:
8.2% (846)Missouri:
8.9% (22,932)
Mexico Columbia:
7.2% (740)Missouri:
14.9% (38,568)
Cambodia Columbia:
4.7% (484)Missouri:
0.3% (764)
Bulgaria Columbia:
2.8% (292)Missouri:
0.5% (1,414)
Vietnam Columbia:
2.6% (265)Missouri:
4.1% (10,700)
Nepal Columbia:
2.5% (257)Missouri:
0.5% (1,214)
Iraq Columbia:
2.2% (226)Missouri:
1.4% (3,509)
Kenya Columbia:
2.0% (210)Missouri:
1.7% (4,518)
Eritrea Columbia:
1.9% (199)Missouri:
0.2% (498)
Honduras Columbia:
1.9% (195)Missouri:
2.1% (5,346)
Philippines Columbia:
1.7% (173)Missouri:
4.2% (10,873)
Germany Columbia:
1.6% (161)Missouri:
3.0% (7,803)
Sudan Columbia:
1.5% (159)Missouri:
0.3% (772)
Place of birth for U.S.-born residents:
This state: 82,539Other state: 35,966Northeast: 3,420Midwest: 18,996South: 8,084West: 5,466 77.5% of Columbia residents lived in the same house 1 years ago.
Out of people who lived in different houses, 36.2% lived in this county.
Out of people who lived in different counties, 48.7% lived in Missouri.
Columbia:
77.5%State average:
87.1%
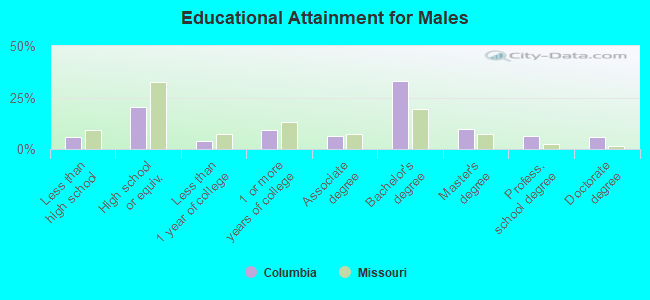
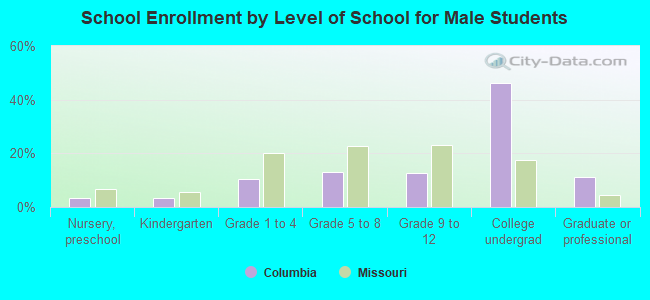
Education attainment for males 25 years and older:
No schooling: 271Nursery to 4th grade: 05th and 6th grade: 577th and 8th grade: 4529th grade: 010th grade: 55811th grade: 52912th grade, no diploma: 113High school graduate (or equivalency): 6,994Less than 1 year of college: 1,276Some college more than 1 year, no degree: 3,225Associate degree: 2,105Bachelor's degree: 11,519Master's degree: 3,369Professional school degree: 2,222Doctorate degree: 1,962
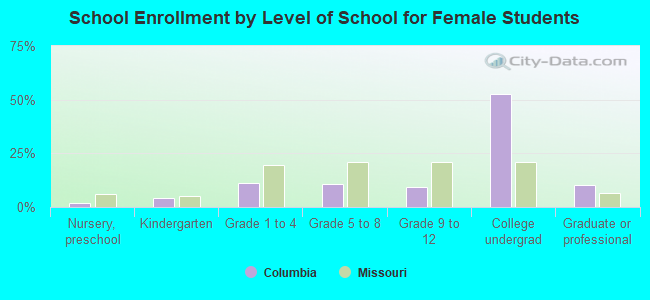
Education attainment for females 25 years and older:
No schooling: 153Nursery to 4th grade: 05th and 6th grade: 417th and 8th grade: 2759th grade: 010th grade: 411th grade: 38612th grade, no diploma: 63High school graduate (or equivalency): 7,095Less than 1 year of college: 1,698Some college more than 1 year, no degree: 3,459Associate degree: 2,309Bachelor's degree: 13,524Master's degree: 5,876Professional school degree: 1,194Doctorate degree: 1,915
Housing units in structures:
One, detached: 29,761One, attached: 3,610Two: 3,5633 or 4: 3,6465 to 9: 3,93210 to 19: 4,57020 to 49: 1,07850 or more: 4,288Mobile homes: 1,514Median worth of mobile homes: $19,243
Housing units lacking complete plumbing facilities in 2022: 0.4%Housing units lacking complete kitchen facilities in 2022: 1.0%House/condo owner moved in on average 7 years ago
Renter moved in on average 0 years ago
Private vs. public school enrollment:
Students in private schools in grades 1 to 8 (elementary and middle school): 1,278 Students in private schools in grades 9 to 12 (high school): 1,073 Students in private undergraduate colleges: 1,480