Colorado Springs, CO (Colorado) Houses and Residents
| Colorado Springs: | $455,200 |
| Colorado: | $531,100 |
Mean price in 2022:
Detached houses: $511,608
Here: $511,608 State: $676,667 Townhouses or other attached units: $377,619
Here: $377,619 State: $526,340 In 2-unit structures: $498,047
Here: $498,047 State: $431,509 In 3-to-4-unit structures: $660,830
Here: $660,830 State: $385,502 In 5-or-more-unit structures: $263,752
Here: $263,752 State: $417,586 Mobile homes: $35,508
Here: $35,508 State: $115,510
Total population: 445,830 (Urban population: 359,176, Rural population: 1,622 (4 farm, 1,618 nonfarm))
Houses: 213,240 (206,648 occupied: 122,976 owner occupied, 83,672 renter occupied)
| % of renters here: | 40% |
| State: | 34% |
Housing density: 1,148 houses/condos per square mile
Median price asked for vacant for-sale houses and condos in 2022: $353,284.
Median contract rent in 2022: $1,357 (lower quartile is $1,047, upper quartile is $1,755)
Median rent asked for vacant for-rent units in 2022: $912
Median gross rent in Colorado Springs, CO in 2022: $1,537
Housing units in Colorado Springs with a mortgage: 84,907 (8,487 second mortgage, 89 home equity loan, 7,444 both second mortgage and home equity loan)
Houses without a mortgage: 1,819
Median household income for houses/condos with a mortgage: $111,423
Median household income for apartments without a mortgage: $79,548
Median monthly housing costs: $1,500
Compare current foreclosures in Colorado Springs, CO:
| Photo | Address | Area | Beds / Baths | Price | Details |
|---|---|---|---|---|---|

|
#1
Yellow Dock Point
Colorado Springs, CO 80911
|
1,867 sq. feet
|
4 baths 3 beds |
show details | |

|
#2
Johnsontown Hghts
Colorado Springs, CO 80908
|
1,566 sq. feet
|
3 baths 3 beds |
show details | |

|
#3
N Carefree Cir
Colorado Springs, CO 80917
|
995 sq. feet
|
2 baths 3 beds |
show details | |

|
#4
Brentwood Ter
Colorado Springs, CO 80910
|
1,005 sq. feet
|
1 baths 3 beds |
show details | |

|
#5
Lazy Stream Way
Colorado Springs, CO 80923
|
1,605 sq. feet
|
2 baths 3 beds |
show details | |

|
#6
Gunbarrel Dr
Colorado Springs, CO 80925
|
1,628 sq. feet
|
3 baths 3 beds |
show details | |

|
#7
Jamesport Dr
Colorado Springs, CO 80918
|
2,845 sq. feet
|
3 baths 3 beds |
show details | |

|
#8
Shining Star Dr
Colorado Springs, CO 80925
|
2,745 sq. feet
|
4 baths 4 beds |
show details | |

|
#9
Yellowstone Rd
Colorado Springs, CO 80910
|
1,394 sq. feet
|
1 baths 3 beds |
show details | |

|
#10
Hiawatha Dr
Colorado Springs, CO 80915
|
2,128 sq. feet
|
2 baths 5 beds |
show details |
| Photo | Address | Area | Beds / Baths | Price | Details |
|---|---|---|---|---|---|

|
#11
Cliveden Hts
Colorado Springs, CO 80906
|
1,476 sq. feet
|
2 baths 3 beds |
show details | |

|
#12
E Pikes Peak Ave
Colorado Springs, CO 80909
|
1,764 sq. feet
|
1 baths 3 beds |
show details | |

|
#13
Wainwright Dr
Colorado Springs, CO 80911
|
1,528 sq. feet
|
3 baths 5 beds |
show details | |

|
#14
Summer Rain Trl
Colorado Springs, CO 80908
|
3,765 sq. feet
|
3 baths 5 beds |
show details | |

|
#15
Iowa Ave
Colorado Springs, CO 80909
|
938 sq. feet
|
1 baths 2 beds |
show details | |

|
#16
Steven Dr
Colorado Springs, CO 80911
|
1,330 sq. feet
|
1 baths 3 beds |
show details | |

|
#17
Northglen Dr
Colorado Springs, CO 80909
|
- sq. feet
|
2 baths 3 beds |
show details | |

|
#18
Streambank Dr
Colorado Springs, CO 80951
|
1,775 sq. feet
|
3 baths 3 beds |
show details | |

|
#19
Livingston Ave
Colorado Springs, CO 80906
|
809 sq. feet
|
2 baths 4 beds |
show details | |

|
#20
Shasta Dr
Colorado Springs, CO 80910
|
1,060 sq. feet
|
1 baths 3 beds |
show details |
| Photo | Address | Area | Beds / Baths | Price | Details |
|---|---|---|---|---|---|

|
#21
Burnham St
Colorado Springs, CO 80906
|
944 sq. feet
|
1 baths 2 beds |
show details | |

|
#22
Ambleside Dr
Colorado Springs, CO 80915
|
2,453 sq. feet
|
2 baths 2 beds |
show details | |

|
#23
Ely St
Colorado Springs, CO 80911
|
1,578 sq. feet
|
1 baths 2 beds |
show details | |

|
#24
Esther Dr
Colorado Springs, CO 80911
|
1,295 sq. feet
|
1 baths 2 beds |
show details | |

|
#25
Bareback Dr
Colorado Springs, CO 80922
|
1,414 sq. feet
|
3 baths 3 beds |
show details | |

|
#26
Bow River Dr
Colorado Springs, CO 80923
|
1,272 sq. feet
|
2 baths 3 beds |
show details | |

|
#27
Ferncliff Dr
Colorado Springs, CO 80920
|
1,961 sq. feet
|
2 baths 3 beds |
show details | |

|
#28
N Enchanted Cir
Colorado Springs, CO 80917
|
1,848 sq. feet
|
3 baths 4 beds |
show details | |

|
#29
Johnsontown Hts
Colorado Springs, CO 80908
|
- sq. feet
|
2 baths 3 beds |
show details | |

|
#30
S Brentwood Dr
Colorado Springs, CO 80910
|
1,040 sq. feet
|
1 baths 3 beds |
show details |
| Photo | Address | Area | Beds / Baths | Price | Details |
|---|---|---|---|---|---|

|
#31
Widefield Dr
Colorado Springs, CO 80911
|
1,318 sq. feet
|
1 baths 3 beds |
show details | |

|
#32
Tilden St
Colorado Springs, CO 80911
|
1,763 sq. feet
|
1 baths 3 beds |
show details | |

|
#33
Tillamook Drive
Colorado Springs, CO 80925
|
1,421 sq. feet
|
3 baths 3 beds |
show details | |

|
#34
Thorn Brush Way
Colorado Springs, CO 80923
|
2,723 sq. feet
|
3 baths 4 beds |
show details | |

|
#35
Sable Chase Dr
Colorado Springs, CO 80920
|
1,064 sq. feet
|
2 baths 2 beds |
show details | |

|
#36
Martense Street Unit 4j
Colorado Springs, CO 80911
|
- sq. feet
|
1 baths 2 beds |
show details | |

|
#37
Excursion Dr
Colorado Springs, CO 80911
|
1,945 sq. feet
|
2 baths 3 beds |
show details | |

|
#38
Hanover Rd
Colorado Springs, CO 80928
|
1,539 sq. feet
|
2 baths 3 beds |
show details | |

|
#39
N Marksheffel Rd
Colorado Springs, CO 80923
|
1,833 sq. feet
|
3 baths 3 beds |
show details | |

|
#40
Timberlake Loop
Colorado Springs, CO 80927
|
1,400 sq. feet
|
1 baths 2 beds |
show details |
| Photo | Address | Area | Beds / Baths | Price | Details |
|---|---|---|---|---|---|

|
#41
1/2 E Willamette Ave
Colorado Springs, CO 80909
|
672 sq. feet
|
1 baths 2 beds |
show details | |

|
#42
Palomino Ranch Pt Unit 204
Colorado Springs, CO 80922
|
1,498 sq. feet
|
2 baths 3 beds |
show details | |

|
#43
Skywriter Cir
Colorado Springs, CO 80922
|
2,319 sq. feet
|
4 baths 5 beds |
show details | |

|
#44
Valley Hi Ave
Colorado Springs, CO 80910
|
1,625 sq. feet
|
2 baths 4 beds |
show details | |

|
#45
Poteae Cir
Colorado Springs, CO 80915
|
1,492 sq. feet
|
2 baths 3 beds |
show details | |

|
#46
Heron Ct
Colorado Springs, CO 80911
|
777 sq. feet
|
1 baths 2 beds |
show details | |

|
#47
Defoe Ave
Colorado Springs, CO 80911
|
1,396 sq. feet
|
1 baths 3 beds |
show details | |

|
#48
Iron Horse Trl
Colorado Springs, CO 80917
|
1,584 sq. feet
|
3 baths 4 beds |
show details | |

|
#49
Fay Dr
Colorado Springs, CO 80911
|
- sq. feet
|
1 baths 2 beds |
show details | |

|
Check over 1 million property listings on Foreclosure.com!
|
browse all offers | |||


Median year apartment built: 1984
Household type by relationship:
Households: 486,228- Male householders: 107,406 (26,841 living alone), Female householders: 99,242 (33,602 living alone)
95,968 spouses (93,948 opposite-sex spouses), 14,436 unmarried partners, (13,168 opposite-sex unmarried partners), 124,946 children (113,312 natural, 6,168 adopted, 5,466 stepchildren), 7,142 grandchildren, 3,492 brothers or sisters, 3,946 parents, 108 foster children, 4,724 other relatives, 14,985 non-relatives
- In group quarters: 9,833
Size of family households: 61,813 2-persons, 28,252 3-persons, 20,836 4-persons, 9,297 5-persons, 3,437 6-persons, 2,417 7-or-more-persons.
Size of nonfamily households: 60,443 1-person, 15,702 2-persons, 3,065 3-persons, 1,267 4-persons, 119 5-persons.
66,379 married couples with children.
26,147 single-parent households (7,582 men, 18,565 women).
88.5% of residents of Colorado Springs speak English at home.
7.7% of residents speak Spanish at home (71% speak English very well, 21% speak English well, 5% speak English not well, 3% don't speak English at all).
1.8% of residents speak other Indo-European language at home (77% speak English very well, 15% speak English well, 6% speak English not well, 2% don't speak English at all).
1.6% of residents speak Asian or Pacific Island language at home (48% speak English very well, 31% speak English well, 18% speak English not well, 2% don't speak English at all).
0.5% of residents speak other language at home (66% speak English very well, 22% speak English well, 12% speak English not well).
Foreign born population: 33,567 (6.9%)
(55.4% of them are naturalized citizens)
| Here: | 7.3 |
| State: | 6.8 |
| Here: | 4.0 |
| State: | 4.0 |

- Bedrooms in owner-occupied houses and condos in Colorado Springs, Colorado
- 456no bedroom
- 1,9131 bedroom
- 16,2822 bedrooms
- 44,6753 bedrooms
- 37,1724 bedrooms
- 22,4785+ bedrooms

- Bedrooms in renter-occupied apartments in Colorado Springs, Colorado
- 4,246no bedroom
- 22,1381 bedroom
- 32,5482 bedrooms
- 15,4623 bedrooms
- 6,2764 bedrooms
- 3,0025+ bedrooms

- Cars and other vehicles available in Colorado Springs in owner-occupied houses/condos
- 1,179no vehicle
- 31,0091 vehicle
- 56,1772 vehicles
- 24,9903 vehicles
- 8,1374 vehicles
- 1,4845+ vehicles

- Cars and other vehicles available in Colorado Springs in renter-occupied apartments
- 6,077no vehicle
- 38,8591 vehicle
- 30,3942 vehicles
- 6,0633 vehicles
- 1,6644 vehicles
- 6155+ vehicles

- Rooms in owner-occupied houses in Colorado Springs, Colorado
- 4561 room
- 2392 rooms
- 4,0233 rooms
- 8,3204 rooms
- 15,0515 rooms
- 17,9386 rooms
- 19,9967 rooms
- 18,5738 rooms
- 38,3809+ rooms

- Rooms in renter-occupied apartments in Colorado Springs, Colorado
- 3,7511 room
- 8,2752 rooms
- 17,8853 rooms
- 22,0554 rooms
- 11,6905 rooms
- 8,2816 rooms
- 4,2767 rooms
- 2,7648 rooms
- 4,6959+ rooms


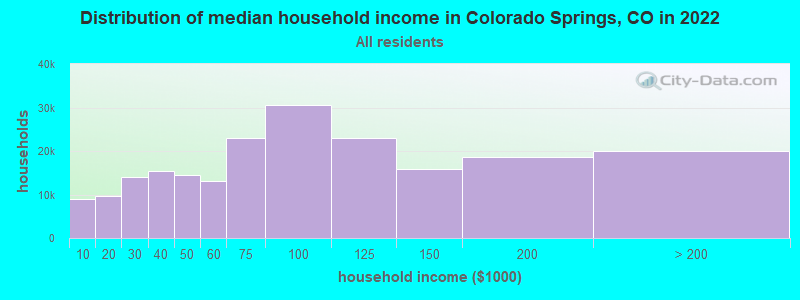
Colorado Springs, CO household income distribution

- 8,878Less than $10,000
- 9,742$10,000 to $19,999
- 14,048$20,000 to $29,999
- 15,355$30,000 to $39,999
- 14,478$40,000 to $49,999
- 13,107$50,000 to $59,999
- 23,082$60,000 to $74,999
- 30,682$75,000 to $99,999
- 22,978$100,000 to $124,999
- 15,814$125,000 to $149,999
- 18,557$150,000 to $199,999
- 19,927$200,000 or more
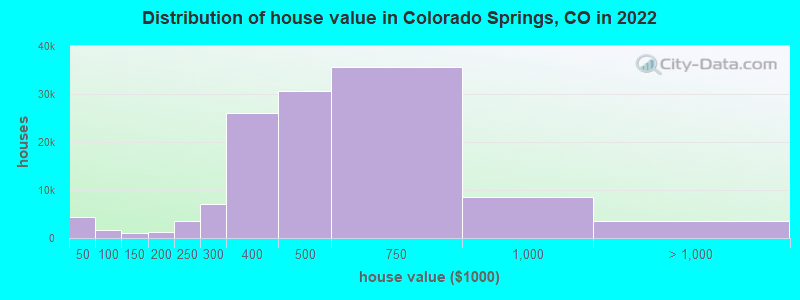
Home value of owner - occupied houses in 2022 in Colorado Springs, CO
-
- 1,340Less than $10,000
- 673$10,000 to $14,999
- 74$15,000 to $19,999
- 561$20,000 to $24,999
- 622$25,000 to $29,999
- 526$30,000 to $34,999
- 358$35,000 to $39,999
- 322$40,000 to $49,999
- 171$50,000 to $59,999
- 509$60,000 to $69,999
- 107$70,000 to $79,999
- 337$80,000 to $89,999
- 144$90,000 to $99,999
- 578$100,000 to $124,999
- 457$125,000 to $149,999
- 491$150,000 to $174,999
- 738$175,000 to $199,999
- 3,493$200,000 to $249,999
- 7,069$250,000 to $299,999
- 26,006$300,000 to $399,999
- 30,642$400,000 to $499,999
- 35,639$500,000 to $749,999
- 8,568$750,000 to $999,999
- 2,545$1,000,000 to $1,499,999
- 482$1,500,000 to $1,999,999
- 524$2,000,000 or more
Rent paid by renters in 2022 in Colorado Springs, CO
-
- 217Less than $100
- 171$100 to $149
- 313$150 to $199
- 114$200 to $249
- 244$250 to $299
- 29$300 to $349
- 149$350 to $399
- 202$400 to $449
- 156$450 to $499
- 733$500 to $549
- 276$550 to $599
- 509$600 to $649
- 1,442$650 to $699
- 1,479$700 to $749
- 1,420$750 to $799
- 4,753$800 to $899
- 5,012$900 to $999
- 16,627$1,000 to $1,249
- 15,992$1,250 to $1,499
- 21,883$1,500 to $1,999
- 7,551$2,000 to $2,499
- 1,461$2,500 to $2,999
- 76$3,000 to $3,499
- 546$3,500 or more
- 2,317No cash rent


Percentage of workers working in this county: 96.0%
Number of people working at home: 48,261 (18.9% of all workers)
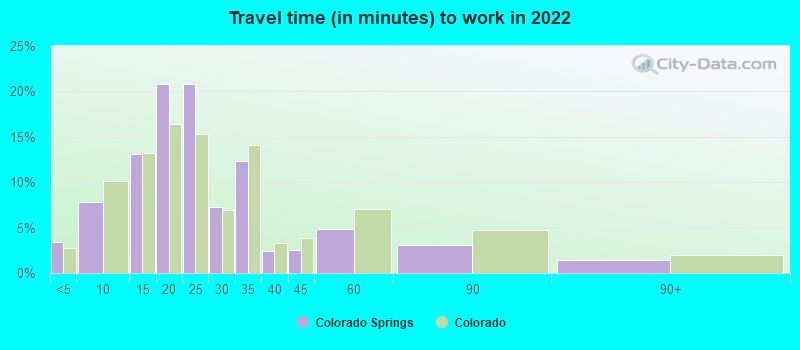
Travel time to work (commute)
- Less than 5 minutes: 7,548
- 5 to 9 minutes: 18,998
- 10 to 14 minutes: 30,251
- 15 to 19 minutes: 45,183
- 20 to 24 minutes: 41,978
- 25 to 29 minutes: 14,390
- 30 to 34 minutes: 25,075
- 35 to 39 minutes: 4,397
- 40 to 44 minutes: 4,421
- 45 to 59 minutes: 6,365
- 60 to 89 minutes: 5,428
- 90 or more minutes: 3,592
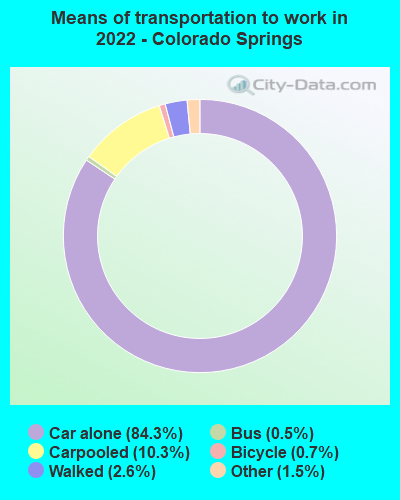
Means of transportation to work:
- Drove a car alone: 191,416 (69.5%)
- Carpooled: 23,439 (8.5%)
- Bus: 1,061 (0.4%)
- Taxi: 3,363 (1.2%)
- Bicycle: 1,702 (0.6%)
- Walked: 5,986 (2.2%)
- Worked at home: 48,261 (17.5%)

- Unemployment by race in 2022
- Unemployment rate for White non-Hispanic residents
- 3.7%Males
- 3.1%Females
- Unemployment rate for Black residents
- 5.2%Males
- 2.9%Females
- Unemployment rate for American Indian and Alaska Native residents
- 7.4%Males
- 21.4%Females
- Unemployment rate for Asian residents
- 2.1%Females
- Unemployment rate for other race residents
- 1.2%Males
- 13.3%Females
- Unemployment rate for two or more race residents
- 3.9%Males
- 7.0%Females
- Unemployment rate for Hispanic or Latino residents
- 4.2%Males
- 10.7%Females

- Year of entry for the foreign-born population in Colorado Springs, Colorado
- 9,7732010 or later
- 7,5442000 to 2009
- 7,3611990 to 1999
- 5,1491980 to 1989
- 3,4091970 to 1979
- 5,931Before 1970
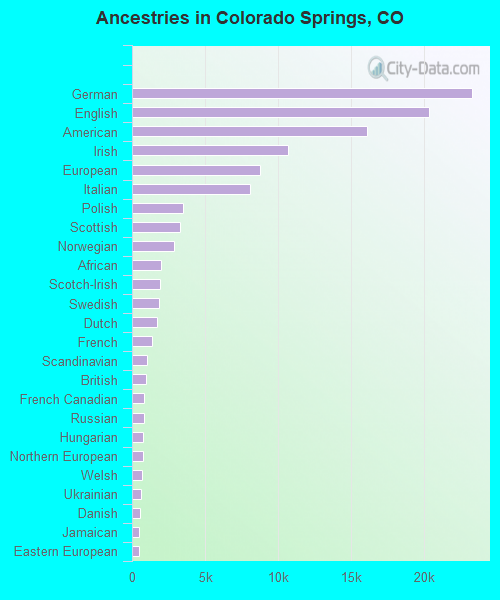
First ancestries reported:
- German: 23,281 (11.5%)
- English: 20,367 (10.0%)
- American: 16,113 (7.9%)
- Irish: 10,690 (5.3%)
- European: 8,773 (4.3%)
- Italian: 8,094 (4.0%)
- Polish: 3,524 (1.7%)
- Scottish: 3,301 (1.6%)
- Norwegian: 2,894 (1.4%)
- African: 1,998 (1.0%)
- Scotch-Irish: 1,891 (0.9%)
- Swedish: 1,847 (0.9%)
- Dutch: 1,711 (0.8%)
- French: 1,385 (0.7%)
- Scandinavian: 1,053 (0.5%)
- British: 960 (0.5%)
- French Canadian: 823 (0.4%)
- Russian: 802 (0.4%)
- Hungarian: 750 (0.4%)
- Northern European: 740 (0.4%)
- Welsh: 682 (0.3%)
- Ukrainian: 617 (0.3%)
- Danish: 551 (0.3%)
- Jamaican: 508 (0.3%)
- Eastern European: 492 (0.2%)
- Czech: 452 (0.2%)
- Swiss: 444 (0.2%)
- Haitian: 402 (0.2%)
- Portuguese: 376 (0.2%)
- Ethiopian: 358 (0.2%)
- Lithuanian: 344 (0.2%)
- Croatian: 324 (0.2%)
- Canadian: 322 (0.2%)
- Austrian: 283 (0.1%)
- Romanian: 278 (0.1%)
- Iranian: 274 (0.1%)
- Brazilian: 256 (0.1%)
- Greek: 237 (0.1%)
- Slovene: 185 (0.09%)
- Slovak: 144 (0.07%)
- Serbian: 142 (0.07%)
- Nigerian: 128 (0.06%)
- Finnish: 121 (0.06%)
- Belgian: 115 (0.06%)
- Luxembourger: 108 (0.05%)
- Kenyan: 103 (0.05%)
- Yugoslavian: 102 (0.05%)
- Iraqi: 98 (0.05%)
- Czechoslovakian: 96 (0.05%)
- Arab: 94 (0.05%)
- Bulgarian: 87 (0.04%)
- Lebanese: 77 (0.04%)
- Egyptian: 76 (0.04%)
- Ghanaian: 76 (0.04%)
- New Zealander: 75 (0.04%)
- South African: 66 (0.03%)
- Palestinian: 64 (0.03%)
- Trinidadian and Tobagonian: 62 (0.03%)
- Celtic: 59 (0.03%)
- German Russian: 58 (0.03%)
- U.S. Virgin Islander: 57 (0.03%)
- Sudanese: 56 (0.03%)
- Belizean: 54 (0.03%)
- West Indian: 53 (0.03%)
- Carpatho Rusyn: 49 (0.02%)
- Latvian: 42 (0.02%)
- Afghan: 41 (0.02%)
- Australian: 41 (0.02%)
- Turkish: 39 (0.02%)
- Slavic: 36 (0.02%)
- British West Indian: 36 (0.02%)
- Armenian: 31 (0.02%)
- Liberian: 27 (0.01%)
- Alsatian: 27 (0.01%)
- Cape Verdean: 27 (0.01%)
- Basque: 25 (0.01%)
- Israeli: 22 (0.01%)
- Jordanian: 21 (0.01%)
- Macedonian: 21 (0.01%)
- Barbadian: 19 (0.01%)
- Somali: 19 (0.01%)
- Estonian: 12 (0.01%)
- Icelander: 11 (0.01%)
Most common places of birth for foreign-born residents (%):
| Colorado Springs: | 25.3% (9,317) |
| Colorado: | 38.3% (209,491) |
| Colorado Springs: | 7.4% (2,708) |
| Colorado: | 2.9% (15,981) |
| Colorado Springs: | 6.6% (2,440) |
| Colorado: | 2.5% (13,706) |
| Colorado Springs: | 5.4% (1,987) |
| Colorado: | 2.3% (12,342) |
| Colorado Springs: | 4.5% (1,668) |
| Colorado: | 2.7% (15,026) |
| Colorado Springs: | 3.3% (1,231) |
| Colorado: | 3.3% (17,998) |
| Colorado Springs: | 3.1% (1,153) |
| Colorado: | 4.0% (21,689) |
| Colorado Springs: | 2.8% (1,015) |
| Colorado: | 1.1% (6,142) |
| Colorado Springs: | 2.1% (773) |
| Colorado: | 3.0% (16,616) |
| Colorado Springs: | 1.8% (668) |
| Colorado: | 1.4% (7,898) |
| Colorado Springs: | 1.7% (639) |
| Colorado: | 0.8% (4,267) |
| Colorado Springs: | 1.6% (603) |
| Colorado: | 1.2% (6,672) |
| Colorado Springs: | 1.5% (554) |
| Colorado: | 1.0% (5,365) |
Place of birth for U.S.-born residents:
- This state: 159,089
- Other state: 278,399
- Northeast: 37,233
- Midwest: 83,208
- South: 83,144
- West: 74,814
80.4% of Colorado Springs residents lived in the same house 1 years ago.
Out of people who lived in different houses, 34.6% lived in this county.
Out of people who lived in different counties, 27.5% lived in Colorado.
| Colorado Springs: | 80.4% |
| State average: | 83.6% |
Education attainment for males 25 years and older:
- No schooling: 1,299
- Nursery to 4th grade: 30
- 5th and 6th grade: 242
- 7th and 8th grade: 390
- 9th grade: 633
- 10th grade: 681
- 11th grade: 1,872
- 12th grade, no diploma: 2,267
- High school graduate (or equivalency): 35,788
- Less than 1 year of college: 10,836
- Some college more than 1 year, no degree: 23,917
- Associate degree: 14,386
- Bachelor's degree: 42,846
- Master's degree: 23,262
- Professional school degree: 3,153
- Doctorate degree: 4,139

Education attainment for females 25 years and older:
- No schooling: 1,960
- Nursery to 4th grade: 274
- 5th and 6th grade: 91
- 7th and 8th grade: 263
- 9th grade: 447
- 10th grade: 1,679
- 11th grade: 1,136
- 12th grade, no diploma: 1,831
- High school graduate (or equivalency): 32,762
- Less than 1 year of college: 13,722
- Some college more than 1 year, no degree: 23,845
- Associate degree: 17,740
- Bachelor's degree: 43,841
- Master's degree: 24,077
- Professional school degree: 2,495
- Doctorate degree: 2,934


Housing units in structures:
- One, detached: 128,145
- One, attached: 19,522
- Two: 4,056
- 3 or 4: 6,136
- 5 to 9: 11,581
- 10 to 19: 13,194
- 20 to 49: 14,140
- 50 or more: 10,160
- Mobile homes: 6,118
- Boats, RVs, vans, etc.: 188
Median worth of mobile homes: $28,500
Housing units lacking complete kitchen facilities in 2022: 1.4%
House/condo owner moved in on average 9 years ago
Renter moved in on average 1 years ago

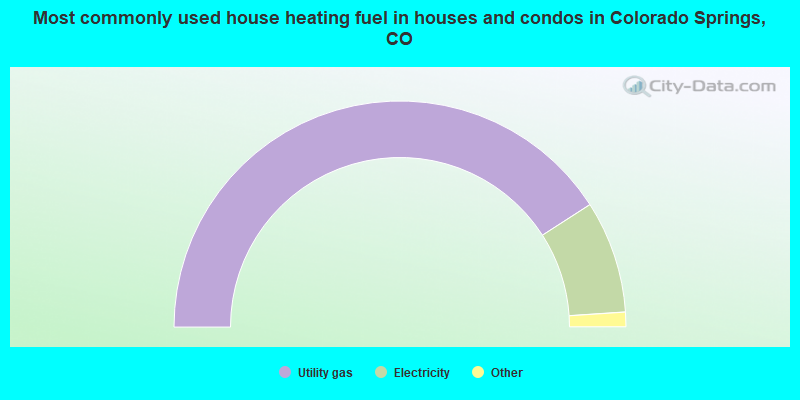
- 81.8%Utility gas
- 16.1%Electricity
- 1.1%Bottled, tank, or LP gas
- 0.4%No fuel used
- 0.3%Solar energy
- 0.1%Other fuel
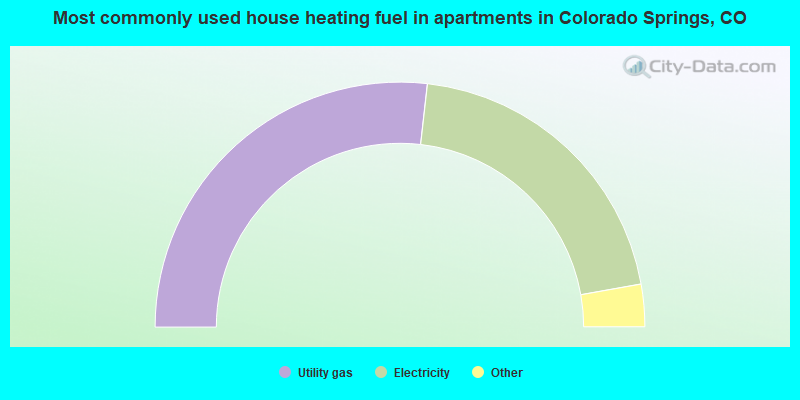
- 53.6%Utility gas
- 40.8%Electricity
- 2.5%Bottled, tank, or LP gas
- 1.3%Other fuel
- 1.0%Wood
- 0.8%No fuel used
- 0.1%Solar energy
Private vs. public school enrollment:
| Here: | 9.3% |
| Colorado: | 11.4% |
| Here: | 7.4% |
| Colorado: | 8.5% |
| Here: | 18.7% |
| Colorado: | 14.0% |


