Collinsville, VA (Virginia) Houses and Residents
| Collinsville: | $130,008 |
| Virginia: | $365,700 |
Total population: 7,335 (All urban)
Houses: 3,708 (3,129 occupied: 1,779 owner occupied, 1,384 renter occupied)
| % of renters here: | 44% |
| State: | 33% |
Housing density: 471 houses/condos per square mile
Median price asked for vacant for-sale houses and condos in 2022 in this county: $151,156.
Median contract rent in 2022: $571 (lower quartile is $464, upper quartile is $621)
Median rent asked for vacant for-rent units in 2022: $781
Median gross rent in Collinsville, VA in 2022: $685
Housing units in Collinsville with a mortgage: 1,013 (53 second mortgage, 0 home equity loan, 36 both second mortgage and home equity loan)
Houses without a mortgage: 0
Median household income for houses/condos with a mortgage: $68,729
Median household income for apartments without a mortgage: $34,784
Median monthly housing costs: $677
Compare current foreclosures near Collinsville, VA:
| Photo | Address | Area | Beds / Baths | Price | Details |
|---|---|---|---|---|---|

|
#1
Ridgecrest Ave
Collinsville, VA 24078
|
- sq. feet
|
- baths - beds |
show details | |

|
#2
Country Wood Ln Apt 3
Collinsville, VA 24078
|
- sq. feet
|
- baths - beds |
show details | |

|
#3
Belva Ln # 6
Collinsville, VA 24078
|
- sq. feet
|
- baths - beds |
show details | |

|
#4
7th St
Fieldale, VA 24089
|
1,213 sq. feet
|
1 baths 3 beds |
$160,000
|
show details |

|
#5
Autumn Dr
Collinsville, VA 24078
|
- sq. feet
|
- baths - beds |
show details | |

|
#6
Longview Dr
Collinsville, VA 24078
|
- sq. feet
|
- baths - beds |
show details | |

|
#7
Parkwood Pl
Collinsville, VA 24078
|
- sq. feet
|
- baths - beds |
show details | |

|
#8
Oakland Dr
Collinsville, VA 24078
|
- sq. feet
|
- baths - beds |
show details | |

|
#9
Lee St
Collinsville, VA 24078
|
- sq. feet
|
- baths - beds |
show details | |

|
#10
Ridge Rd
Collinsville, VA 24078
|
- sq. feet
|
- baths - beds |
show details |
| Photo | Address | Area | Beds / Baths | Price | Details |
|---|---|---|---|---|---|

|
#11
Miles Rd
Collinsville, VA 24078
|
- sq. feet
|
- baths - beds |
show details | |

|
#12
Austin Dr
Martinsville, VA 24112
|
- sq. feet
|
2 baths 2 beds |
$57,600
|
show details |

|
#13
Healms Rd
Bassett, VA 24055
|
- sq. feet
|
1 baths 3 beds |
show details | |

|
#14
Prillaman Switch Rd
Ferrum, VA 24088
|
884 sq. feet
|
1 baths 3 beds |
show details | |

|
#15
Maid Marian Ct
Bassett, VA 24055
|
2,708 sq. feet
|
2 baths 3 beds |
show details | |

|
#16
Jessica Ave
Bassett, VA 24055
|
1,188 sq. feet
|
2 baths 3 beds |
show details | |

|
#17
Dalewood Ln
Rocky Mount, VA 24151
|
1,104 sq. feet
|
1 baths 3 beds |
show details | |

|
#18
Haw Patch Rd
Ferrum, VA 24088
|
1,404 sq. feet
|
2 baths 3 beds |
show details | |

|
#19
Chestnut Oak Ln
Rocky Mount, VA 24151
|
1,792 sq. feet
|
2 baths 3 beds |
show details | |

|
#20
Snow Creek Rd
Penhook, VA 24137
|
775 sq. feet
|
1 baths 2 beds |
show details |
| Photo | Address | Area | Beds / Baths | Price | Details |
|---|---|---|---|---|---|

|
#21
Virgil H Goode Hwy
Rocky Mount, VA 24151
|
1,296 sq. feet
|
1 baths 3 beds |
show details | |

|
#22
Sontag Rd
Rocky Mount, VA 24151
|
1,120 sq. feet
|
2 baths 2 beds |
show details | |

|
#23
Maple Springs Dr
Axton, VA 24054
|
1,149 sq. feet
|
1 baths 3 beds |
show details | |

|
#24
Egg Farm Rd
Patrick Springs, VA 24133
|
- sq. feet
|
1 baths 2 beds |
show details | |

|
#25
Loblolly Dr
Axton, VA 24054
|
1,350 sq. feet
|
2 baths 3 beds |
show details | |

|
#26
Westerly Park Rd
Eden, NC 27288
|
1,034 sq. feet
|
- baths 3 beds |
show details | |

|
#27
Mosco Rd
Axton, VA 24054
|
1,728 sq. feet
|
2 baths 3 beds |
show details | |

|
#28
Davis Mill Rd
Rocky Mount, VA 24151
|
1,176 sq. feet
|
1 baths 2 beds |
show details | |

|
#29
Lucy Wade Rd
Rocky Mount, VA 24151
|
925 sq. feet
|
1 baths 3 beds |
show details | |

|
#30
Sunrise Ave
Martinsville, VA 24112
|
1,320 sq. feet
|
- baths - beds |
show details |
| Photo | Address | Area | Beds / Baths | Price | Details |
|---|---|---|---|---|---|

|
#31
Riverside Dr
Eden, NC 27288
|
- sq. feet
|
- baths - beds |
show details | |

|
#32
Hobson Rd
Axton, VA 24054
|
- sq. feet
|
- baths - beds |
show details | |

|
#33
Robertson Ln
Rocky Mount, VA 24151
|
- sq. feet
|
- baths - beds |
show details | |

|
#34
Old Well Rd
Spencer, VA 24165
|
- sq. feet
|
- baths - beds |
show details | |

|
#35
Maple Leaf Rd
Spencer, VA 24165
|
- sq. feet
|
- baths - beds |
show details | |

|
#36
Morningside Dr
Bassett, VA 24055
|
- sq. feet
|
- baths - beds |
show details | |

|
#37
Hill Street
Eden, NC 27288
|
- sq. feet
|
- baths - beds |
show details | |

|
#38
Clay Hodge Ln
Axton, VA 24054
|
- sq. feet
|
- baths - beds |
show details | |

|
#39
Kings Mill Rd
Ridgeway, VA 24148
|
- sq. feet
|
- baths - beds |
show details | |

|
#40
Henry Rd
Henry, VA 24102
|
- sq. feet
|
- baths - beds |
show details |
| Photo | Address | Area | Beds / Baths | Price | Details |
|---|---|---|---|---|---|

|
#41
Golf Course Rd
Stuart, VA 24171
|
- sq. feet
|
- baths - beds |
show details | |

|
#42
Brookside Rd
Axton, VA 24054
|
- sq. feet
|
- baths - beds |
show details | |

|
#43
Anglin Mill Rd
Stoneville, NC 27048
|
1,296 sq. feet
|
- baths - beds |
show details | |

|
#44
Mosco Rd
Axton, VA 24054
|
- sq. feet
|
- baths - beds |
show details | |

|
#45
E Warren Ave
Eden, NC 27288
|
1,512 sq. feet
|
- baths - beds |
show details | |

|
#46
Plantation Dr Lot 5
Axton, VA 24054
|
- sq. feet
|
- baths - beds |
show details | |

|
#47
Wonderland Ln
Ferrum, VA 24088
|
- sq. feet
|
- baths - beds |
show details | |

|
#48
Sunset Dr
Eden, NC 27288
|
1,320 sq. feet
|
- baths - beds |
show details | |

|
#49
Franklin St # D
Ferrum, VA 24088
|
- sq. feet
|
- baths - beds |
show details | |

|
Check over 1 million property listings on Foreclosure.com!
|
browse all offers | |||

Latest news about housing in Collinsville, VA collected exclusively by city-data.com from local newspapers, TV, and radio stations

 | Poisionous spiders in Virginia (53 replies) |
| Where is the best place to live in Virginia? PLEASE ANSWER!!! (57 replies) |
| henry co relocation (1 reply) |
| House Church near Martinsville, Danville, or Blacksburg (12 replies) |
| Need a good area in/near Roanoke for retirees (5 replies) |
| Small Town VA with a mountain view? (16 replies) |

Median year apartment built: 1981
Household type by relationship:
Households: 7,692- Male householders: 1,320 (409 living alone), Female householders: 1,779 (674 living alone)
1,245 spouses (1,245 opposite-sex spouses), 204 unmarried partners, (204 opposite-sex unmarried partners), 2,534 children (2,402 natural, 0 adopted, 131 stepchildren), 49 grandchildren, 84 brothers or sisters, 53 parents, 0 foster children, 133 other relatives, 228 non-relatives
- In group quarters: 58
Size of family households: 891 2-persons, 650 3-persons, 127 4-persons, 45 5-persons, 131 6-persons, 37 7-or-more-persons.
Size of nonfamily households: 1,115 1-person, 141 2-persons, 44 3-persons.
1,065 married couples with children.
755 single-parent households (360 men, 395 women).
86.3% of residents of Collinsville speak English at home.
9.3% of residents speak Spanish at home (66% speak English very well, 21% speak English well, 13% speak English not well).
2.2% of residents speak other Indo-European language at home (77% speak English very well, 23% speak English well).
0.3% of residents speak Asian or Pacific Island language at home (100% speak English very well).
1.3% of residents speak other language at home (30% speak English very well, 70% speak English not well).
Foreign born population: 389 (5.1%)
(60.9% of them are naturalized citizens)
| Here: | 6.3 |
| State: | 7.0 |
| Here: | 4.3 |
| State: | 4.3 |

- Bedrooms in owner-occupied houses and condos in Collinsville, Virginia
- 0no bedroom
- 01 bedroom
- 3612 bedrooms
- 9153 bedrooms
- 4404 bedrooms
- 655+ bedrooms

- Bedrooms in renter-occupied apartments in Collinsville, Virginia
- 68no bedroom
- 1661 bedroom
- 6982 bedrooms
- 3973 bedrooms
- 464 bedrooms
- 95+ bedrooms

- Cars and other vehicles available in Collinsville in owner-occupied houses/condos
- 26no vehicle
- 3901 vehicle
- 6272 vehicles
- 4603 vehicles
- 1044 vehicles
- 1735+ vehicles

- Cars and other vehicles available in Collinsville in renter-occupied apartments
- 174no vehicle
- 5471 vehicle
- 4382 vehicles
- 2063 vehicles
- 214 vehicles
- 05+ vehicles

- Rooms in owner-occupied houses in Collinsville, Virginia
- 01 room
- 02 rooms
- 03 rooms
- 784 rooms
- 3295 rooms
- 5956 rooms
- 3107 rooms
- 2848 rooms
- 1849+ rooms

- Rooms in renter-occupied apartments in Collinsville, Virginia
- 681 room
- 492 rooms
- 2503 rooms
- 3804 rooms
- 4315 rooms
- 996 rooms
- 377 rooms
- 348 rooms
- 379+ rooms


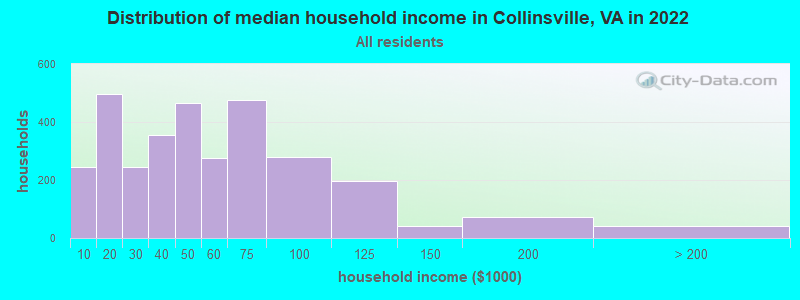
Collinsville, VA household income distribution

- 245Less than $10,000
- 495$10,000 to $19,999
- 246$20,000 to $29,999
- 355$30,000 to $39,999
- 466$40,000 to $49,999
- 276$50,000 to $59,999
- 477$60,000 to $74,999
- 281$75,000 to $99,999
- 196$100,000 to $124,999
- 41$125,000 to $149,999
- 73$150,000 to $199,999
- 40$200,000 or more
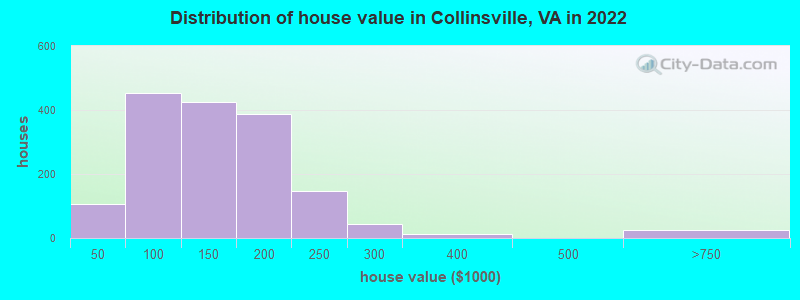
Home value of owner - occupied houses in 2022 in Collinsville, VA
-
- 24$10,000 to $14,999
- 5$15,000 to $19,999
- 12$20,000 to $24,999
- 7$25,000 to $29,999
- 30$35,000 to $39,999
- 26$40,000 to $49,999
- 69$50,000 to $59,999
- 25$60,000 to $69,999
- 89$70,000 to $79,999
- 149$80,000 to $89,999
- 92$90,000 to $99,999
- 335$100,000 to $124,999
- 90$125,000 to $149,999
- 289$150,000 to $174,999
- 99$175,000 to $199,999
- 147$200,000 to $249,999
- 43$250,000 to $299,999
- 13$300,000 to $399,999
- 25$500,000 to $749,999
Rent paid by renters in 2022 in Collinsville, VA
-
- 11$150 to $199
- 17$200 to $249
- 10$250 to $299
- 30$300 to $349
- 55$350 to $399
- 187$400 to $449
- 157$450 to $499
- 135$500 to $549
- 288$550 to $599
- 159$600 to $649
- 70$650 to $699
- 31$700 to $749
- 10$750 to $799
- 57$1,000 to $1,249
- 23$1,250 to $1,499
- 22$1,500 to $1,999
- 18$2,500 to $2,999
- 27No cash rent


Percentage of workers working in this county: 63.2%
Number of people working at home: 113 (3.3% of all workers)
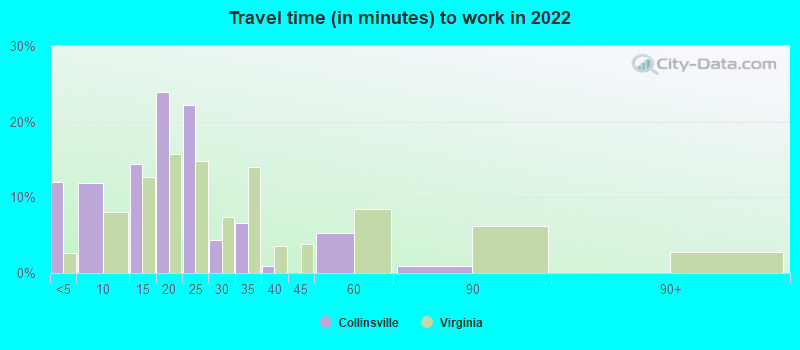
Travel time to work (commute)
- Less than 5 minutes: 222
- 5 to 9 minutes: 407
- 10 to 14 minutes: 612
- 15 to 19 minutes: 1,019
- 20 to 24 minutes: 299
- 25 to 29 minutes: 59
- 30 to 34 minutes: 180
- 35 to 39 minutes: 61
- 40 to 44 minutes: 72
- 45 to 59 minutes: 109
- 60 to 89 minutes: 156
- 90 or more minutes: 0
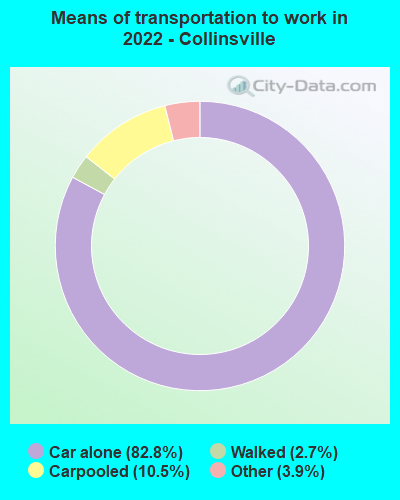
Means of transportation to work:
- Drove a car alone: 1,525 (75.5%)
- Carpooled: 196 (9.7%)
- Taxi: 88 (4.4%)
- Walked: 53 (2.6%)
- Worked at home: 113 (5.6%)

- Unemployment by race in 2022
- Unemployment rate for White non-Hispanic residents
- 6.2%Males
- 4.1%Females
- Unemployment rate for Black residents
- 3.2%Males
- 9.2%Females
- Unemployment rate for two or more race residents
- 15.7%Males
- Unemployment rate for Hispanic or Latino residents
- 18.4%Males

- Year of entry for the foreign-born population in Collinsville, Virginia
- 1072010 or later
- 1392000 to 2009
- 491990 to 1999
- 531980 to 1989
- 71970 to 1979
- 8Before 1970

First ancestries reported:
- American: 1,477 (29.4%)
- English: 581 (11.6%)
- Irish: 245 (4.9%)
- German: 145 (2.9%)
- Italian: 115 (2.3%)
- Egyptian: 111 (2.2%)
- European: 62 (1.2%)
- British: 53 (1.1%)
- Scottish: 46 (0.9%)
- Scotch-Irish: 27 (0.5%)
- Welsh: 14 (0.3%)
- Polish: 13 (0.3%)
- Greek: 9 (0.2%)
Most common places of birth for foreign-born residents (%):
| Collinsville: | 38.1% (143) |
| Virginia: | 5.3% (57,498) |
| Collinsville: | 19.7% (74) |
| Virginia: | 0.5% (5,147) |
| Collinsville: | 13.9% (52) |
| Virginia: | 3.0% (32,892) |
| Collinsville: | 11.2% (42) |
| Virginia: | 9.0% (97,830) |
| Collinsville: | 8.3% (31) |
| Virginia: | 0.9% (9,672) |
| Collinsville: | 8.0% (30) |
| Virginia: | 0.0% (269) |
| Collinsville: | 4.0% (15) |
| Virginia: | 3.3% (35,938) |
Place of birth for U.S.-born residents:
- This state: 5,631
- Other state: 1,504
- Northeast: 289
- Midwest: 83
- South: 1,028
- West: 100
92.3% of Collinsville residents lived in the same house 1 years ago.
Out of people who lived in different houses, 34.1% lived in this county.
Out of people who lived in different counties, 100.0% lived in Virginia.
| Collinsville: | 92.3% |
| State average: | 86.6% |
Education attainment for males 25 years and older:
- No schooling: 26
- Nursery to 4th grade: 20
- 5th and 6th grade: 42
- 7th and 8th grade: 102
- 9th grade: 10
- 10th grade: 55
- 11th grade: 100
- 12th grade, no diploma: 32
- High school graduate (or equivalency): 802
- Less than 1 year of college: 128
- Some college more than 1 year, no degree: 296
- Associate degree: 141
- Bachelor's degree: 330
- Master's degree: 189
- Professional school degree: 0
- Doctorate degree: 6

Education attainment for females 25 years and older:
- No schooling: 96
- Nursery to 4th grade: 0
- 5th and 6th grade: 0
- 7th and 8th grade: 68
- 9th grade: 32
- 10th grade: 97
- 11th grade: 30
- 12th grade, no diploma: 15
- High school graduate (or equivalency): 799
- Less than 1 year of college: 124
- Some college more than 1 year, no degree: 239
- Associate degree: 391
- Bachelor's degree: 524
- Master's degree: 342
- Professional school degree: 0
- Doctorate degree: 0


Housing units in structures:
- One, detached: 2,062
- One, attached: 81
- Two: 36
- 3 or 4: 358
- 5 to 9: 174
- 10 to 19: 419
- 20 to 49: 91
- 50 or more: 34
- Mobile homes: 448
Housing units lacking complete kitchen facilities in 2022: 1.3%
House/condo owner moved in on average 17 years ago
Renter moved in on average 4 years ago

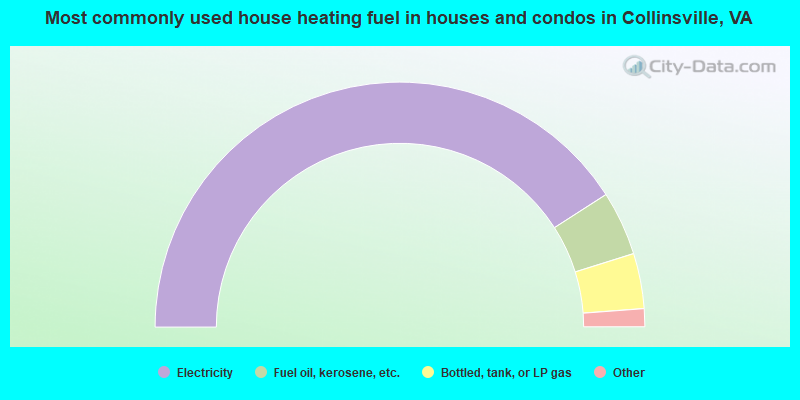
- 81.9%Electricity
- 8.5%Fuel oil, kerosene, etc.
- 7.3%Bottled, tank, or LP gas
- 1.8%Utility gas
- 0.5%No fuel used
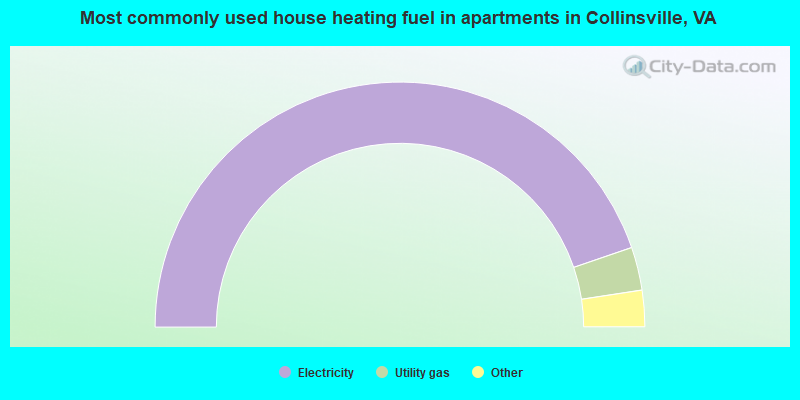
- 89.5%Electricity
- 5.7%Utility gas
- 3.5%Fuel oil, kerosene, etc.
- 0.7%No fuel used
- 0.6%Bottled, tank, or LP gas
Private vs. public school enrollment:
| Here: | 0.0% |
| Virginia: | 13.2% |
| Here: | 5.7% |
| Virginia: | 10.2% |
| Here: | 42.4% |
| Virginia: | 18.7% |


