Colesville, MD (Maryland) Houses and Residents
| Colesville: | $584,598 |
| Maryland: | $398,100 |
Mean price in 2022:
Detached houses: $602,084
Here: $602,084 State: $526,819 Townhouses or other attached units: $437,773
Here: $437,773 State: $328,305
Total population: 14,647 (All urban)
Houses: 5,290 (5,008 occupied: 4,374 owner occupied, 672 renter occupied)
| % of renters here: | 13% |
| State: | 32% |
Housing density: 573 houses/condos per square mile
Median price asked for vacant for-sale houses and condos in 2022: $2,421,041.
Median contract rent in 2022: $1,390 (lower quartile is $1,224, upper quartile is over $2,000)
Median rent asked for vacant for-rent units in 2022: $1,602
Median gross rent in Colesville, MD in 2022: $1,746
Housing units in Colesville with a mortgage: 2,813 (371 second mortgage, 0 home equity loan, 313 both second mortgage and home equity loan)
Houses without a mortgage: 31
Median household income for houses/condos with a mortgage: $164,476
Median household income for apartments without a mortgage: $104,297
Median monthly housing costs: $1,937
Compare current foreclosures near Colesville, MD:
| Photo | Address | Area | Beds / Baths | Price | Details |
|---|---|---|---|---|---|

|
#1
Applegarth Pl
Capitol Heights, MD 20743
|
1,200 sq. feet
|
1 baths 3 beds |
$314,900
|
show details |

|
#2
Pooks Hill Rd Apt 1612s
Bethesda, MD 20814
|
1,250 sq. feet
|
1 baths 2 beds |
$289,000
|
show details |

|
#3
Hammersmith Cir
Silver Spring, MD 20906
|
1,152 sq. feet
|
1 baths 3 beds |
$353,600
|
show details |

|
#4
Fitzgibbon Ct
Bowie, MD 20721
|
1,300 sq. feet
|
2 baths 3 beds |
$369,200
|
show details |

|
#5
Monroe St NW
Washington, DC 20010
|
- sq. feet
|
2 baths 2 beds |
$665,000
|
show details |

|
#6
Cathedral Ave NW Apt 108
Washington, DC 20016
|
765 sq. feet
|
1 baths 1 beds |
$269,900
|
show details |

|
#7
Addison Rd
Capitol Heights, MD 20743
|
1,400 sq. feet
|
1 baths 3 beds |
$260,000
|
show details |

|
#8
Brooke Knolls Rd
Gaithersburg, MD 20882
|
1,704 sq. feet
|
3 baths 4 beds |
$681,500
|
show details |

|
#9
19th St NW
Washington, DC 20036
|
2,515 sq. feet
|
6 baths 8 beds |
$1,684,800
|
show details |

|
#10
Eastern Ave NE
Washington, DC 20011
|
1,024 sq. feet
|
1 baths 3 beds |
$395,000
|
show details |
| Photo | Address | Area | Beds / Baths | Price | Details |
|---|---|---|---|---|---|

|
#11
Gladys Retreat Cir
Bowie, MD 20720
|
2,880 sq. feet
|
3 baths 3 beds |
$409,900
|
show details |

|
#12
Heming Ln
Bowie, MD 20716
|
1,800 sq. feet
|
2 baths 3 beds |
$400,000
|
show details |

|
#13
9th St NW
Washington, DC 20011
|
1,604 sq. feet
|
2 baths 3 beds |
$598,000
|
show details |

|
#14
17th St NW Apt 504
Washington, DC 20009
|
800 sq. feet
|
1 baths 1 beds |
$405,000
|
show details |

|
#15
Mandan Rd Apt 103 Unit 621
Greenbelt, MD 20770
|
1,420 sq. feet
|
2 baths 3 beds |
$179,900
|
show details |

|
#16
Ensleigh Ln
Bowie, MD 20716
|
1,656 sq. feet
|
2 baths 3 beds |
$374,900
|
show details |

|
#17
Wilson Ln Apt 204
Mc Lean, VA 22102
|
925 sq. feet
|
1 baths 2 beds |
$359,900
|
show details |

|
#18
Interlachen Dr Apt 111
Silver Spring, MD 20906
|
965 sq. feet
|
1 baths 2 beds |
$148,000
|
show details |

|
#19
T St SE Apt 3
Washington, DC 20020
|
- sq. feet
|
2 baths 4 beds |
$307,500
|
show details |

|
#20
Delaware Ave SW Apt N720
Washington, DC 20024
|
- sq. feet
|
1 baths 1 beds |
$149,900
|
show details |
| Photo | Address | Area | Beds / Baths | Price | Details |
|---|---|---|---|---|---|

|
#21
Oakwood St SE Apt B5
Washington, DC 20032
|
628 sq. feet
|
1 baths 1 beds |
show details | |

|
#22
Caledonia Ct Apt K
Germantown, MD 20874
|
1,087 sq. feet
|
2 baths 2 beds |
show details | |

|
#23
Holbrook Ter NE
Washington, DC 20002
|
3,164 sq. feet
|
4 baths 8 beds |
show details | |

|
#24
13th Ave
Hyattsville, MD 20782
|
1,598 sq. feet
|
1 baths 4 beds |
show details | |

|
#25
28th St SE
Washington, DC 20020
|
1,200 sq. feet
|
3 baths 3 beds |
show details | |

|
#26
Plainfield St
Falls Church, VA 22043
|
1,102 sq. feet
|
3 baths 4 beds |
show details | |

|
#27
Dana Dr
Hyattsville, MD 20783
|
2,380 sq. feet
|
2 baths 3 beds |
show details | |

|
#28
Henderson Chapel Ln
Bowie, MD 20720
|
4,002 sq. feet
|
3 baths 4 beds |
show details | |

|
#29
Softwater Way
Columbia, MD 21046
|
1,520 sq. feet
|
3 baths 4 beds |
show details | |

|
#30
Brooke Rd
Sandy Spring, MD 20860
|
5,046 sq. feet
|
4 baths 4 beds |
show details |
| Photo | Address | Area | Beds / Baths | Price | Details |
|---|---|---|---|---|---|

|
#31
Mcwhorter Farm Ct
Damascus, MD 20872
|
6,621 sq. feet
|
6 baths 5 beds |
show details | |

|
#32
47th St NE
Washington, DC 20019
|
2,363 sq. feet
|
2 baths 5 beds |
show details | |

|
#33
Warner Ave
Hyattsville, MD 20784
|
1,200 sq. feet
|
2 baths 3 beds |
show details | |

|
#34
Byers St
Capitol Heights, MD 20743
|
2,238 sq. feet
|
2 baths 2 beds |
show details | |

|
#35
Halley Pl SE Apt 204
Washington, DC 20032
|
934 sq. feet
|
1 baths 3 beds |
show details | |

|
#36
Brassie Pl Apt 201
Montgomery Village, MD 20886
|
1,054 sq. feet
|
2 baths 2 beds |
show details | |

|
#37
Elfin Ave
Capitol Heights, MD 20743
|
1,146 sq. feet
|
2 baths 3 beds |
show details | |

|
#38
Cathedral Ave NW Apt 404w
Washington, DC 20016
|
803 sq. feet
|
1 baths 1 beds |
show details | |

|
#39
Oakland Mills Rd
Columbia, MD 21046
|
- sq. feet
|
3 baths 4 beds |
show details | |

|
#40
55th Ave
Bladensburg, MD 20710
|
1,023 sq. feet
|
3 baths 5 beds |
show details |
| Photo | Address | Area | Beds / Baths | Price | Details |
|---|---|---|---|---|---|

|
#41
Deanwood Dr
Capitol Heights, MD 20743
|
640 sq. feet
|
1 baths 1 beds |
show details | |

|
#42
Sargent Rd NE
Washington, DC 20017
|
1,360 sq. feet
|
2 baths 3 beds |
show details | |

|
#43
Jefferson St NW
Washington, DC 20011
|
1,280 sq. feet
|
5 baths 6 beds |
show details | |

|
#44
Manor Ln
Ellicott City, MD 21042
|
864 sq. feet
|
1 baths 2 beds |
show details | |

|
#45
Avena St
Silver Spring, MD 20902
|
1,188 sq. feet
|
2 baths 3 beds |
show details | |

|
#46
Scaffold Way
Odenton, MD 21113
|
1,664 sq. feet
|
4 baths 4 beds |
show details | |

|
#47
Myrtle Ave
Bowie, MD 20720
|
3,436 sq. feet
|
2 baths 4 beds |
show details | |

|
#48
Grant St NE
Washington, DC 20019
|
1,152 sq. feet
|
1 baths 3 beds |
show details | |

|
#49
Trenton Pl SE
Washington, DC 20032
|
1,872 sq. feet
|
3 baths 4 beds |
show details | |

|
Check over 1 million property listings on Foreclosure.com!
|
browse all offers | |||

Latest news about housing in Colesville, MD collected exclusively by city-data.com from local newspapers, TV, and radio stations


Median year apartment built: 1982
Household type by relationship:
Households: 13,647- Male householders: 2,611 (426 living alone), Female householders: 2,337 (613 living alone)
2,909 spouses (2,827 opposite-sex spouses), 202 unmarried partners, (202 opposite-sex unmarried partners), 3,511 children (3,227 natural, 116 adopted, 167 stepchildren), 315 grandchildren, 181 brothers or sisters, 223 parents, 0 foster children, 577 other relatives, 573 non-relatives
- In group quarters: 204
Size of family households: 1,850 2-persons, 595 3-persons, 519 4-persons, 309 5-persons, 243 6-persons, 98 7-or-more-persons.
Size of nonfamily households: 1,187 1-person, 162 2-persons, 30 3-persons, 61 5-persons.
1,190 married couples with children.
640 single-parent households (100 men, 540 women).
58.9% of residents of Colesville speak English at home.
12.0% of residents speak Spanish at home (60% speak English very well, 29% speak English well, 11% speak English not well).
13.5% of residents speak other Indo-European language at home (78% speak English very well, 16% speak English well, 3% speak English not well, 4% don't speak English at all).
9.6% of residents speak Asian or Pacific Island language at home (36% speak English very well, 38% speak English well, 24% speak English not well, 2% don't speak English at all).
7.3% of residents speak other language at home (93% speak English very well, 6% speak English well, 1% don't speak English at all).
Foreign born population: 4,840 (35.5%)
(77.6% of them are naturalized citizens)
| Here: | 9.9 |
| State: | 7.3 |
| Here: | 4.1 |
| State: | 4.2 |

- Bedrooms in owner-occupied houses and condos in Colesville, Maryland
- 0no bedroom
- 01 bedroom
- 1092 bedrooms
- 9283 bedrooms
- 2,0544 bedrooms
- 1,2845+ bedrooms

- Bedrooms in renter-occupied apartments in Colesville, Maryland
- 55no bedroom
- 3081 bedroom
- 602 bedrooms
- 1703 bedrooms
- 374 bedrooms
- 445+ bedrooms

- Cars and other vehicles available in Colesville in owner-occupied houses/condos
- 10no vehicle
- 9311 vehicle
- 2,2222 vehicles
- 6603 vehicles
- 3364 vehicles
- 2145+ vehicles

- Cars and other vehicles available in Colesville in renter-occupied apartments
- 232no vehicle
- 2161 vehicle
- 1692 vehicles
- 563 vehicles
- 04 vehicles
- 05+ vehicles

- Rooms in owner-occupied houses in Colesville, Maryland
- 01 room
- 02 rooms
- 03 rooms
- 2124 rooms
- 1745 rooms
- 2566 rooms
- 6037 rooms
- 8078 rooms
- 2,3229+ rooms

- Rooms in renter-occupied apartments in Colesville, Maryland
- 451 room
- 172 rooms
- 1563 rooms
- 1964 rooms
- 85 rooms
- 816 rooms
- 637 rooms
- 258 rooms
- 809+ rooms


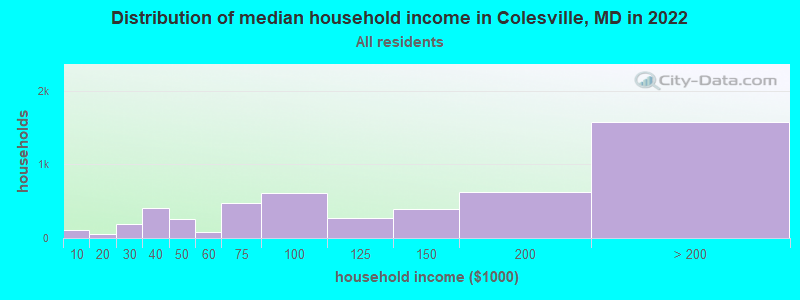
Colesville, MD household income distribution

- 109Less than $10,000
- 59$10,000 to $19,999
- 193$20,000 to $29,999
- 407$30,000 to $39,999
- 263$40,000 to $49,999
- 86$50,000 to $59,999
- 476$60,000 to $74,999
- 615$75,000 to $99,999
- 268$100,000 to $124,999
- 387$125,000 to $149,999
- 628$150,000 to $199,999
- 1,574$200,000 or more
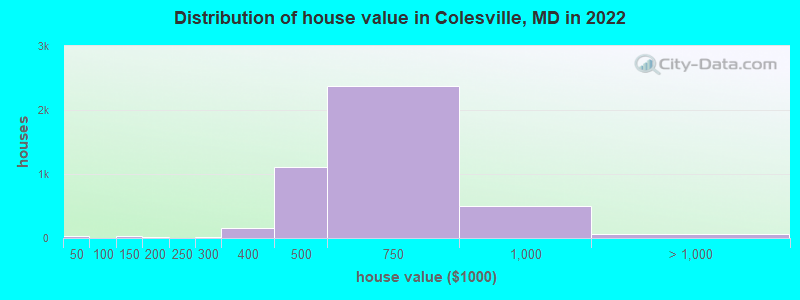
Home value of owner - occupied houses in 2022 in Colesville, MD
-
- 29Less than $10,000
- 31$100,000 to $124,999
- 5$125,000 to $149,999
- 10$150,000 to $174,999
- 11$250,000 to $299,999
- 149$300,000 to $399,999
- 1,113$400,000 to $499,999
- 2,377$500,000 to $749,999
- 504$750,000 to $999,999
- 62$1,000,000 to $1,499,999
Rent paid by renters in 2022 in Colesville, MD
-
- 15$150 to $199
- 48$600 to $649
- 91$1,000 to $1,249
- 355$1,250 to $1,499
- 37$1,500 to $1,999
- 186$2,000 to $2,499
- 22$2,500 to $2,999

Percentage of workers working in this county: 66.9%
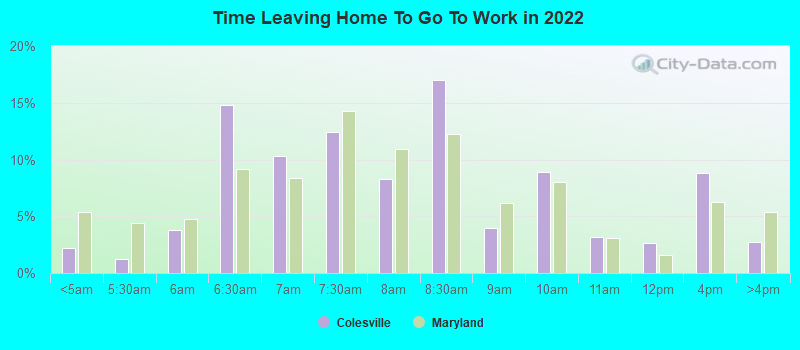
Number of people working at home: 2,294 (35.6% of all workers)
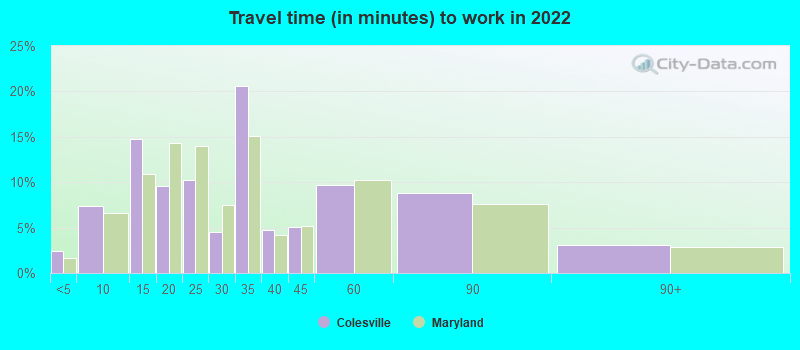
Travel time to work (commute)
- Less than 5 minutes: 74
- 5 to 9 minutes: 191
- 10 to 14 minutes: 297
- 15 to 19 minutes: 344
- 20 to 24 minutes: 415
- 25 to 29 minutes: 555
- 30 to 34 minutes: 677
- 35 to 39 minutes: 284
- 40 to 44 minutes: 329
- 45 to 59 minutes: 567
- 60 to 89 minutes: 485
- 90 or more minutes: 64
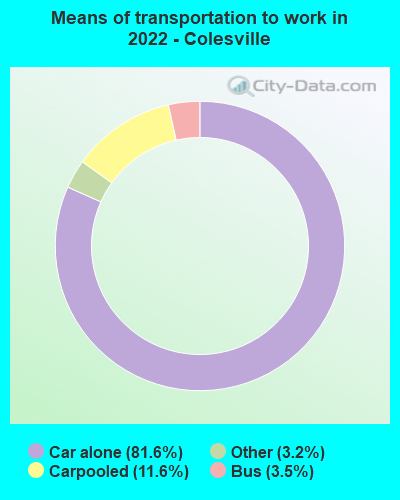
Means of transportation to work:
- Drove a car alone: 1,121 (34.0%)
- Carpooled: 169 (5.1%)
- Bus: 41 (1.2%)
- Taxi: 47 (1.4%)
- Worked at home: 2,294 (69.5%)
- Unemployment by race in 2022
- Unemployment rate for White non-Hispanic residents
- 1.7%Males
- 3.4%Females
- Unemployment rate for Black residents
- 4.6%Males
- 1.3%Females
- Unemployment rate for Asian residents
- 5.2%Males
- 11.1%Females
- Unemployment rate for two or more race residents
- 2.7%Females

- Year of entry for the foreign-born population in Colesville, Maryland
- 7242010 or later
- 9352000 to 2009
- 1,2631990 to 1999
- 1,5131980 to 1989
- 1,2531970 to 1979
- 839Before 1970
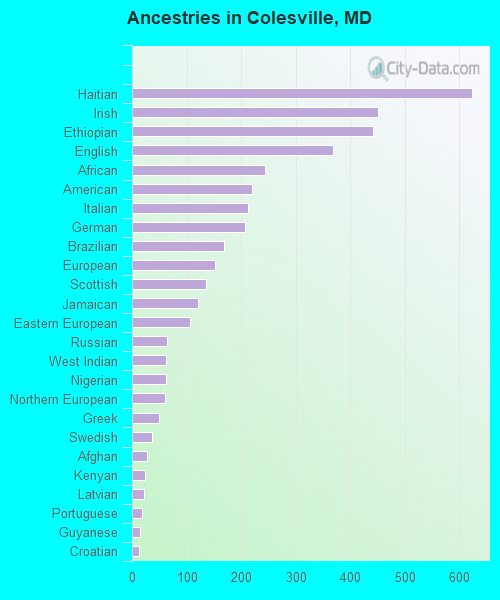
First ancestries reported:
- Haitian: 623 (7.3%)
- Irish: 451 (5.3%)
- Ethiopian: 441 (5.2%)
- English: 369 (4.3%)
- African: 243 (2.9%)
- American: 219 (2.6%)
- Italian: 212 (2.5%)
- German: 207 (2.4%)
- Brazilian: 168 (2.0%)
- European: 152 (1.8%)
- Scottish: 136 (1.6%)
- Jamaican: 121 (1.4%)
- Eastern European: 107 (1.3%)
- Russian: 65 (0.8%)
- West Indian: 63 (0.7%)
- Nigerian: 62 (0.7%)
- Northern European: 60 (0.7%)
- Greek: 49 (0.6%)
- Swedish: 36 (0.4%)
- Afghan: 27 (0.3%)
- Kenyan: 24 (0.3%)
- Latvian: 22 (0.3%)
- Portuguese: 19 (0.2%)
- Guyanese: 14 (0.2%)
- Croatian: 13 (0.2%)
- Barbadian: 12 (0.1%)
- South African: 11 (0.1%)
- British: 9 (0.1%)
- Trinidadian and Tobagonian: 9 (0.1%)
- Polish: 8 (0.09%)
- Dutch: 5 (0.06%)
- U.S. Virgin Islander: 5 (0.06%)
- Liberian: 2 (0.02%)
Most common places of birth for foreign-born residents (%):
| Colesville: | 15.2% (736) |
| Maryland: | 3.2% (30,870) |
| Colesville: | 11.2% (542) |
| Maryland: | 0.9% (9,100) |
| Colesville: | 8.6% (418) |
| Maryland: | 12.0% (115,412) |
| Colesville: | 6.3% (303) |
| Maryland: | 1.9% (18,716) |
| Colesville: | 4.6% (222) |
| Maryland: | 6.4% (61,725) |
| Colesville: | 4.4% (212) |
| Maryland: | 4.6% (44,742) |
| Colesville: | 4.3% (210) |
| Maryland: | 3.4% (32,635) |
| Colesville: | 4.1% (198) |
| Maryland: | 0.7% (7,000) |
| Colesville: | 3.9% (190) |
| Maryland: | 0.9% (8,603) |
| Colesville: | 3.8% (183) |
| Maryland: | 0.7% (7,124) |
| Colesville: | 2.7% (131) |
| Maryland: | 0.5% (4,596) |
| Colesville: | 2.4% (114) |
| Maryland: | 2.8% (27,444) |
| Colesville: | 2.3% (112) |
| Maryland: | 0.6% (5,899) |
| Colesville: | 2.1% (103) |
| Maryland: | 0.3% (2,848) |
| Colesville: | 1.9% (92) |
| Maryland: | 4.6% (44,825) |
| Colesville: | 1.8% (86) |
| Maryland: | 0.8% (8,109) |
| Colesville: | 1.6% (79) |
| Maryland: | 4.4% (42,350) |
Place of birth for U.S.-born residents:
- This state: 3,132
- Other state: 5,270
- Northeast: 1,458
- Midwest: 813
- South: 2,457
- West: 558
93.6% of Colesville residents lived in the same house 1 years ago.
Out of people who lived in different houses, 33.8% lived in this county.
Out of people who lived in different counties, 60.8% lived in Maryland.
| Colesville: | 93.6% |
| State average: | 88.5% |
Education attainment for males 25 years and older:
- No schooling: 142
- Nursery to 4th grade: 69
- 5th and 6th grade: 23
- 7th and 8th grade: 22
- 9th grade: 38
- 10th grade: 15
- 11th grade: 0
- 12th grade, no diploma: 68
- High school graduate (or equivalency): 903
- Less than 1 year of college: 183
- Some college more than 1 year, no degree: 418
- Associate degree: 278
- Bachelor's degree: 1,398
- Master's degree: 931
- Professional school degree: 291
- Doctorate degree: 296

Education attainment for females 25 years and older:
- No schooling: 155
- Nursery to 4th grade: 31
- 5th and 6th grade: 132
- 7th and 8th grade: 12
- 9th grade: 0
- 10th grade: 31
- 11th grade: 0
- 12th grade, no diploma: 46
- High school graduate (or equivalency): 812
- Less than 1 year of college: 264
- Some college more than 1 year, no degree: 499
- Associate degree: 327
- Bachelor's degree: 1,491
- Master's degree: 1,117
- Professional school degree: 208
- Doctorate degree: 289


Housing units in structures:
- One, detached: 4,404
- One, attached: 449
- 20 to 49: 18
- 50 or more: 418
Housing units lacking complete kitchen facilities in 2022: 1.8%
House/condo owner moved in on average 19 years ago
Renter moved in on average 6 years ago

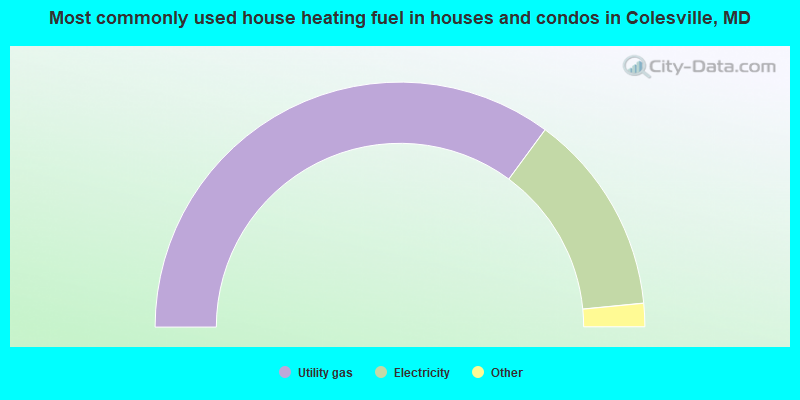
- 70.2%Utility gas
- 26.7%Electricity
- 2.2%Fuel oil, kerosene, etc.
- 0.5%Other fuel
- 0.2%Bottled, tank, or LP gas
- 0.2%Solar energy
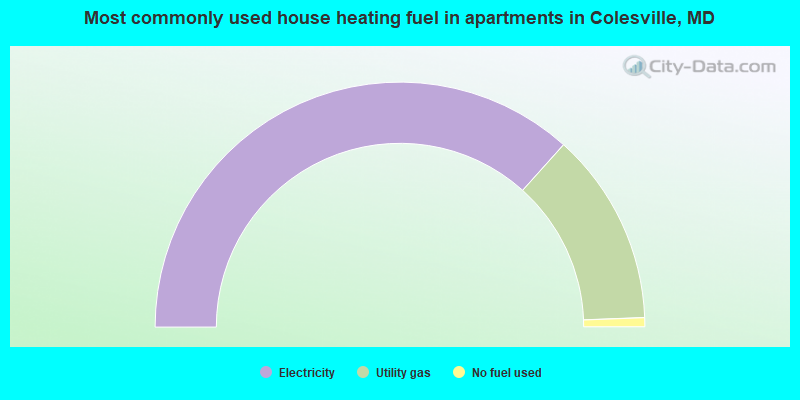
- 73.3%Electricity
- 25.5%Utility gas
- 1.2%No fuel used
Private vs. public school enrollment:
| Here: | 15.8% |
| Maryland: | 15.2% |
| Here: | 17.9% |
| Maryland: | 14.4% |
| Here: | 26.6% |
| Maryland: | 20.2% |


