Housing density: 182 houses/condos per square mile
Median price asked for vacant for-sale houses and condos in 2022 in this county: $706,355.
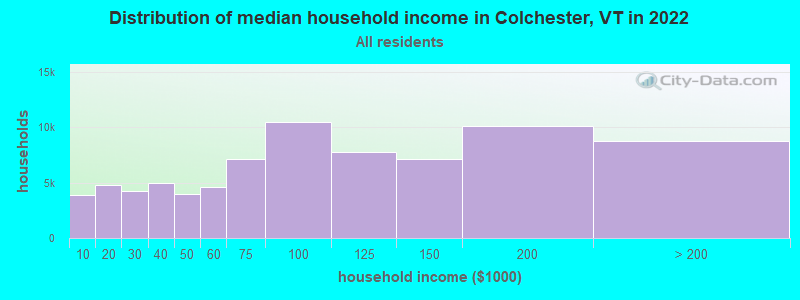
Median contract rent in 2022: $1,414 (lower quartile is $1,106, upper quartile is $1,753)
Median gross rent in Colchester, VT in 2022: $1,555
Housing units in Colchester with a mortgage: 2,607 (137 second mortgage, 486 home equity loan, 11 both second mortgage and home equity loan) Houses without a mortgage: 535
In family households: 109,943 (24,793 male householders, 11,789 female householders)
28,660 spouses, 37,454 children (34,847 natural, 1,395 adopted, 1,212 stepchildren), 1,289 grandchildren, 800 brothers or sisters, 735 parents, foster children, 675 other relatives, 3,212 non-relatives
In nonfamily households: 36,807 (11,423 male householders (7,248 living alone)), 13,822 female householders (9,861 living alone)), 11,562 nonrelatives
In group quarters: 9,795 (1,163 institutionalized population)
25,754 married couples with children.
6,932 single-parent households (1,683 men, 5,249 women).
92.6% of residents of Colchester speak English at home.
1.6% of residents speak Spanish at home (71% speak English very well, 29% speak English well).
4.0% of residents speak other Indo-European language at home (78% speak English very well, 10% speak English well, 11% speak English not well, 2% don't speak English at all).
1.4% of residents speak Asian or Pacific Island language at home (57% speak English very well, 43% speak English well).
0.4% of residents speak other language at home (87% speak English very well, 13% speak English well).
Foreign born population: 1,121 (5.7%)
(68.0% of them are naturalized citizens)
Year of entry for the foreign-born population in Colchester, Vermont
2671995 to March 2000
741990 to 1994
851985 to 1989
801980 to 1984
631975 to 1979
351970 to 1974
441965 to 1969
106Before 1965
First ancestries reported:
Irish: 3,362 (17.0%)
French: 2,745 (13.9%)
French Canadian: 2,700 (13.7%)
English: 2,364 (12.0%)
Other: 1,986 (10.1%)
German: 1,462 (7.4%)
Italian: 1,310 (6.6%)
United States: 991 (5.0%)
Scottish: 690 (3.5%)
Polish: 576 (2.9%)
Scotch-Irish: 295 (1.5%)
Dutch: 201 (1.0%)
Swedish: 156 (0.8%)
Arab: 143 (0.7%)
Norwegian: 136 (0.7%)
Greek: 100 (0.5%)
Russian: 88 (0.4%)
Welsh: 84 (0.4%)
Danish: 83 (0.4%)
Czech: 68 (0.3%)
Portuguese: 49 (0.2%)
Slovak: 43 (0.2%)
Subsaharan African: 36 (0.2%)
Lithuanian: 32 (0.2%)
Ukrainian: 28 (0.1%)
Hungarian: 18 (0.09%)
Swiss: 7 (0.04%)
Most common places of birth for foreign-born residents (%):
Canada
Colchester:
25.1% (189)
Vermont:
34.0% (7,912)
China, excluding Hong Kong and Taiwan
Colchester:
10.9% (82)
Vermont:
2.9% (673)
Germany
Colchester:
7.6% (57)
Vermont:
7.2% (1,669)
Korea
Colchester:
6.6% (50)
Vermont:
2.5% (588)
United Kingdom
Colchester:
5.0% (38)
Vermont:
7.5% (1,744)
Other Western Europe
Colchester:
4.4% (33)
Vermont:
1.2% (273)
Yugoslavia
Colchester:
4.1% (31)
Vermont:
0.6% (145)
Colombia
Colchester:
4.0% (30)
Vermont:
0.5% (108)
Ghana
Colchester:
3.6% (27)
Vermont:
0.2% (46)
Bosnia and Herzegovina
Colchester:
3.4% (26)
Vermont:
6.1% (1,412)
Cambodia
Colchester:
2.7% (20)
Vermont:
0.3% (65)
Italy
Colchester:
2.4% (18)
Vermont:
1.4% (322)
Japan
Colchester:
2.4% (18)
Vermont:
1.4% (335)
India
Colchester:
2.4% (18)
Vermont:
2.5% (585)
Ecuador
Colchester:
2.4% (18)
Vermont:
0.4% (90)
Other Northern Europe
Colchester:
1.9% (14)
Vermont:
1.2% (268)
Brazil
Colchester:
1.9% (14)
Vermont:
0.5% (115)
Place of birth for U.S.-born residents:
This state: 9,537
Other state: 6,573
Northeast: 4,750
Midwest: 633
South: 804
West: 386
51% of Colchester residents lived in the same house 5 years ago. Out of people who lived in different houses, 53% lived in this county. Out of people who lived in different counties, 30% lived in Vermont.
Education attainment for males 25 years and older:
No schooling: 0
Nursery to 4th grade: 0
5th and 6th grade: 18
7th and 8th grade: 174
9th grade: 66
10th grade: 37
11th grade: 56
12th grade, no diploma: 102
High school graduate (or equivalency): 1,501
Less than 1 year of college: 339
Some college more than 1 year, no degree: 615
Associate degree: 510
Bachelor's degree: 1,169
Master's degree: 417
Professional school degree: 42
Doctorate degree: 85
Education attainment for females 25 years and older: