Coeur d'Alene, ID (Idaho) Houses and Residents
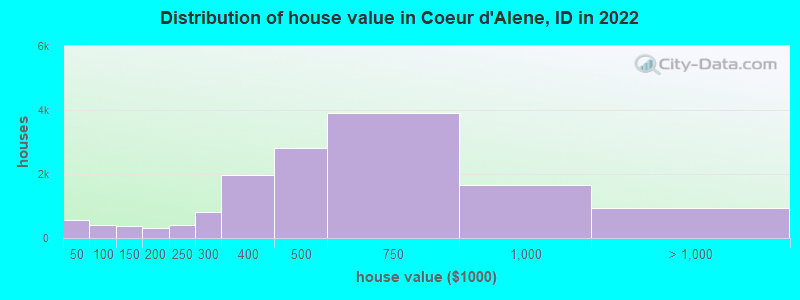
Estimated median house or condo value in 2022: $517,785 (it was $105,300 in 2000 )
Coeur d'Alene:
$517,785Idaho:
$432,500
Lower value quartile - upper value quartile: $409,195 - $669,900Mean price in 2022: Detached houses: $611,690 Here:
$611,690State:
$527,539
Townhouses or other attached units: $541,916 Here:
$541,916State:
$416,749
In 2-unit structures: $313,450 Here:
$313,450State:
$523,641
In 3-to-4-unit structures: $402,947 Here:
$402,947State:
$384,926
In 5-or-more-unit structures: $777,979 Here:
$777,979State:
$590,418
Mobile homes: $131,732 Here:
$131,732State:
$150,232
Occupied boats, RVs, vans, etc.: $120,336 Here:
$120,336State:
$136,871
Total population: 47,912 (Urban population: 34,651, Rural population: 134 (all nonfarm) )
Houses: 26,002 (24,197 occupied: 13,848 owner occupied, 10,309 renter occupied )
% of renters here:
43%State:
28%
Housing density: 1,981 houses/condos per square mile
Median price asked for vacant for-sale houses and condos in 2022: $528,394.
Median contract rent in 2022: $1,293 (lower quartile is $864, upper quartile is $1,769)
Median rent asked for vacant for-rent units in 2022: $2,475
Median gross rent in Coeur d'Alene, ID in 2022: $1,468
Housing units in Coeur d'Alene with a mortgage: 8,449 (808 second mortgage, 46 home equity loan, 725 both second mortgage and home equity loan )Houses without a mortgage: 202
Median household income for houses/condos with a mortgage: $100,357
Median household income for apartments without a mortgage: $60,105
Median monthly housing costs: $1,300
Data:
Median house or condo value ($)
Median house or condo value ($ change since 2000)
Median house or condo value ($) - White
Median house or condo value ($) - Black or African American
Median house or condo value ($) - Asian
Median house or condo value ($) - Hispanic or Latino
Median house or condo value ($) - American Indian and Alaska Native
Median house or condo value ($) - Multirace
Median house or condo value ($) - Other Race
Median price asked for mobile homes ($)
Household density (households per square mile)
Mean house or condo value by units in structure - 1, detached ($)
Mean house or condo value by units in structure - 1, attached ($)
Mean house or condo value by units in structure - 2 ($)
Mean house or condo value by units in structure by units in structure - 3 or 4 ($)
Mean house or condo value by units in structure - 5 or more ($)
Mean house or condo value by units in structure - Boat, RV, van, etc. ($)
Mean house or condo value by units in structure - Mobile home ($)
Median contract rent ($)
Median contract rent - Lower quartile ($)
Median contract rent - Upper quartile ($)
Median gross rent ($)
Urban houses (%)
Rural houses (%)
Houses occupied (%)
Houses occupied (% change since 2000)
Houses owner occupied (%)
Houses owner occupied (% change since 2000)
Houses renter occupied (%)
Houses renter occupied (% change since 2000)
Vacant housing units - For rent (%)
Vacant housing units - For rent (% change since 2000)
Vacant housing units - For sale only (%)
Vacant housing units - For sale only (% change since 2000)
Vacant housing units - Rented or sold, not occupied (%)
Vacant housing units - Rented or sold, not occupied (% change since 2000)
Vacant housing units - For seasonal, recreational, or occasional use (%)
Vacant housing units - For seasonal, recreational, or occasional use (% change since 2000)
Vacant housing units - For migrant workers (%)
Vacant housing units - For migrant workers (% change since 2000)
Vacant housing units - Other vacant (%)
Vacant housing units - Other vacant (% change since 2000)
Median monthly housing costs ($)
Median household income for houses/condos with a mortgage ($)
Median household income for houses/condos without a mortgage ($)
Median household income ($)
Median household income ($) - White
Median household income ($) - Black or African American
Median household income ($) - Asian
Median household income ($) - Hispanic or Latino
Median household income ($) - American Indian and Alaska Native
Median household income ($) - Multirace
Median household income ($) - Other Race
Mortgage status - with mortgage (%)
Mortgage status - with second mortgage (%)
Mortgage status - with home equity loan (%)
Mortgage status - with both second mortgage and home equity loan (%)
Mortgage status - without a mortgage (%)
Median year house/condo built
Median year apartment built
Household type by relationship - Male householder living alone (%)
Household type by relationship - Male householder not living alone (%)
Household type by relationship - Female householder living alone (%)
Household type by relationship - Female householder not living alone (%)
Household type by relationship - Opposite-Sex spouse (%)
Household type by relationship - Same-Sex spouse (%)
Household type by relationship - Opposite-Sex unmarried partner (%)
Household type by relationship - Same-Sex unmarried partner (%)
Household type by relationship - In group quarters (%)
Size of family households - 2-person household (%)
Size of family households - 3-person household (%)
Size of family households - 4-person household (%)
Size of family households - 5-person household (%)
Size of family households - 6-person household (%)
Size of family households - 7-or-more-person household (%)
Size of nonfamily households - 1-person household (%)
Size of nonfamily households - 2-person household (%)
Size of nonfamily households - 3-person household (%)
Size of nonfamily households - 4-person household (%)
Size of nonfamily households - 5-person household (%)
Size of nonfamily households - 6-person household (%)
Size of nonfamily households - 7-or-moreperson household (%)
Year house built - Built 2010 or later (%)
Year house built - Built 2000 to 2009 (%)
Year house built - Built 1990 to 1999 (%)
Year house built - Built 1980 to 1989 (%)
Year house built - Built 1970 to 1979 (%)
Year house built - Built 1960 to 1969 (%)
Year house built - Built 1950 to 1959 (%)
Year house built - Built 1940 to 1949 (%)
Year house built - Built 1939 or earlier (%)
Median number of rooms in houses and condos
Median number of rooms in apartments
Median number of bedrooms in owner occupied houses
Mean number of bedrooms in owner occupied houses
Median number of bedrooms in renter occupied houses
Mean number of bedrooms in renter occupied houses
Median number of vehichles in owner occupied houses
Mean number of vehichles in owner occupied houses
Median number of vehichles in renter occupied houses
Mean number of vehichles in renter occupied houses
Rooms in owner-occupied houses - 1 room (%)
Rooms in owner-occupied houses - 2 rooms (%)
Rooms in owner-occupied houses - 3 rooms (%)
Rooms in owner-occupied houses - 4 rooms (%)
Rooms in owner-occupied houses - 5 rooms (%)
Rooms in owner-occupied houses - 6 rooms (%)
Rooms in owner-occupied houses - 7 rooms (%)
Rooms in owner-occupied houses - 8 rooms (%)
Rooms in owner-occupied houses - 9+ rooms (%)
Rooms in renter-occupied houses - 1 room (%)
Rooms in renter-occupied houses - 2 rooms (%)
Rooms in renter-occupied houses - 3 rooms (%)
Rooms in renter-occupied houses - 4 rooms (%)
Rooms in renter-occupied houses - 5 rooms (%)
Rooms in renter-occupied houses - 6 rooms (%)
Rooms in renter-occupied houses - 7 rooms (%)
Rooms in renter-occupied houses - 8 rooms (%)
Rooms in renter-occupied houses - 9+ rooms (%)
Bedrooms in owner-occupied houses - no bedrooms (%)
Bedrooms in owner-occupied houses - 1 bedroom (%)
Bedrooms in owner-occupied houses - 2 bedrooms (%)
Bedrooms in owner-occupied houses - 3 bedrooms (%)
Bedrooms in owner-occupied houses - 4 bedrooms (%)
Bedrooms in owner-occupied houses - 5+ bedrooms (%)
Bedrooms in renter-occupied houses - no bedrooms (%)
Bedrooms in renter-occupied houses - 1 bedroom (%)
Bedrooms in renter-occupied houses - 2 bedrooms (%)
Bedrooms in renter-occupied houses - 3 bedrooms (%)
Bedrooms in renter-occupied houses - 4 bedrooms (%)
Bedrooms in renter-occupied houses - 5+ bedrooms (%)
Vehicles available in owner-occupied houses - no vehicle available (%)
Vehicles available in owner-occupied houses - 1 vehicle available(%)
Vehicles available in owner-occupied houses - 2 Vehicles available (%)
Vehicles available in owner-occupied houses - 3 Vehicles available (%)
Vehicles available in owner-occupied houses - 4 Vehicles available (%)
Vehicles available in owner-occupied houses - 5+ Vehicles available (%)
Vehicles available in renter-occupied houses - no vehicle available (%)
Vehicles available in renter-occupied houses - 1 vehicle available (%)
Vehicles available in renter-occupied houses - 2 Vehicles available (%)
Vehicles available in renter-occupied houses - 3 Vehicles available (%)
Vehicles available in renter-occupied houses - 4 Vehicles available (%)
Vehicles available in renter-occupied houses - 5+ Vehicles available (%)
Housing units in structures - 1, detached (%)
Housing units in structures - 1, attached (%)
Housing units in structures - 2 (%)
Housing units in structures - 3 or 4 (%)
Housing units in structures - 5 to 9 (%)
Housing units in structures - 10 to 19 (%)
Housing units in structures - 20 to 49 (%)
Housing units in structures - 50 or more (%)
Housing units in structures - Mobile home (%)
Housing units in structures - Boat, RV, van, etc. (%)
Housing units in structures - Owners - 1, detached (%)
Housing units in structures - Owners - 1, attached (%)
Housing units in structures - Owners - 2 (%)
Housing units in structures - Owners - 3 or 4 (%)
Housing units in structures - Owners - 5 to 9 (%)
Housing units in structures - Owners - 10 to 19 (%)
Housing units in structures - Owners - 20 to 49 (%)
Housing units in structures - Owners - 50 or more (%)
Housing units in structures - Owners - Mobile home (%)
Housing units in structures - Owners - Boat, RV, van, etc. (%)
Housing units in structures - Renters - 1, detached (%)
Housing units in structures - Renters - 1, attached (%)
Housing units in structures - Renters - 2 (%)
Housing units in structures - Renters - 3 or 4 (%)
Housing units in structures - Renters - 5 to 9 (%)
Housing units in structures - Renters - 10 to 19 (%)
Housing units in structures - Renters - 20 to 49 (%)
Housing units in structures - Renters - 50 or more (%)
Housing units in structures - Renters - Mobile home (%)
Housing units in structures - Renters - Boat, RV, van, etc. (%)
House/condo owner moved in on average (years ago)
Renter moved in on average (years ago)
Year householder moved into unit - Moved in 1999 to March 2000 (%)
Year householder moved into unit - Moved in 1999 to March 2000 (%) - White
Year householder moved into unit - Moved in 1999 to March 2000 (%) - Black or African American
Year householder moved into unit - Moved in 1999 to March 2000 (%) - Asian
Year householder moved into unit - Moved in 1999 to March 2000 (%) - Hispanic or Latino
Year householder moved into unit - Moved in 1999 to March 2000 (%) - American Indian and Alaska Native
Year householder moved into unit - Moved in 1999 to March 2000 (%) - Multirace
Year householder moved into unit - Moved in 1999 to March 2000 (%) - Other Race
Year householder moved into unit - Moved in 1995 to 1998 (%)
Year householder moved into unit - Moved in 1995 to 1998 (%) - White
Year householder moved into unit - Moved in 1995 to 1998 (%) - Black or African American
Year householder moved into unit - Moved in 1995 to 1998 (%) - Asian
Year householder moved into unit - Moved in 1995 to 1998 (%) - Hispanic or Latino
Year householder moved into unit - Moved in 1995 to 1998 (%) - American Indian and Alaska Native
Year householder moved into unit - Moved in 1995 to 1998 (%) - Multirace
Year householder moved into unit - Moved in 1995 to 1998 (%) - Other Race
Year householder moved into unit - Moved in 1990 to 1994 (%)
Year householder moved into unit - Moved in 1990 to 1994 (%) - White
Year householder moved into unit - Moved in 1990 to 1994 (%) - Black or African American
Year householder moved into unit - Moved in 1990 to 1994 (%) - Asian
Year householder moved into unit - Moved in 1990 to 1994 (%) - Hispanic or Latino
Year householder moved into unit - Moved in 1990 to 1994 (%) - American Indian and Alaska Native
Year householder moved into unit - Moved in 1990 to 1994 (%) - Multirace
Year householder moved into unit - Moved in 1990 to 1994 (%) - Other Race
Year householder moved into unit - Moved in 1980 to 1989 (%)
Year householder moved into unit - Moved in 1980 to 1989 (%) - White
Year householder moved into unit - Moved in 1980 to 1989 (%) - Black or African American
Year householder moved into unit - Moved in 1980 to 1989 (%) - Asian
Year householder moved into unit - Moved in 1980 to 1989 (%) - Hispanic or Latino
Year householder moved into unit - Moved in 1980 to 1989 (%) - American Indian and Alaska Native
Year householder moved into unit - Moved in 1980 to 1989 (%) - Multirace
Year householder moved into unit - Moved in 1980 to 1989 (%) - Other Race
Year householder moved into unit - Moved in 1970 to 1979 (%)
Year householder moved into unit - Moved in 1970 to 1979 (%) - White
Year householder moved into unit - Moved in 1970 to 1979 (%) - Black or African American
Year householder moved into unit - Moved in 1970 to 1979 (%) - Asian
Year householder moved into unit - Moved in 1970 to 1979 (%) - Hispanic or Latino
Year householder moved into unit - Moved in 1970 to 1979 (%) - American Indian and Alaska Native
Year householder moved into unit - Moved in 1970 to 1979 (%) - Multirace
Year householder moved into unit - Moved in 1970 to 1979 (%) - Other Race
Year householder moved into unit - Moved in 1969 or earlier (%)
Year householder moved into unit - Moved in 1969 or earlier (%) - White
Year householder moved into unit - Moved in 1969 or earlier (%) - Black or African American
Year householder moved into unit - Moved in 1969 or earlier (%) - Asian
Year householder moved into unit - Moved in 1969 or earlier (%) - Hispanic or Latino
Year householder moved into unit - Moved in 1969 or earlier (%) - American Indian and Alaska Native
Year householder moved into unit - Moved in 1969 or earlier (%) - Multirace
Year householder moved into unit - Moved in 1969 or earlier (%) - Other Race
Housing units lacking complete plumbing facilities (%)
Housing units lacking complete kitchen facilities (%)
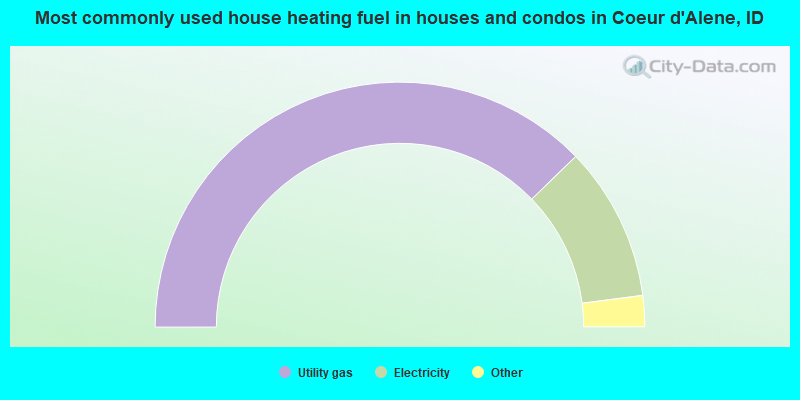
House heating fuel used in houses and condos - Utility gas (%)
House heating fuel used in houses and condos - Bottled, tank, or LP gas (%)
House heating fuel used in houses and condos - Electricity (%)
House heating fuel used in houses and condos - Fuel oil, kerosene, etc. (%)
House heating fuel used in houses and condos - Coal or coke (%)
House heating fuel used in houses and condos - Wood (%)
House heating fuel used in houses and condos - Solar energy (%)
House heating fuel used in houses and condos - Other fuel (%)
House heating fuel used in houses and condos - No fuel used (%)
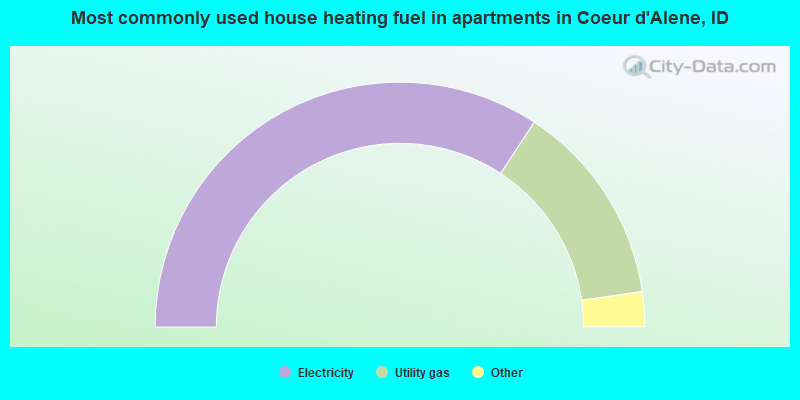
House heating fuel used in apartments - Utility gas (%)
House heating fuel used in apartments - Bottled, tank, or LP gas (%)
House heating fuel used in apartments - Electricity (%)
House heating fuel used in apartments - Fuel oil, kerosene, etc. (%)
House heating fuel used in apartments - Coal or coke (%)
House heating fuel used in apartments - Wood (%)
House heating fuel used in apartments - Solar energy (%)
House heating fuel used in apartments - Other fuel (%)
House heating fuel used in apartments - No fuel used (%)
Median year house/condo built: 1996Median year apartment built: 2001Household type by relationship:
Households: 57,805
Male householders: 11,348 (2,763 living alone ), Female householders: 12,683 (4,611 living alone )10,877 spouses (10,824 opposite-sex spouses ), 1,772 unmarried partners , (1,735 opposite-sex unmarried partners ), 14,633 children (12,942 natural , 311 adopted , 1,379 stepchildren ), 750 grandchildren , 326 brothers or sisters , 548 parents , 0 foster children , 758 other relatives , 2,416 non-relatives In group quarters: 1,690
Size of family households: 7,111 2-persons , 2,220 3-persons , 2,335 4-persons , 1,432 5-persons , 447 6-persons , 158 7-or-more-persons .
Size of nonfamily households: 8,058 1-person , 2,185 2-persons , 319 3-persons , 66 4-persons , 17 5-persons .
8,385 married couples with children. single-parent households (775 men , 2,465 women ).
95.3% of residents of Coeur d'Alene speak English at home. of residents speak Spanish at home (63% speak English very well , 31% speak English well , 7% speak English not well ).of residents speak other Indo-European language at home (94% speak English very well , 4% speak English well , 2% speak English not well ).of residents speak Asian or Pacific Island language at home (72% speak English very well , 21% speak English not well , 7% don't speak English at all ).
Foreign born population: 1,644 (2.8%)of them are naturalized citizens )
Median number of rooms in houses and condos:
Median number of rooms in apartments
Owner-occupied Renter-occupied
Rooms in owner-occupied houses in Coeur d'Alene, Idaho
22 1 room 47 2 rooms 213 3 rooms 1,254 4 rooms 3,291 5 rooms 2,726 6 rooms 1,944 7 rooms 1,561 8 rooms 2,791 9+ rooms
Rooms in renter-occupied apartments in Coeur d'Alene, Idaho
415 1 room 1,043 2 rooms 2,496 3 rooms 2,234 4 rooms 1,669 5 rooms 989 6 rooms 736 7 rooms 386 8 rooms 342 9+ rooms
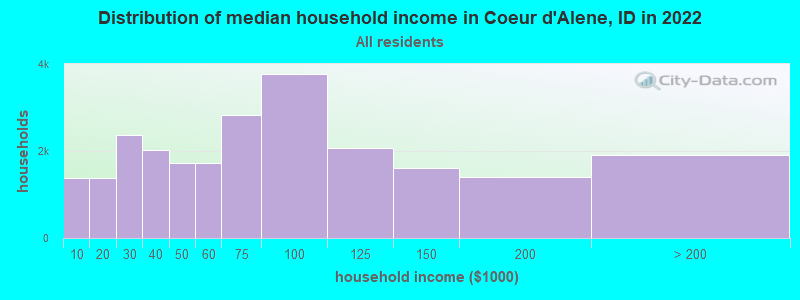
Coeur d'Alene, ID household income distribution 1,386 Less than $10,0001,375 $10,000 to $19,9992,361 $20,000 to $29,9992,020 $30,000 to $39,9991,719 $40,000 to $49,9991,718 $50,000 to $59,9992,835 $60,000 to $74,9993,774 $75,000 to $99,9992,059 $100,000 to $124,9991,608 $125,000 to $149,9991,396 $150,000 to $199,9991,900 $200,000 or more
Home value of owner - occupied houses in 2022 in Coeur d'Alene, ID 177 Less than $10,00060 $10,000 to $14,99947 $15,000 to $19,99939 $25,000 to $29,99993 $30,000 to $34,999147 $40,000 to $49,99998 $50,000 to $59,99938 $70,000 to $79,99966 $80,000 to $89,99949 $90,000 to $99,99919 $100,000 to $124,999346 $125,000 to $149,99971 $150,000 to $174,999247 $175,000 to $199,999413 $200,000 to $249,999817 $250,000 to $299,9991,977 $300,000 to $399,9992,797 $400,000 to $499,9993,907 $500,000 to $749,9991,645 $750,000 to $999,999568 $1,000,000 to $1,499,999166 $1,500,000 to $1,999,999190 $2,000,000 or moreRent paid by renters in 2022 in Coeur d'Alene, ID 15 $100 to $14958 $150 to $199155 $200 to $24964 $250 to $299170 $300 to $349192 $350 to $39977 $400 to $44949 $450 to $49972 $500 to $549200 $550 to $599135 $600 to $649161 $650 to $699313 $700 to $749516 $750 to $799787 $800 to $899787 $900 to $9991,492 $1,000 to $1,2491,680 $1,250 to $1,4992,291 $1,500 to $1,999705 $2,000 to $2,499254 $2,500 to $2,99933 $3,000 to $3,49973 $3,500 or more393 No cash rent
Percentage of workers working in this county: 82.9%Number of people working at home: 3,538 (12.5% of all workers )
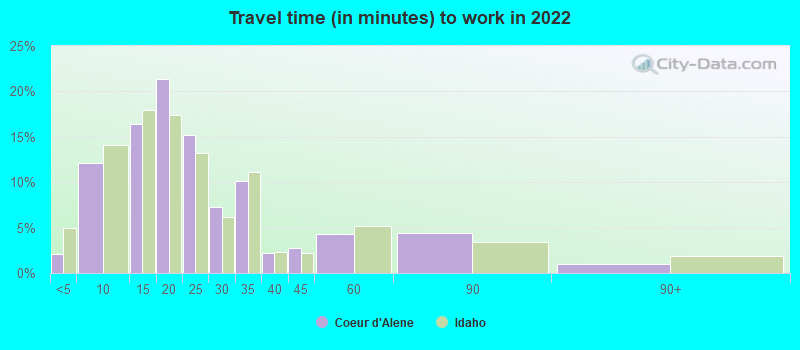
Travel time to work (commute)
Less than 5 minutes: 5145 to 9 minutes: 3,97510 to 14 minutes: 5,76015 to 19 minutes: 5,09420 to 24 minutes: 2,43625 to 29 minutes: 49630 to 34 minutes: 2,05335 to 39 minutes: 82540 to 44 minutes: 62745 to 59 minutes: 1,08460 to 89 minutes: 54190 or more minutes: 369
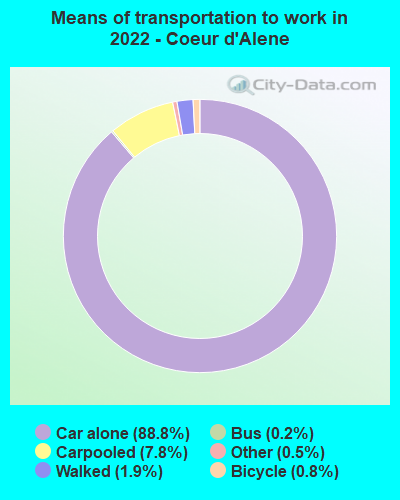
Means of transportation to work:
Drove a car alone: 27,824 (77.0%)Carpooled: 2,420 (6.7%)Bus : 50 (0.1%)Taxi: 409 (1.1%)Bicycle: 352 (1.0%)Walked: 555 (1.5%)Worked at home: 3,538 (9.8%)
Unemployment by race in 2022
Unemployment rate for White non-Hispanic residents 1.6% Males2.2% FemalesUnemployment rate for Asian residents 20.6% MalesUnemployment rate for other race residents 0.7% Males4.7% FemalesUnemployment rate for two or more race residents 1.0% FemalesUnemployment rate for Hispanic or Latino residents 0.4% Males4.1% Females
Year of entry for the foreign-born population in Coeur d'Alene, Idaho
265 2010 or later 646 2000 to 2009 392 1990 to 1999 143 1980 to 1989 134 1970 to 1979 400 Before 1970
First ancestries reported:
English: 3,511 (16.9%)
German: 3,116 (15.0%)
Irish: 1,769 (8.5%)
American: 1,601 (7.7%)
European: 1,111 (5.4%)
Norwegian: 739 (3.6%)
Italian: 551 (2.7%)
Scottish: 434 (2.1%)
Dutch: 314 (1.5%)
Swedish: 257 (1.2%)
Scotch-Irish: 253 (1.2%)
Polish: 249 (1.2%)
Scandinavian: 242 (1.2%)
French: 189 (0.9%)
Canadian: 150 (0.7%)
British: 136 (0.7%)
Iranian: 124 (0.6%)
Hungarian: 103 (0.5%)
Northern European: 84 (0.4%)
Finnish: 81 (0.4%)
Russian: 76 (0.4%)
South African: 58 (0.3%)
Luxembourger: 56 (0.3%)
Danish: 50 (0.2%)
French Canadian: 45 (0.2%)
Basque: 32 (0.2%)
Portuguese: 30 (0.1%)
Romanian: 26 (0.1%)
Czechoslovakian: 24 (0.1%)
Belgian: 23 (0.1%)
Eastern European: 21 (0.1%)
Celtic: 19 (0.09%)
Macedonian: 16 (0.08%)
Czech: 10 (0.05%)
Swiss: 10 (0.05%)
Assyrian: 8 (0.04%)
Slovene: 8 (0.04%)
West Indian: 8 (0.04%)
Turkish: 8 (0.04%)
Slovak: 7 (0.03%)
Welsh: 5 (0.02%)
African: 5 (0.02%) Most common places of birth for foreign-born residents (%): Mexico Coeur d'Alene:
26.9% (455)Idaho:
49.9% (53,107)
Canada Coeur d'Alene:
13.7% (232)Idaho:
5.2% (5,503)
Philippines Coeur d'Alene:
11.8% (199)Idaho:
2.1% (2,230)
El Salvador Coeur d'Alene:
8.8% (148)Idaho:
0.8% (861)
England Coeur d'Alene:
5.6% (94)Idaho:
1.5% (1,595)
China, excluding Hong Kong and Taiwan Coeur d'Alene:
4.8% (81)Idaho:
2.1% (2,219)
Thailand Coeur d'Alene:
3.9% (66)Idaho:
0.6% (679)
Germany Coeur d'Alene:
3.6% (61)Idaho:
2.4% (2,535)
South Africa Coeur d'Alene:
2.7% (46)Idaho:
0.3% (314)
United Kingdom, excluding England and Scotland Coeur d'Alene:
2.5% (42)Idaho:
0.7% (771)
Korea Coeur d'Alene:
2.4% (41)Idaho:
1.7% (1,802)
Romania Coeur d'Alene:
2.0% (34)Idaho:
0.5% (520)
Guyana Coeur d'Alene:
1.7% (29)Idaho:
0.0% (32)
Place of birth for U.S.-born residents:
This state: 17,144Other state: 38,575Northeast: 1,893Midwest: 4,542South: 2,642West: 29,268 83.2% of Coeur d'Alene residents lived in the same house 1 years ago.
Out of people who lived in different houses, 30.5% lived in this county.
Out of people who lived in different counties, 15.7% lived in Idaho.
Coeur d'Alene:
83.2%State average:
85.1%
Education attainment for males 25 years and older:
No schooling: 287Nursery to 4th grade: 345th and 6th grade: 197th and 8th grade: 559th grade: 9710th grade: 7611th grade: 35712th grade, no diploma: 286High school graduate (or equivalency): 5,477Less than 1 year of college: 1,483Some college more than 1 year, no degree: 3,440Associate degree: 3,100Bachelor's degree: 4,067Master's degree: 1,053Professional school degree: 285Doctorate degree: 248
Education attainment for females 25 years and older:
No schooling: 403Nursery to 4th grade: 125th and 6th grade: 307th and 8th grade: 369th grade: 6610th grade: 34511th grade: 8712th grade, no diploma: 488High school graduate (or equivalency): 5,094Less than 1 year of college: 1,197Some college more than 1 year, no degree: 3,975Associate degree: 2,839Bachelor's degree: 3,896Master's degree: 1,686Professional school degree: 509Doctorate degree: 658
Housing units in structures:
One, detached: 16,123One, attached: 1,088Two: 1,0833 or 4: 1,5105 to 9: 1,58510 to 19: 1,14220 to 49: 96150 or more: 1,309Mobile homes: 1,099Boats, RVs, vans, etc.: 99Median worth of mobile homes: $200,264
Housing units lacking complete plumbing facilities in 2022: 0.2%Housing units lacking complete kitchen facilities in 2022: 1.5%House/condo owner moved in on average 8 years ago
Renter moved in on average 3 years ago
Private vs. public school enrollment:
Students in private schools in grades 1 to 8 (elementary and middle school): 1,563 Students in private schools in grades 9 to 12 (high school): 213 Students in private undergraduate colleges: 84