Clifton, NJ (New Jersey) Houses and Residents
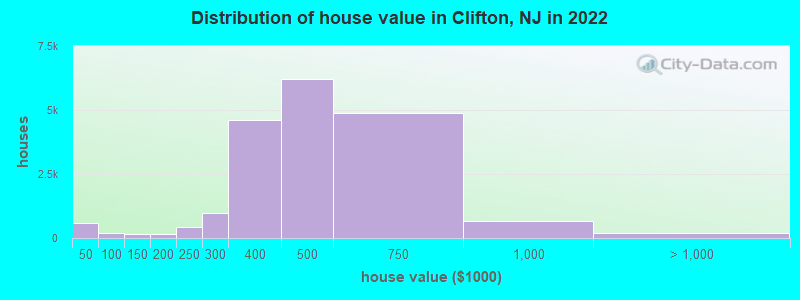
Estimated median house or condo value in 2022: $442,700 (it was $183,600 in 2000 )
Clifton:
$442,700New Jersey:
$428,900
Lower value quartile - upper value quartile: $352,400 - $564,900Mean price in 2022: Detached houses: $464,105 Here:
$464,105State:
$537,591
Townhouses or other attached units: $361,857 Here:
$361,857State:
$381,113
In 2-unit structures: $509,127 Here:
$509,127State:
$444,476
In 3-to-4-unit structures: $293,802 Here:
$293,802State:
$457,463
In 5-or-more-unit structures: $335,706 Here:
$335,706State:
$368,745
Mobile homes: $172,618 Here:
$172,618State:
$119,788
Total population: 85,927 (Urban population: 78,672, Rural population: 0)
Houses: 35,192 (34,615 occupied: 22,123 owner occupied, 12,492 renter occupied )
% of renters here:
36%State:
35%
Housing density: 3,116 houses/condos per square mile
Median price asked for vacant for-sale houses and condos in 2022: $355,396.
Median contract rent in 2022: $1,368 (lower quartile is $1,066, upper quartile is $1,736)
Median rent asked for vacant for-rent units in 2022: $2,331
Median gross rent in Clifton, NJ in 2022: $1,490
Housing units in Clifton with a mortgage: 13,867 (732 second mortgage, 0 home equity loan, 675 both second mortgage and home equity loan )Houses without a mortgage: 797
Median household income for houses/condos with a mortgage: $127,005
Median household income for apartments without a mortgage: $96,763
Median monthly housing costs: $1,684
Data:
Median house or condo value ($)
Median house or condo value ($ change since 2000)
Median house or condo value ($) - White
Median house or condo value ($) - Black or African American
Median house or condo value ($) - Asian
Median house or condo value ($) - Hispanic or Latino
Median house or condo value ($) - American Indian and Alaska Native
Median house or condo value ($) - Multirace
Median house or condo value ($) - Other Race
Median price asked for mobile homes ($)
Household density (households per square mile)
Mean house or condo value by units in structure - 1, detached ($)
Mean house or condo value by units in structure - 1, attached ($)
Mean house or condo value by units in structure - 2 ($)
Mean house or condo value by units in structure by units in structure - 3 or 4 ($)
Mean house or condo value by units in structure - 5 or more ($)
Mean house or condo value by units in structure - Boat, RV, van, etc. ($)
Mean house or condo value by units in structure - Mobile home ($)
Median contract rent ($)
Median contract rent - Lower quartile ($)
Median contract rent - Upper quartile ($)
Median gross rent ($)
Urban houses (%)
Rural houses (%)
Houses occupied (%)
Houses occupied (% change since 2000)
Houses owner occupied (%)
Houses owner occupied (% change since 2000)
Houses renter occupied (%)
Houses renter occupied (% change since 2000)
Vacant housing units - For rent (%)
Vacant housing units - For rent (% change since 2000)
Vacant housing units - For sale only (%)
Vacant housing units - For sale only (% change since 2000)
Vacant housing units - Rented or sold, not occupied (%)
Vacant housing units - Rented or sold, not occupied (% change since 2000)
Vacant housing units - For seasonal, recreational, or occasional use (%)
Vacant housing units - For seasonal, recreational, or occasional use (% change since 2000)
Vacant housing units - For migrant workers (%)
Vacant housing units - For migrant workers (% change since 2000)
Vacant housing units - Other vacant (%)
Vacant housing units - Other vacant (% change since 2000)
Median monthly housing costs ($)
Median household income for houses/condos with a mortgage ($)
Median household income for houses/condos without a mortgage ($)
Median household income ($)
Median household income ($) - White
Median household income ($) - Black or African American
Median household income ($) - Asian
Median household income ($) - Hispanic or Latino
Median household income ($) - American Indian and Alaska Native
Median household income ($) - Multirace
Median household income ($) - Other Race
Mortgage status - with mortgage (%)
Mortgage status - with second mortgage (%)
Mortgage status - with home equity loan (%)
Mortgage status - with both second mortgage and home equity loan (%)
Mortgage status - without a mortgage (%)
Median year house/condo built
Median year apartment built
Household type by relationship - Male householder living alone (%)
Household type by relationship - Male householder not living alone (%)
Household type by relationship - Female householder living alone (%)
Household type by relationship - Female householder not living alone (%)
Household type by relationship - Opposite-Sex spouse (%)
Household type by relationship - Same-Sex spouse (%)
Household type by relationship - Opposite-Sex unmarried partner (%)
Household type by relationship - Same-Sex unmarried partner (%)
Household type by relationship - In group quarters (%)
Size of family households - 2-person household (%)
Size of family households - 3-person household (%)
Size of family households - 4-person household (%)
Size of family households - 5-person household (%)
Size of family households - 6-person household (%)
Size of family households - 7-or-more-person household (%)
Size of nonfamily households - 1-person household (%)
Size of nonfamily households - 2-person household (%)
Size of nonfamily households - 3-person household (%)
Size of nonfamily households - 4-person household (%)
Size of nonfamily households - 5-person household (%)
Size of nonfamily households - 6-person household (%)
Size of nonfamily households - 7-or-moreperson household (%)
Year house built - Built 2010 or later (%)
Year house built - Built 2000 to 2009 (%)
Year house built - Built 1990 to 1999 (%)
Year house built - Built 1980 to 1989 (%)
Year house built - Built 1970 to 1979 (%)
Year house built - Built 1960 to 1969 (%)
Year house built - Built 1950 to 1959 (%)
Year house built - Built 1940 to 1949 (%)
Year house built - Built 1939 or earlier (%)
Median number of rooms in houses and condos
Median number of rooms in apartments
Median number of bedrooms in owner occupied houses
Mean number of bedrooms in owner occupied houses
Median number of bedrooms in renter occupied houses
Mean number of bedrooms in renter occupied houses
Median number of vehichles in owner occupied houses
Mean number of vehichles in owner occupied houses
Median number of vehichles in renter occupied houses
Mean number of vehichles in renter occupied houses
Rooms in owner-occupied houses - 1 room (%)
Rooms in owner-occupied houses - 2 rooms (%)
Rooms in owner-occupied houses - 3 rooms (%)
Rooms in owner-occupied houses - 4 rooms (%)
Rooms in owner-occupied houses - 5 rooms (%)
Rooms in owner-occupied houses - 6 rooms (%)
Rooms in owner-occupied houses - 7 rooms (%)
Rooms in owner-occupied houses - 8 rooms (%)
Rooms in owner-occupied houses - 9+ rooms (%)
Rooms in renter-occupied houses - 1 room (%)
Rooms in renter-occupied houses - 2 rooms (%)
Rooms in renter-occupied houses - 3 rooms (%)
Rooms in renter-occupied houses - 4 rooms (%)
Rooms in renter-occupied houses - 5 rooms (%)
Rooms in renter-occupied houses - 6 rooms (%)
Rooms in renter-occupied houses - 7 rooms (%)
Rooms in renter-occupied houses - 8 rooms (%)
Rooms in renter-occupied houses - 9+ rooms (%)
Bedrooms in owner-occupied houses - no bedrooms (%)
Bedrooms in owner-occupied houses - 1 bedroom (%)
Bedrooms in owner-occupied houses - 2 bedrooms (%)
Bedrooms in owner-occupied houses - 3 bedrooms (%)
Bedrooms in owner-occupied houses - 4 bedrooms (%)
Bedrooms in owner-occupied houses - 5+ bedrooms (%)
Bedrooms in renter-occupied houses - no bedrooms (%)
Bedrooms in renter-occupied houses - 1 bedroom (%)
Bedrooms in renter-occupied houses - 2 bedrooms (%)
Bedrooms in renter-occupied houses - 3 bedrooms (%)
Bedrooms in renter-occupied houses - 4 bedrooms (%)
Bedrooms in renter-occupied houses - 5+ bedrooms (%)
Vehicles available in owner-occupied houses - no vehicle available (%)
Vehicles available in owner-occupied houses - 1 vehicle available(%)
Vehicles available in owner-occupied houses - 2 Vehicles available (%)
Vehicles available in owner-occupied houses - 3 Vehicles available (%)
Vehicles available in owner-occupied houses - 4 Vehicles available (%)
Vehicles available in owner-occupied houses - 5+ Vehicles available (%)
Vehicles available in renter-occupied houses - no vehicle available (%)
Vehicles available in renter-occupied houses - 1 vehicle available (%)
Vehicles available in renter-occupied houses - 2 Vehicles available (%)
Vehicles available in renter-occupied houses - 3 Vehicles available (%)
Vehicles available in renter-occupied houses - 4 Vehicles available (%)
Vehicles available in renter-occupied houses - 5+ Vehicles available (%)
Housing units in structures - 1, detached (%)
Housing units in structures - 1, attached (%)
Housing units in structures - 2 (%)
Housing units in structures - 3 or 4 (%)
Housing units in structures - 5 to 9 (%)
Housing units in structures - 10 to 19 (%)
Housing units in structures - 20 to 49 (%)
Housing units in structures - 50 or more (%)
Housing units in structures - Mobile home (%)
Housing units in structures - Boat, RV, van, etc. (%)
Housing units in structures - Owners - 1, detached (%)
Housing units in structures - Owners - 1, attached (%)
Housing units in structures - Owners - 2 (%)
Housing units in structures - Owners - 3 or 4 (%)
Housing units in structures - Owners - 5 to 9 (%)
Housing units in structures - Owners - 10 to 19 (%)
Housing units in structures - Owners - 20 to 49 (%)
Housing units in structures - Owners - 50 or more (%)
Housing units in structures - Owners - Mobile home (%)
Housing units in structures - Owners - Boat, RV, van, etc. (%)
Housing units in structures - Renters - 1, detached (%)
Housing units in structures - Renters - 1, attached (%)
Housing units in structures - Renters - 2 (%)
Housing units in structures - Renters - 3 or 4 (%)
Housing units in structures - Renters - 5 to 9 (%)
Housing units in structures - Renters - 10 to 19 (%)
Housing units in structures - Renters - 20 to 49 (%)
Housing units in structures - Renters - 50 or more (%)
Housing units in structures - Renters - Mobile home (%)
Housing units in structures - Renters - Boat, RV, van, etc. (%)
House/condo owner moved in on average (years ago)
Renter moved in on average (years ago)
Year householder moved into unit - Moved in 1999 to March 2000 (%)
Year householder moved into unit - Moved in 1999 to March 2000 (%) - White
Year householder moved into unit - Moved in 1999 to March 2000 (%) - Black or African American
Year householder moved into unit - Moved in 1999 to March 2000 (%) - Asian
Year householder moved into unit - Moved in 1999 to March 2000 (%) - Hispanic or Latino
Year householder moved into unit - Moved in 1999 to March 2000 (%) - American Indian and Alaska Native
Year householder moved into unit - Moved in 1999 to March 2000 (%) - Multirace
Year householder moved into unit - Moved in 1999 to March 2000 (%) - Other Race
Year householder moved into unit - Moved in 1995 to 1998 (%)
Year householder moved into unit - Moved in 1995 to 1998 (%) - White
Year householder moved into unit - Moved in 1995 to 1998 (%) - Black or African American
Year householder moved into unit - Moved in 1995 to 1998 (%) - Asian
Year householder moved into unit - Moved in 1995 to 1998 (%) - Hispanic or Latino
Year householder moved into unit - Moved in 1995 to 1998 (%) - American Indian and Alaska Native
Year householder moved into unit - Moved in 1995 to 1998 (%) - Multirace
Year householder moved into unit - Moved in 1995 to 1998 (%) - Other Race
Year householder moved into unit - Moved in 1990 to 1994 (%)
Year householder moved into unit - Moved in 1990 to 1994 (%) - White
Year householder moved into unit - Moved in 1990 to 1994 (%) - Black or African American
Year householder moved into unit - Moved in 1990 to 1994 (%) - Asian
Year householder moved into unit - Moved in 1990 to 1994 (%) - Hispanic or Latino
Year householder moved into unit - Moved in 1990 to 1994 (%) - American Indian and Alaska Native
Year householder moved into unit - Moved in 1990 to 1994 (%) - Multirace
Year householder moved into unit - Moved in 1990 to 1994 (%) - Other Race
Year householder moved into unit - Moved in 1980 to 1989 (%)
Year householder moved into unit - Moved in 1980 to 1989 (%) - White
Year householder moved into unit - Moved in 1980 to 1989 (%) - Black or African American
Year householder moved into unit - Moved in 1980 to 1989 (%) - Asian
Year householder moved into unit - Moved in 1980 to 1989 (%) - Hispanic or Latino
Year householder moved into unit - Moved in 1980 to 1989 (%) - American Indian and Alaska Native
Year householder moved into unit - Moved in 1980 to 1989 (%) - Multirace
Year householder moved into unit - Moved in 1980 to 1989 (%) - Other Race
Year householder moved into unit - Moved in 1970 to 1979 (%)
Year householder moved into unit - Moved in 1970 to 1979 (%) - White
Year householder moved into unit - Moved in 1970 to 1979 (%) - Black or African American
Year householder moved into unit - Moved in 1970 to 1979 (%) - Asian
Year householder moved into unit - Moved in 1970 to 1979 (%) - Hispanic or Latino
Year householder moved into unit - Moved in 1970 to 1979 (%) - American Indian and Alaska Native
Year householder moved into unit - Moved in 1970 to 1979 (%) - Multirace
Year householder moved into unit - Moved in 1970 to 1979 (%) - Other Race
Year householder moved into unit - Moved in 1969 or earlier (%)
Year householder moved into unit - Moved in 1969 or earlier (%) - White
Year householder moved into unit - Moved in 1969 or earlier (%) - Black or African American
Year householder moved into unit - Moved in 1969 or earlier (%) - Asian
Year householder moved into unit - Moved in 1969 or earlier (%) - Hispanic or Latino
Year householder moved into unit - Moved in 1969 or earlier (%) - American Indian and Alaska Native
Year householder moved into unit - Moved in 1969 or earlier (%) - Multirace
Year householder moved into unit - Moved in 1969 or earlier (%) - Other Race
Housing units lacking complete plumbing facilities (%)
Housing units lacking complete kitchen facilities (%)
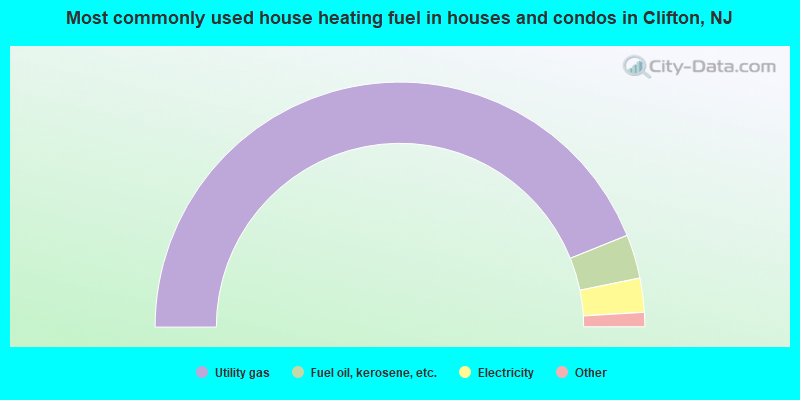
House heating fuel used in houses and condos - Utility gas (%)
House heating fuel used in houses and condos - Bottled, tank, or LP gas (%)
House heating fuel used in houses and condos - Electricity (%)
House heating fuel used in houses and condos - Fuel oil, kerosene, etc. (%)
House heating fuel used in houses and condos - Coal or coke (%)
House heating fuel used in houses and condos - Wood (%)
House heating fuel used in houses and condos - Solar energy (%)
House heating fuel used in houses and condos - Other fuel (%)
House heating fuel used in houses and condos - No fuel used (%)
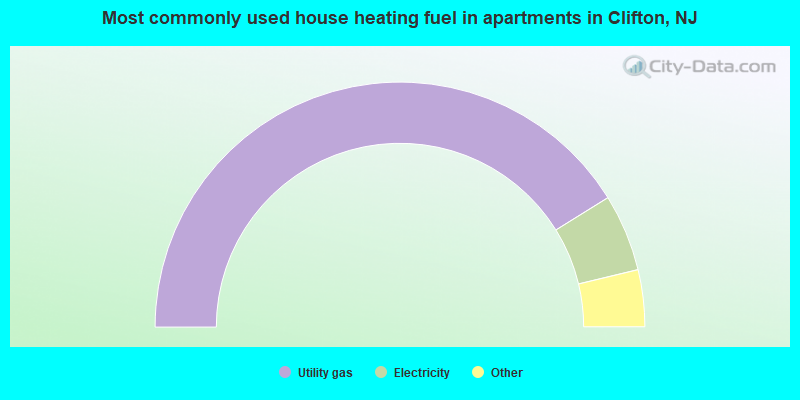
House heating fuel used in apartments - Utility gas (%)
House heating fuel used in apartments - Bottled, tank, or LP gas (%)
House heating fuel used in apartments - Electricity (%)
House heating fuel used in apartments - Fuel oil, kerosene, etc. (%)
House heating fuel used in apartments - Coal or coke (%)
House heating fuel used in apartments - Wood (%)
House heating fuel used in apartments - Solar energy (%)
House heating fuel used in apartments - Other fuel (%)
House heating fuel used in apartments - No fuel used (%)
Latest news about housing in Clifton, NJ collected exclusively by city-data.com from local newspapers, TV, and radio stations
Median year house/condo built: 1952Median year apartment built: 1953Household type by relationship:
Households: 88,722
Male householders: 19,115 (4,620 living alone ), Female householders: 15,500 (5,563 living alone )15,002 spouses (14,952 opposite-sex spouses ), 2,134 unmarried partners , (2,035 opposite-sex unmarried partners ), 25,592 children (24,410 natural , 200 adopted , 982 stepchildren ), 2,528 grandchildren , 1,431 brothers or sisters , 2,681 parents , 0 foster children , 1,939 other relatives , 2,115 non-relatives In group quarters: 685
Size of family households: 9,877 2-persons , 4,145 3-persons , 4,678 4-persons , 2,651 5-persons , 1,235 6-persons , 333 7-or-more-persons .
Size of nonfamily households: 10,183 1-person , 1,361 2-persons , 81 3-persons , 71 4-persons .
11,560 married couples with children. single-parent households (1,009 men , 2,149 women ).
43.9% of residents of Clifton speak English at home. of residents speak Spanish at home (57% speak English very well , 27% speak English well , 9% speak English not well , 7% don't speak English at all ).of residents speak other Indo-European language at home (70% speak English very well , 18% speak English well , 12% speak English not well ).of residents speak Asian or Pacific Island language at home (81% speak English very well , 15% speak English well , 4% speak English not well ).of residents speak other language at home (65% speak English very well , 20% speak English well , 15% speak English not well ).
Foreign born population: 29,337 (33.1%)of them are naturalized citizens )
Median number of rooms in houses and condos:
Median number of rooms in apartments
Owner-occupied Renter-occupied
Rooms in owner-occupied houses in Clifton, New Jersey
0 1 room 52 2 rooms 813 3 rooms 1,810 4 rooms 2,517 5 rooms 5,307 6 rooms 4,936 7 rooms 3,427 8 rooms 3,261 9+ rooms
Rooms in renter-occupied apartments in Clifton, New Jersey
990 1 room 856 2 rooms 2,102 3 rooms 2,561 4 rooms 3,158 5 rooms 1,538 6 rooms 1,043 7 rooms 71 8 rooms 173 9+ rooms
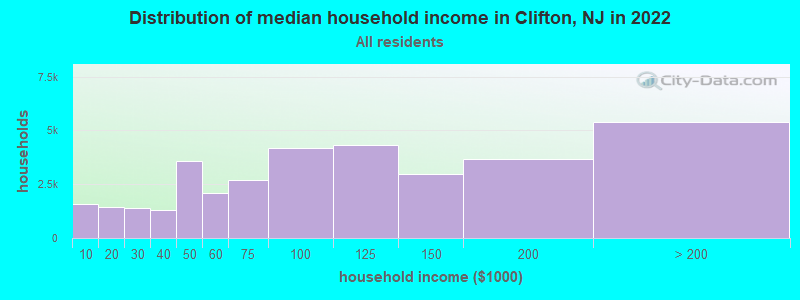
Clifton, NJ household income distribution 1,591 Less than $10,0001,440 $10,000 to $19,9991,402 $20,000 to $29,9991,296 $30,000 to $39,9993,583 $40,000 to $49,9992,069 $50,000 to $59,9992,706 $60,000 to $74,9994,184 $75,000 to $99,9994,304 $100,000 to $124,9992,983 $125,000 to $149,9993,665 $150,000 to $199,9995,392 $200,000 or more
Home value of owner - occupied houses in 2022 in Clifton, NJ 353 Less than $10,00013 $15,000 to $19,99915 $25,000 to $29,999103 $30,000 to $34,99916 $35,000 to $39,99998 $40,000 to $49,99933 $50,000 to $59,99913 $60,000 to $69,99944 $70,000 to $79,99994 $100,000 to $124,99958 $125,000 to $149,99988 $150,000 to $174,99956 $175,000 to $199,999428 $200,000 to $249,999965 $250,000 to $299,9994,620 $300,000 to $399,9996,215 $400,000 to $499,9994,886 $500,000 to $749,999646 $750,000 to $999,99996 $1,000,000 to $1,499,99970 $1,500,000 to $1,999,99939 $2,000,000 or moreRent paid by renters in 2022 in Clifton, NJ 184 Less than $10020 $100 to $149214 $150 to $199117 $200 to $24999 $250 to $29997 $300 to $349122 $450 to $499138 $500 to $54968 $550 to $59929 $600 to $649161 $650 to $69913 $700 to $74939 $750 to $799603 $800 to $899172 $900 to $9991,978 $1,000 to $1,2493,199 $1,250 to $1,4995,170 $1,500 to $1,999749 $2,000 to $2,499189 $2,500 to $2,99925 $3,000 to $3,499307 No cash rent
Percentage of workers working in this county: 49.0%Number of people working at home: 4,920 (10.5% of all workers )
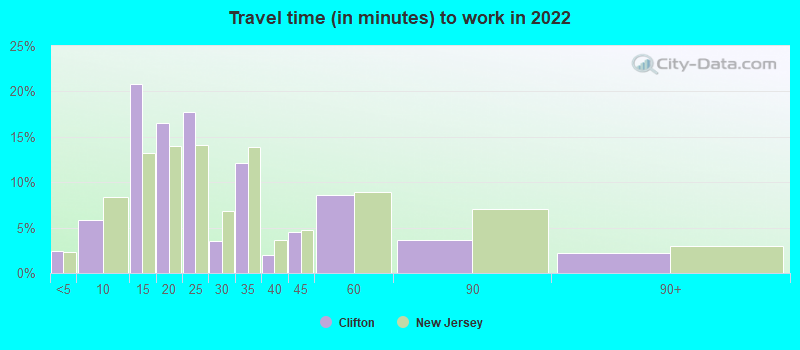
Travel time to work (commute)
Less than 5 minutes: 4195 to 9 minutes: 2,18610 to 14 minutes: 7,96515 to 19 minutes: 4,05420 to 24 minutes: 8,25325 to 29 minutes: 3,41130 to 34 minutes: 4,66535 to 39 minutes: 1,73140 to 44 minutes: 1,68145 to 59 minutes: 2,57960 to 89 minutes: 3,45490 or more minutes: 1,565
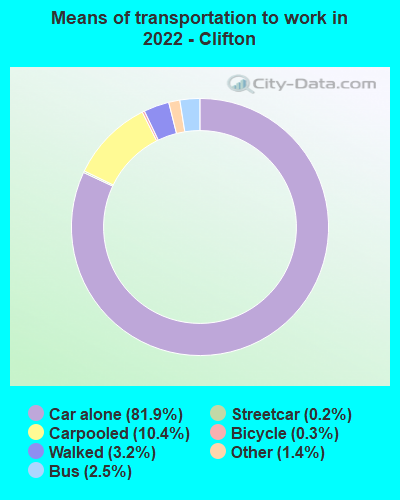
Means of transportation to work:
Drove a car alone: 26,105 (69.0%)Carpooled: 3,492 (9.2%)Bus : 959 (2.5%)Subway or elevated rail : 46 (0.1%)Long-distance train or commuter rail : 29 (0.1%)Light rail, streetcar or trolley : 25 (0.1%)Taxi: 506 (1.3%)Bicycle: 104 (0.3%)Walked: 1,236 (3.3%)Worked at home: 4,920 (13.0%)
Unemployment by race in 2022
Unemployment rate for White non-Hispanic residents 4.8% Males1.9% FemalesUnemployment rate for Black residents 5.9% Males2.7% FemalesUnemployment rate for American Indian and Alaska Native residents 8.4% FemalesUnemployment rate for Asian residents 3.9% Males1.4% FemalesUnemployment rate for other race residents 7.5% Males7.3% FemalesUnemployment rate for two or more race residents 1.2% Males3.8% FemalesUnemployment rate for Hispanic or Latino residents 9.1% Males5.0% Females
Year of entry for the foreign-born population in Clifton, New Jersey
8,216 2010 or later 6,903 2000 to 2009 8,313 1990 to 1999 6,928 1980 to 1989 3,525 1970 to 1979 4,140 Before 1970
First ancestries reported:
Italian: 4,737 (8.1%)
Polish: 4,551 (7.8%)
American: 1,741 (3.0%)
Turkish: 1,325 (2.3%)
Palestinian: 910 (1.6%)
Irish: 906 (1.6%)
Ukrainian: 785 (1.4%)
Egyptian: 685 (1.2%)
Moroccan: 677 (1.2%)
German: 644 (1.1%)
European: 575 (1.0%)
Eastern European: 532 (0.9%)
Albanian: 488 (0.8%)
Syrian: 406 (0.7%)
Jordanian: 403 (0.7%)
Brazilian: 388 (0.7%)
Lebanese: 376 (0.6%)
English: 280 (0.5%)
Hungarian: 239 (0.4%)
Russian: 236 (0.4%)
Yugoslavian: 229 (0.4%)
Arab: 222 (0.4%)
Portuguese: 210 (0.4%)
Greek: 202 (0.3%)
Iraqi: 184 (0.3%)
Jamaican: 181 (0.3%)
Slovak: 166 (0.3%)
Romanian: 142 (0.2%)
Trinidadian and Tobagonian: 139 (0.2%)
Israeli: 115 (0.2%)
French: 113 (0.2%)
Iranian: 100 (0.2%)
Finnish: 97 (0.2%)
Serbian: 91 (0.2%)
African: 91 (0.2%)
Nigerian: 86 (0.1%)
Slavic: 85 (0.1%)
Austrian: 81 (0.1%)
Dutch: 72 (0.1%)
Haitian: 57 (0.10%)
Macedonian: 54 (0.09%)
Scottish: 52 (0.09%)
Lithuanian: 52 (0.09%)
British: 38 (0.07%)
Czech: 33 (0.06%)
Swedish: 33 (0.06%)
Armenian: 28 (0.05%)
Sudanese: 26 (0.04%)
Afghan: 23 (0.04%)
Norwegian: 19 (0.03%)
Scotch-Irish: 17 (0.03%)
Czechoslovakian: 16 (0.03%)
Guyanese: 16 (0.03%)
South African: 15 (0.03%)
Latvian: 14 (0.02%)
French Canadian: 9 (0.02%)
Danish: 7 (0.01%)
West Indian: 6 (0.01%)
Most common places of birth for foreign-born residents (%): Dominican Republic Clifton:
14.1% (4,675)New Jersey:
9.7% (209,055)
Mexico Clifton:
9.1% (2,998)New Jersey:
4.8% (102,527)
Peru Clifton:
8.5% (2,795)New Jersey:
2.7% (58,563)
Poland Clifton:
8.4% (2,785)New Jersey:
2.3% (48,811)
Colombia Clifton:
8.0% (2,630)New Jersey:
4.2% (90,817)
India Clifton:
6.5% (2,162)New Jersey:
12.8% (274,609)
Philippines Clifton:
4.5% (1,475)New Jersey:
4.0% (85,934)
Turkey Clifton:
3.1% (1,020)New Jersey:
0.8% (16,778)
Ecuador Clifton:
2.6% (861)New Jersey:
4.4% (95,275)
Cuba Clifton:
2.4% (808)New Jersey:
2.1% (45,435)
Korea Clifton:
2.4% (786)New Jersey:
3.3% (70,512)
Brazil Clifton:
1.7% (554)New Jersey:
2.1% (46,020)
Morocco Clifton:
1.6% (539)New Jersey:
0.3% (5,621)
Syria Clifton:
1.6% (536)New Jersey:
0.3% (5,966)
Place of birth for U.S.-born residents:
This state: 42,274Other state: 12,791Northeast: 11,133Midwest: 98South: 1,376West: 184 90.4% of Clifton residents lived in the same house 1 years ago.
Out of people who lived in different houses, 28.6% lived in this county.
Out of people who lived in different counties, 74.6% lived in New Jersey.
Clifton:
90.4%State average:
90.4%
Education attainment for males 25 years and older:
No schooling: 629Nursery to 4th grade: 875th and 6th grade: 2057th and 8th grade: 939th grade: 41110th grade: 18311th grade: 012th grade, no diploma: 1,041High school graduate (or equivalency): 9,190Less than 1 year of college: 1,305Some college more than 1 year, no degree: 3,512Associate degree: 2,981Bachelor's degree: 9,069Master's degree: 2,066Professional school degree: 585Doctorate degree: 170
Education attainment for females 25 years and older:
No schooling: 826Nursery to 4th grade: 05th and 6th grade: 6107th and 8th grade: 3429th grade: 43710th grade: 27911th grade: 9412th grade, no diploma: 398High school graduate (or equivalency): 10,213Less than 1 year of college: 1,018Some college more than 1 year, no degree: 4,088Associate degree: 1,713Bachelor's degree: 8,902Master's degree: 3,761Professional school degree: 476Doctorate degree: 111
Housing units in structures:
One, detached: 16,239One, attached: 2,566Two: 6,0703 or 4: 3,7405 to 9: 2,44610 to 19: 55420 to 49: 1,73450 or more: 1,632Mobile homes: 211Housing units lacking complete kitchen facilities in 2022: 0.2%House/condo owner moved in on average 13 years ago
Renter moved in on average 5 years ago
Private vs. public school enrollment:
Students in private schools in grades 1 to 8 (elementary and middle school): 1,729 Here:
21.7%New Jersey:
12.3%
Students in private schools in grades 9 to 12 (high school): 424 Here:
13.9%New Jersey:
13.1%
Students in private undergraduate colleges: 1,958 Here:
37.0%New Jersey:
33.2%