Clarkston, GA (Georgia) Houses and Residents
| Clarkston: | $248,564 |
| Georgia: | $297,400 |
Mean price in 2022:
Detached houses: $177,404
Here: $177,404 State: $376,364 Townhouses or other attached units: $87,342
Here: $87,342 State: $341,709 In 5-or-more-unit structures: $205,252
Here: $205,252 State: $370,730
Total population: 7,846 (Urban population: 6,826, Rural population: 0)
Houses: 4,917 (3,862 occupied: 471 owner occupied, 3,270 renter occupied)
| % of renters here: | 87% |
| State: | 34% |
Housing density: 4,662 houses/condos per square mile
Median price asked for vacant for-sale houses and condos in 2022: $344,445.
Median contract rent in 2022: $1,167 (lower quartile is $991, upper quartile is $1,349)
Median rent asked for vacant for-rent units in 2022: $1,222
Median gross rent in Clarkston, GA in 2022: $1,327
Housing units in Clarkston with a mortgage: 324 (8 second mortgage, 0 home equity loan, 0 both second mortgage and home equity loan)
Houses without a mortgage: 27
Median household income for houses/condos with a mortgage: $114,264
Median monthly housing costs: $1,265
Compare current foreclosures in Clarkston, GA:
| Photo | Address | Area | Beds / Baths | Price | Details |
|---|---|---|---|---|---|

|
#1
Yuma Dr
Clarkston, GA 30021
|
2,821 sq. feet
|
2 baths 4 beds |
show details | |

|
#2
Church St
Clarkston, GA 30021
|
1,996 sq. feet
|
2 baths 3 beds |
show details | |

|
#3
Glynn Oaks Dr
Clarkston, GA 30021
|
1,330 sq. feet
|
2 baths 3 beds |
show details | |

|
#4
Seville Dr
Clarkston, GA 30021
|
999 sq. feet
|
1 baths 3 beds |
show details | |

|
#5
Prescott Ridge Cir
Clarkston, GA 30021
|
1,636 sq. feet
|
2 baths 3 beds |
show details | |

|
#6
Lincoln St
Clarkston, GA 30021
|
1,816 sq. feet
|
2 baths 3 beds |
show details | |

|
#7
Verdi Way
Clarkston, GA 30021
|
1,331 sq. feet
|
1 baths 3 beds |
show details | |

|
#8
Waterford Pl
Clarkston, GA 30021
|
1,142 sq. feet
|
3 baths 2 beds |
show details | |

|
#9
Casa Woods Ln
Clarkston, GA 30021
|
1,700 sq. feet
|
2 baths 3 beds |
show details | |

|
#10
Mell Ave
Clarkston, GA 30021
|
2,425 sq. feet
|
3 baths 4 beds |
show details |
| Photo | Address | Area | Beds / Baths | Price | Details |
|---|---|---|---|---|---|

|
#11
Clarkston Industrial Blvd # 124
Clarkston, GA 30021
|
- sq. feet
|
- baths - beds |
show details | |

|
#12
Northern Ave Apt 1208
Clarkston, GA 30021
|
- sq. feet
|
- baths - beds |
show details | |

|
#13
Post Oak Dr
Clarkston, GA 30021
|
- sq. feet
|
- baths - beds |
show details | |

|
#14
Noble Vines Dr Apt 2
Clarkston, GA 30021
|
- sq. feet
|
- baths - beds |
show details | |

|
#15
Brockett Rd Apt 13i
Clarkston, GA 30021
|
- sq. feet
|
- baths - beds |
show details | |

|
#16
Summerwood Dr
Clarkston, GA 30021
|
- sq. feet
|
- baths - beds |
show details | |

|
#17
Brockett Trl Apt K
Clarkston, GA 30021
|
- sq. feet
|
- baths - beds |
show details | |

|
#18
Montreal Creek Cir Apt 20
Clarkston, GA 30021
|
- sq. feet
|
- baths - beds |
show details | |

|
#19
Debelle St
Clarkston, GA 30021
|
- sq. feet
|
- baths - beds |
show details | |

|
#20
N Indian Creek Dr Apt 605
Clarkston, GA 30021
|
- sq. feet
|
- baths - beds |
show details |
| Photo | Address | Area | Beds / Baths | Price | Details |
|---|---|---|---|---|---|

|
#21
Summerwood Dr
Clarkston, GA 30021
|
- sq. feet
|
- baths - beds |
show details | |

|
#22
N Indian Creek Dr # 108
Clarkston, GA 30021
|
- sq. feet
|
- baths - beds |
show details | |

|
#23
Post Oak Dr Apt A
Clarkston, GA 30021
|
- sq. feet
|
- baths - beds |
show details | |

|
#24
E Ponce De Leon Ave # D01
Clarkston, GA 30021
|
- sq. feet
|
- baths - beds |
show details | |

|
#25
Brockett Trl Apt C
Clarkston, GA 30021
|
- sq. feet
|
- baths - beds |
show details | |

|
#26
Wild Cir
Clarkston, GA 30021
|
- sq. feet
|
- baths - beds |
show details | |

|
#27
Brockett Trl Apt M
Clarkston, GA 30021
|
- sq. feet
|
- baths - beds |
show details | |

|
#28
Post Oak Dr Apt G
Clarkston, GA 30021
|
- sq. feet
|
- baths - beds |
show details | |

|
#29
Summerwood Dr
Clarkston, GA 30021
|
- sq. feet
|
- baths - beds |
show details | |

|
#30
Northern Ave Apt 1208
Clarkston, GA 30021
|
- sq. feet
|
- baths - beds |
show details |
| Photo | Address | Area | Beds / Baths | Price | Details |
|---|---|---|---|---|---|

|
#31
Noble Vines Dr Apt 4
Clarkston, GA 30021
|
- sq. feet
|
- baths - beds |
show details | |

|
#32
Post Oak Dr Apt E
Clarkston, GA 30021
|
- sq. feet
|
- baths - beds |
show details | |

|
#33
Northern Ave Apt 5101
Clarkston, GA 30021
|
- sq. feet
|
- baths - beds |
show details | |

|
#34
The Oaks
Clarkston, GA 30021
|
- sq. feet
|
- baths - beds |
show details | |

|
#35
Brockett Way
Clarkston, GA 30021
|
- sq. feet
|
- baths - beds |
show details | |

|
Check over 1 million property listings on Foreclosure.com!
|
browse all offers | |||

Latest news about housing in Clarkston, GA collected exclusively by city-data.com from local newspapers, TV, and radio stations

 | Georgia's first Tiny Home Neighborhood Offers New Homes for $100k (77 replies) |
| Moonraker apartments (12 replies) |
| First time homebuyer in metro Atlanta (13 replies) |
| Median Home Sale Price by High School District in Metro Atlanta - Past 90 Days (28 replies) |
| Home buying in Atlanta discouraging... (101 replies) |
| First time home buyer who loves the East Side but has $200,000 to spend (15 replies) |

Median year apartment built: 1980
Household type by relationship:
Households: 14,583- Male householders: 2,056 (313 living alone), Female householders: 1,758 (339 living alone)
1,627 spouses (1,529 opposite-sex spouses), 267 unmarried partners, (256 opposite-sex unmarried partners), 5,788 children (5,547 natural, 80 adopted, 160 stepchildren), 576 grandchildren, 682 brothers or sisters, 548 parents, 131 foster children, 547 other relatives, 580 non-relatives
- In group quarters: 20
Size of family households: 760 2-persons, 567 3-persons, 466 4-persons, 398 5-persons, 288 6-persons, 277 7-or-more-persons.
Size of nonfamily households: 607 1-person, 350 2-persons, 18 3-persons, 29 6-persons.
3,247 married couples with children.
891 single-parent households (208 men, 683 women).
48.8% of residents of Clarkston speak English at home.
1.2% of residents speak Spanish at home (73% speak English very well, 5% speak English well, 22% speak English not well).
16.4% of residents speak other Indo-European language at home (36% speak English very well, 27% speak English well, 18% speak English not well, 18% don't speak English at all).
6.6% of residents speak Asian or Pacific Island language at home (65% speak English very well, 4% speak English well, 8% speak English not well, 23% don't speak English at all).
27.1% of residents speak other language at home (57% speak English very well, 20% speak English well, 21% speak English not well, 1% don't speak English at all).
Foreign born population: 5,647 (38.7%)
(30.9% of them are naturalized citizens)
| Here: | 5.3 |
| State: | 6.8 |
| Here: | 4.5 |
| State: | 4.6 |

- Bedrooms in owner-occupied houses and condos in Clarkston, Georgia
- 0no bedroom
- 161 bedroom
- 1922 bedrooms
- 1753 bedrooms
- 854 bedrooms
- 55+ bedrooms

- Bedrooms in renter-occupied apartments in Clarkston, Georgia
- 91no bedroom
- 6451 bedroom
- 1,9082 bedrooms
- 4653 bedrooms
- 1434 bedrooms
- 195+ bedrooms

- Cars and other vehicles available in Clarkston in owner-occupied houses/condos
- 31no vehicle
- 1211 vehicle
- 1552 vehicles
- 1113 vehicles
- 184 vehicles
- 355+ vehicles

- Cars and other vehicles available in Clarkston in renter-occupied apartments
- 477no vehicle
- 1,3881 vehicle
- 1,0412 vehicles
- 1483 vehicles
- 694 vehicles
- 1475+ vehicles

- Rooms in owner-occupied houses in Clarkston, Georgia
- 01 room
- 02 rooms
- 243 rooms
- 384 rooms
- 1795 rooms
- 1286 rooms
- 637 rooms
- 268 rooms
- 159+ rooms

- Rooms in renter-occupied apartments in Clarkston, Georgia
- 911 room
- 1852 rooms
- 2233 rooms
- 8334 rooms
- 1,2355 rooms
- 3036 rooms
- 1147 rooms
- 828 rooms
- 2049+ rooms


Clarkston, GA household income distribution

- 235Less than $10,000
- 302$10,000 to $19,999
- 347$20,000 to $29,999
- 515$30,000 to $39,999
- 331$40,000 to $49,999
- 412$50,000 to $59,999
- 699$60,000 to $74,999
- 277$75,000 to $99,999
- 134$100,000 to $124,999
- 171$125,000 to $149,999
- 180$150,000 to $199,999
- 129$200,000 or more

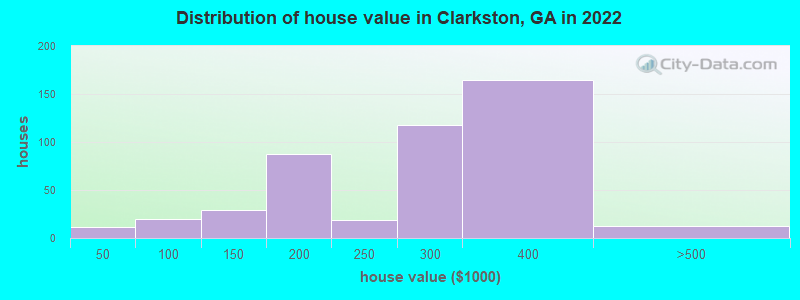
Home value of owner - occupied houses in 2022 in Clarkston, GA
-
- 11Less than $10,000
- 19$70,000 to $79,999
- 16$100,000 to $124,999
- 12$125,000 to $149,999
- 42$150,000 to $174,999
- 45$175,000 to $199,999
- 18$200,000 to $249,999
- 117$250,000 to $299,999
- 165$300,000 to $399,999
- 11$400,000 to $499,999
Rent paid by renters in 2022 in Clarkston, GA
-
- 44$100 to $149
- 32$200 to $249
- 0$450 to $499
- 10$650 to $699
- 64$700 to $749
- 46$750 to $799
- 248$800 to $899
- 462$900 to $999
- 1,119$1,000 to $1,249
- 369$1,250 to $1,499
- 189$1,500 to $1,999
- 42$2,000 to $2,499
- 75No cash rent


Percentage of workers working in this county: 57.3%
Number of people working at home: 799 (13.1% of all workers)
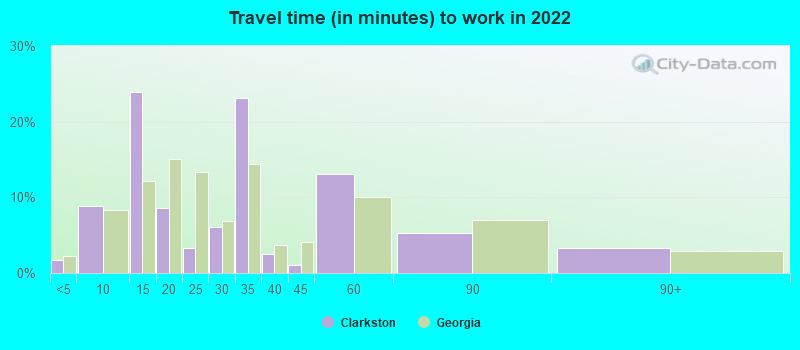
Travel time to work (commute)
- Less than 5 minutes: 15
- 5 to 9 minutes: 186
- 10 to 14 minutes: 472
- 15 to 19 minutes: 452
- 20 to 24 minutes: 626
- 25 to 29 minutes: 359
- 30 to 34 minutes: 1,153
- 35 to 39 minutes: 130
- 40 to 44 minutes: 213
- 45 to 59 minutes: 632
- 60 to 89 minutes: 623
- 90 or more minutes: 188
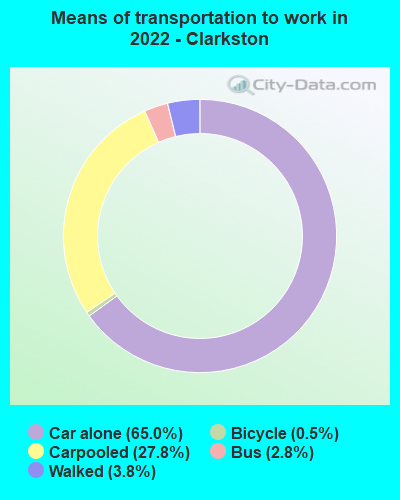
Means of transportation to work:
- Drove a car alone: 835 (42.6%)
- Carpooled: 322 (16.4%)
- Bus: 29 (1.5%)
- Bicycle: 10 (0.5%)
- Walked: 57 (2.9%)
- Worked at home: 799 (40.8%)

- Unemployment by race in 2022
- Unemployment rate for White non-Hispanic residents
- 1.2%Males
- Unemployment rate for Black residents
- 9.9%Males
- 6.5%Females
- Unemployment rate for Asian residents
- 6.6%Males
- 1.9%Females
- Unemployment rate for two or more race residents
- 25.0%Males
- Unemployment rate for Hispanic or Latino residents
- 100.0%Females

- Year of entry for the foreign-born population in Clarkston, Georgia
- 4,2572010 or later
- 9372000 to 2009
- 3941990 to 1999
- 2681980 to 1989
- 431970 to 1979
- 20Before 1970

First ancestries reported:
- Ethiopian: 3,062 (28.5%)
- Finnish: 368 (3.4%)
- African: 329 (3.1%)
- European: 170 (1.6%)
- Afghan: 164 (1.5%)
- American: 148 (1.4%)
- English: 145 (1.4%)
- Ghanaian: 98 (0.9%)
- Ugandan: 93 (0.9%)
- Sudanese: 60 (0.6%)
- Jamaican: 57 (0.5%)
- Scottish: 48 (0.4%)
- Arab: 42 (0.4%)
- Scotch-Irish: 41 (0.4%)
- Bermudan: 37 (0.3%)
- Guyanese: 26 (0.2%)
- Irish: 24 (0.2%)
- Somali: 20 (0.2%)
- German: 19 (0.2%)
- Portuguese: 15 (0.1%)
- Turkish: 15 (0.1%)
- Italian: 14 (0.1%)
- Nigerian: 12 (0.1%)
- Dutch: 9 (0.08%)
- Swiss: 8 (0.07%)
- Iraqi: 5 (0.05%)
Most common places of birth for foreign-born residents (%):
| Clarkston: | 31.7% (1,922) |
| Georgia: | 1.6% (17,643) |
| Clarkston: | 10.1% (615) |
| Georgia: | 0.5% (5,046) |
| Clarkston: | 7.2% (435) |
| Georgia: | 0.3% (3,559) |
| Clarkston: | 6.8% (412) |
| Georgia: | 0.2% (2,278) |
| Clarkston: | 5.0% (301) |
| Georgia: | 0.2% (2,737) |
| Clarkston: | 4.1% (250) |
| Georgia: | 0.2% (2,325) |
| Clarkston: | 3.8% (233) |
| Georgia: | 0.1% (1,460) |
| Clarkston: | 3.6% (221) |
| Georgia: | 0.3% (3,603) |
| Clarkston: | 3.6% (216) |
| Georgia: | 0.1% (927) |
| Clarkston: | 3.6% (216) |
| Georgia: | 0.3% (3,069) |
| Clarkston: | 2.6% (157) |
| Georgia: | 0.3% (3,330) |
| Clarkston: | 2.6% (155) |
| Georgia: | 0.2% (2,337) |
| Clarkston: | 1.7% (103) |
| Georgia: | 0.4% (4,565) |
| Clarkston: | 1.7% (101) |
| Georgia: | 0.4% (4,387) |
Place of birth for U.S.-born residents:
- This state: 5,136
- Other state: 3,240
- Northeast: 744
- Midwest: 594
- South: 1,764
- West: 135
76.7% of Clarkston residents lived in the same house 1 years ago.
Out of people who lived in different houses, 41.3% lived in this county.
Out of people who lived in different counties, 73.1% lived in Georgia.
| Clarkston: | 76.7% |
| State average: | 86.6% |
Education attainment for males 25 years and older:
- No schooling: 340
- Nursery to 4th grade: 44
- 5th and 6th grade: 7
- 7th and 8th grade: 31
- 9th grade: 32
- 10th grade: 38
- 11th grade: 69
- 12th grade, no diploma: 197
- High school graduate (or equivalency): 1,419
- Less than 1 year of college: 324
- Some college more than 1 year, no degree: 627
- Associate degree: 134
- Bachelor's degree: 507
- Master's degree: 192
- Professional school degree: 31
- Doctorate degree: 33

Education attainment for females 25 years and older:
- No schooling: 688
- Nursery to 4th grade: 86
- 5th and 6th grade: 124
- 7th and 8th grade: 28
- 9th grade: 0
- 10th grade: 84
- 11th grade: 69
- 12th grade, no diploma: 195
- High school graduate (or equivalency): 1,044
- Less than 1 year of college: 112
- Some college more than 1 year, no degree: 539
- Associate degree: 238
- Bachelor's degree: 737
- Master's degree: 389
- Professional school degree: 0
- Doctorate degree: 58


Housing units in structures:
- One, detached: 805
- One, attached: 321
- Two: 98
- 3 or 4: 575
- 5 to 9: 1,073
- 10 to 19: 1,192
- 20 to 49: 403
- 50 or more: 434
- Mobile homes: 1
- Boats, RVs, vans, etc.: 11
Housing units lacking complete kitchen facilities in 2022: 0.7%
House/condo owner moved in on average 6 years ago
Renter moved in on average 2 years ago

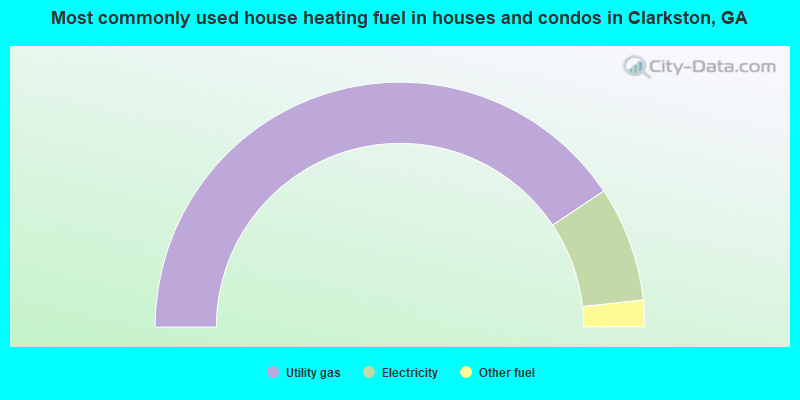
- 81.2%Utility gas
- 15.2%Electricity
- 3.5%Other fuel
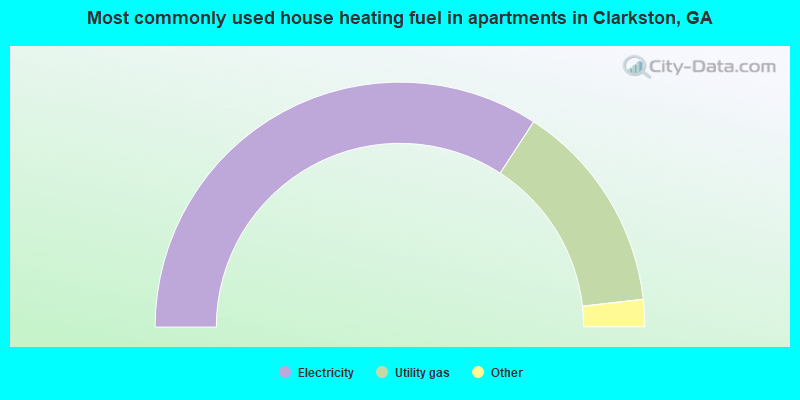
- 68.4%Electricity
- 28.0%Utility gas
- 2.9%Bottled, tank, or LP gas
- 0.5%No fuel used
- 0.2%Solar energy
Private vs. public school enrollment:
| Here: | 15.8% |
| Georgia: | 12.1% |
| Here: | 2.8% |
| Georgia: | 10.8% |
| Here: | 0.5% |
| Georgia: | 17.1% |


