Clarendon Hills, IL (Illinois) Houses and Residents
| Clarendon Hills: | $575,648 |
| Illinois: | $251,600 |
Mean price in 2022:
Detached houses: $890,899
Here: $890,899 State: $310,164 Townhouses or other attached units: $337,113
Here: $337,113 State: $286,230 In 5-or-more-unit structures: $185,126
Here: $185,126 State: $318,887
Total population: 8,658 (Urban population: 7,708, Rural population: 0)
Houses: 3,400 (3,293 occupied: 2,773 owner occupied, 523 renter occupied)
| % of renters here: | 16% |
| State: | 33% |
Housing density: 1,956 houses/condos per square mile
Median price asked for vacant for-sale houses and condos in 2022 in this county: $467,579.
Median contract rent in 2022: $1,110 (lower quartile is $785, upper quartile is $1,652)
Median rent asked for vacant for-rent units in 2022: $1,089
Median gross rent in Clarendon Hills, IL in 2022: $1,080
Housing units in Clarendon Hills with a mortgage: 2,030 (196 second mortgage, 0 home equity loan, 200 both second mortgage and home equity loan)
Houses without a mortgage: 26
Median household income for houses/condos with a mortgage: $173,965
Median household income for apartments without a mortgage: $95,667
Median monthly housing costs: $2,074
Compare current foreclosures near Clarendon Hills, IL:
| Photo | Address | Area | Beds / Baths | Price | Details |
|---|---|---|---|---|---|

|
#1
N Prospect Ave
Clarendon Hills, IL 60514
|
1,245 sq. feet
|
1 baths - beds |
show details | |

|
#2
55th St Apt 203
Clarendon Hills, IL 60514
|
- sq. feet
|
- baths - beds |
show details | |

|
#3
Tennessee Ave Apt 103
Clarendon Hills, IL 60514
|
- sq. feet
|
- baths - beds |
show details | |

|
#4
Juliet Ct
Clarendon Hills, IL 60514
|
- sq. feet
|
- baths - beds |
show details | |

|
#5
58th St Apt 25b
Clarendon Hills, IL 60514
|
- sq. feet
|
- baths - beds |
show details | |

|
#6
S Main St
Hometown, IL 60456
|
744 sq. feet
|
1 baths 2 beds |
$175,000
|
show details |

|
#7
S Vanderpoel Ave
Chicago, IL 60643
|
2,352 sq. feet
|
2 baths 7 beds |
$115,000
|
show details |

|
#8
W Arquilla Dr
Palos Heights, IL 60463
|
1,780 sq. feet
|
2 baths 2 beds |
$299,900
|
show details |

|
#9
S 13th Ave
Maywood, IL 60153
|
1,176 sq. feet
|
1 baths 3 beds |
$279,900
|
show details |

|
#10
N Austin Ave
Chicago, IL 60634
|
2,500 sq. feet
|
3 baths 4 beds |
$365,000
|
show details |
| Photo | Address | Area | Beds / Baths | Price | Details |
|---|---|---|---|---|---|

|
#11
W Van Buren St
Chicago, IL 60644
|
2,839 sq. feet
|
3 baths 8 beds |
$87,500
|
show details |

|
#12
N Olcott Ave
Chicago, IL 60634
|
2,161 sq. feet
|
2 baths 4 beds |
$559,000
|
show details |

|
#13
Raymond Ave
Brookfield, IL 60513
|
1,020 sq. feet
|
1 baths 2 beds |
$219,900
|
show details |

|
#14
Newcastle Ave
Westchester, IL 60154
|
1,640 sq. feet
|
1 baths 2 beds |
$239,200
|
show details |

|
#15
W Garfield Blvd
Chicago, IL 60636
|
2,820 sq. feet
|
2 baths 5 beds |
$132,500
|
show details |

|
#16
Webster Ln
Des Plaines, IL 60018
|
1,608 sq. feet
|
3 baths 3 beds |
$515,000
|
show details |

|
#17
S Union Ave
Chicago, IL 60620
|
1,920 sq. feet
|
2 baths 4 beds |
$75,000
|
show details |

|
#18
Tall Oaks Dr
Aurora, IL 60505
|
685 sq. feet
|
1 baths 1 beds |
$127,000
|
show details |

|
#19
S Emerald Ave
Chicago, IL 60620
|
1,080 sq. feet
|
1 baths 2 beds |
$34,900
|
show details |

|
#20
W 63rd St
Chicago, IL 60638
|
1,250 sq. feet
|
2 baths 4 beds |
$385,000
|
show details |
| Photo | Address | Area | Beds / Baths | Price | Details |
|---|---|---|---|---|---|

|
#21
S Tripp Ave
Oak Lawn, IL 60453
|
1,591 sq. feet
|
1 baths 3 beds |
$212,000
|
show details |

|
#22
145th St
Midlothian, IL 60445
|
2,000 sq. feet
|
1 baths 3 beds |
$179,900
|
show details |

|
#23
E Crest Ave
Addison, IL 60101
|
2,023 sq. feet
|
1 baths 5 beds |
$296,100
|
show details |

|
#24
N 74th Ave
Elmwood Park, IL 60707
|
1,300 sq. feet
|
1 baths 3 beds |
$235,000
|
show details |

|
#25
W 108th St Apt D
Chicago, IL 60643
|
1,300 sq. feet
|
2 baths 3 beds |
$144,900
|
show details |

|
#26
Holmes Ave
Clarendon Hills, IL 60514
|
- sq. feet
|
- baths - beds |
show details | |

|
#27
Tuttle Ave
Clarendon Hills, IL 60514
|
- sq. feet
|
- baths - beds |
show details | |

|
#28
Ogden Ave
Clarendon Hills, IL 60514
|
- sq. feet
|
- baths - beds |
show details | |

|
#29
Prospect Ave
Clarendon Hills, IL 60514
|
- sq. feet
|
- baths - beds |
show details | |

|
#30
Washington Blvd Apt 1
Oak Park, IL 60302
|
- sq. feet
|
1 baths 2 beds |
$149,900
|
show details |
| Photo | Address | Area | Beds / Baths | Price | Details |
|---|---|---|---|---|---|

|
#31
W Quincy St
Chicago, IL 60644
|
960 sq. feet
|
1 baths - beds |
$19,000
|
show details |

|
#32
Serendipity Dr
Aurora, IL 60504
|
- sq. feet
|
1 baths 3 beds |
$213,200
|
show details |

|
#33
Capista Dr
Plainfield, IL 60544
|
- sq. feet
|
2 baths 4 beds |
$405,600
|
show details |

|
#34
W Arthington St
Chicago, IL 60612
|
969 sq. feet
|
1 baths - beds |
$20,000
|
show details |

|
#35
Avenida Serra Test
Des Plaines, IL 60018
|
- sq. feet
|
2 baths 3 beds |
$100,000
|
show details |

|
#36
Fairfax Ave
Romeoville, IL 60446
|
- sq. feet
|
1 baths 3 beds |
$229,900
|
show details |

|
#37
S Charles St
Chicago, IL 60643
|
- sq. feet
|
4 baths 6 beds |
$349,900
|
show details |

|
#38
Lathrop Ave Apt 404
Forest Park, IL 60130
|
675 sq. feet
|
1 baths 1 beds |
show details | |

|
#39
S Rockwell St
Chicago, IL 60632
|
3,554 sq. feet
|
3 baths 6 beds |
show details | |

|
#40
S Morgan St
Chicago, IL 60620
|
2,700 sq. feet
|
2 baths 6 beds |
show details |
| Photo | Address | Area | Beds / Baths | Price | Details |
|---|---|---|---|---|---|

|
#41
Kirkland Lane
Villa Park, IL 60181
|
1,100 sq. feet
|
2 baths 3 beds |
show details | |

|
#42
Scarsdale Ct Unit C2
Schaumburg, IL 60193
|
950 sq. feet
|
1 baths 2 beds |
show details | |

|
#43
S Cicero Ave Apt 2c
Oak Lawn, IL 60453
|
1,200 sq. feet
|
1 baths 2 beds |
show details | |

|
#44
W Cermak Rd
Chicago, IL 60623
|
2,971 sq. feet
|
3 baths 7 beds |
show details | |

|
#45
W 18th St
Chicago, IL 60608
|
2,571 sq. feet
|
4 baths 6 beds |
show details | |

|
#46
Hesterman Dr
Glendale Heights, IL 60139
|
1,263 sq. feet
|
2 baths 2 beds |
show details | |

|
#47
W Flournoy St
Chicago, IL 60624
|
1,288 sq. feet
|
2 baths - beds |
$17,000
|
show details |

|
#48
W Corcoran Pl Apt 1
Chicago, IL 60644
|
- sq. feet
|
2 baths 3 beds |
$199,900
|
show details |

|
#49
W Grenshaw St
Chicago, IL 60624
|
2,148 sq. feet
|
2 baths 6 beds |
show details | |

|
Check over 1 million property listings on Foreclosure.com!
|
browse all offers | |||


Median year apartment built: 1986
Household type by relationship:
Households: 8,568- Male householders: 1,536 (211 living alone), Female householders: 1,706 (664 living alone)
2,086 spouses (2,086 opposite-sex spouses), 13 unmarried partners, (13 opposite-sex unmarried partners), 3,122 children (3,122 natural, 0 adopted, 0 stepchildren), 4 grandchildren, 22 brothers or sisters, 17 parents, 0 foster children, 0 other relatives, 16 non-relatives
- In group quarters: 40
Size of family households: 789 2-persons, 646 3-persons, 678 4-persons, 174 5-persons, 22 6-persons, 34 7-or-more-persons.
Size of nonfamily households: 907 1-person, 31 2-persons.
2,371 married couples with children.
200 single-parent households (74 men, 126 women).
80.1% of residents of Clarendon Hills speak English at home.
5.3% of residents speak Spanish at home (78% speak English very well, 21% speak English well, 1% speak English not well).
10.6% of residents speak other Indo-European language at home (96% speak English very well, 4% speak English well).
2.7% of residents speak Asian or Pacific Island language at home (74% speak English very well, 22% speak English well, 4% don't speak English at all).
Foreign born population: 1,156 (13.5%)
(39.4% of them are naturalized citizens)
| Here: | 8.0 |
| State: | 6.4 |
| Here: | 3.2 |
| State: | 4.1 |

- Bedrooms in owner-occupied houses and condos in Clarendon Hills, Illinois
- 0no bedroom
- 1851 bedroom
- 5272 bedrooms
- 6403 bedrooms
- 1,0554 bedrooms
- 3665+ bedrooms

- Bedrooms in renter-occupied apartments in Clarendon Hills, Illinois
- 18no bedroom
- 2401 bedroom
- 1802 bedrooms
- 603 bedrooms
- 04 bedrooms
- 245+ bedrooms

- Cars and other vehicles available in Clarendon Hills in owner-occupied houses/condos
- 59no vehicle
- 8021 vehicle
- 1,4742 vehicles
- 3453 vehicles
- 624 vehicles
- 315+ vehicles

- Cars and other vehicles available in Clarendon Hills in renter-occupied apartments
- 34no vehicle
- 2951 vehicle
- 1822 vehicles
- 123 vehicles
- 04 vehicles
- 05+ vehicles

- Rooms in owner-occupied houses in Clarendon Hills, Illinois
- 01 room
- 672 rooms
- 953 rooms
- 974 rooms
- 4065 rooms
- 2156 rooms
- 3777 rooms
- 2268 rooms
- 1,2909+ rooms

- Rooms in renter-occupied apartments in Clarendon Hills, Illinois
- 181 room
- 1082 rooms
- 1703 rooms
- 1434 rooms
- 05 rooms
- 06 rooms
- 157 rooms
- 458 rooms
- 249+ rooms


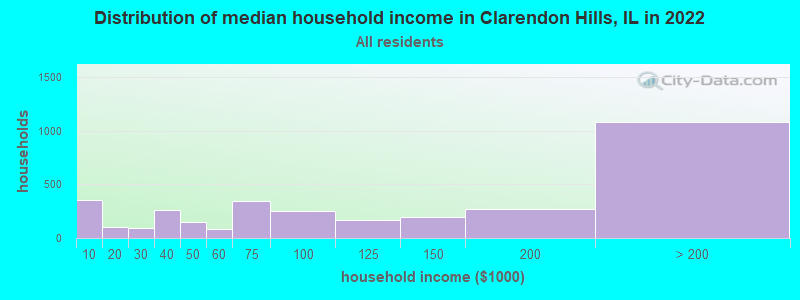
Clarendon Hills, IL household income distribution

- 354Less than $10,000
- 106$10,000 to $19,999
- 97$20,000 to $29,999
- 264$30,000 to $39,999
- 154$40,000 to $49,999
- 83$50,000 to $59,999
- 343$60,000 to $74,999
- 249$75,000 to $99,999
- 167$100,000 to $124,999
- 192$125,000 to $149,999
- 270$150,000 to $199,999
- 1,083$200,000 or more
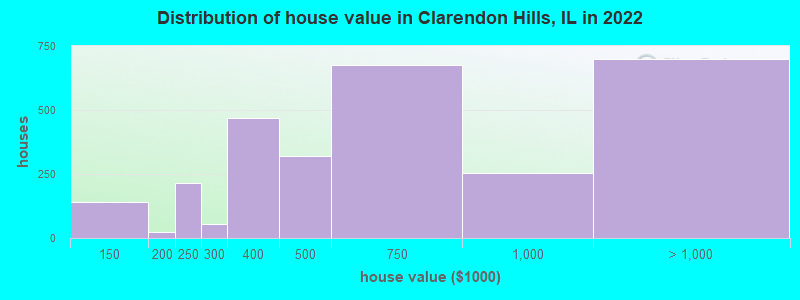
Home value of owner - occupied houses in 2022 in Clarendon Hills, IL
-
- 122$100,000 to $124,999
- 16$125,000 to $149,999
- 7$150,000 to $174,999
- 15$175,000 to $199,999
- 215$200,000 to $249,999
- 54$250,000 to $299,999
- 467$300,000 to $399,999
- 320$400,000 to $499,999
- 676$500,000 to $749,999
- 254$750,000 to $999,999
- 565$1,000,000 to $1,499,999
- 112$1,500,000 to $1,999,999
- 22$2,000,000 or more
Rent paid by renters in 2022 in Clarendon Hills, IL
-
- 14$550 to $599
- 32$650 to $699
- 102$750 to $799
- 30$900 to $999
- 169$1,000 to $1,249
- 102$1,500 to $1,999
- 17$2,000 to $2,499
- 30$3,000 to $3,499
- 11No cash rent


Percentage of workers working in this county: 72.1%
Number of people working at home: 1,437 (36.9% of all workers)
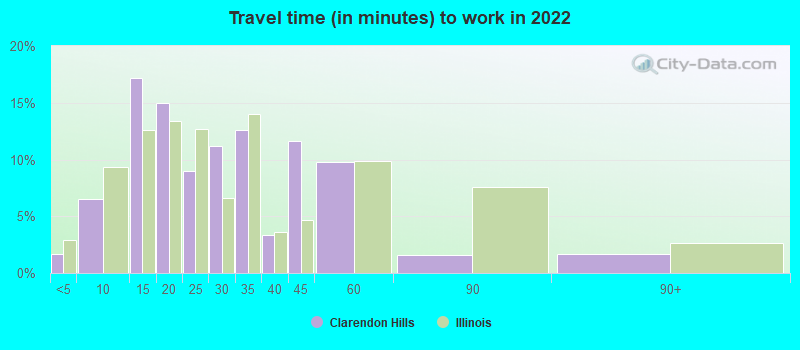
Travel time to work (commute)
- Less than 5 minutes: 41
- 5 to 9 minutes: 226
- 10 to 14 minutes: 407
- 15 to 19 minutes: 328
- 20 to 24 minutes: 351
- 25 to 29 minutes: 243
- 30 to 34 minutes: 117
- 35 to 39 minutes: 113
- 40 to 44 minutes: 224
- 45 to 59 minutes: 416
- 60 to 89 minutes: 98
- 90 or more minutes: 56
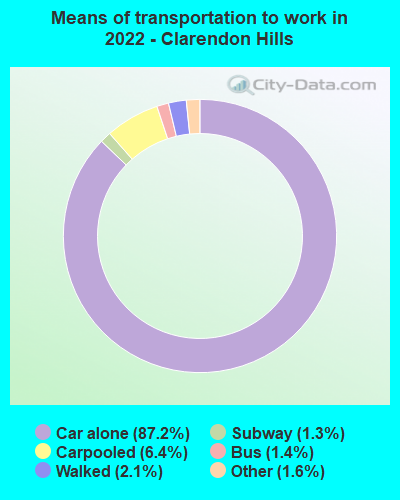
Means of transportation to work:
- Drove a car alone: 1,220 (45.5%)
- Carpooled: 110 (4.1%)
- Bus: 28 (1.0%)
- Long-distance train or commuter rail: 16 (0.6%)
- Taxi: 26 (1.0%)
- Walked: 27 (1.0%)
- Worked at home: 1,437 (53.6%)

- Unemployment by race in 2022
- Unemployment rate for White non-Hispanic residents
- 3.2%Males
- 2.4%Females
- Unemployment rate for two or more race residents
- 7.5%Females

- Year of entry for the foreign-born population in Clarendon Hills, Illinois
- 712010 or later
- 4902000 to 2009
- 2371990 to 1999
- 631980 to 1989
- 511970 to 1979
- 183Before 1970
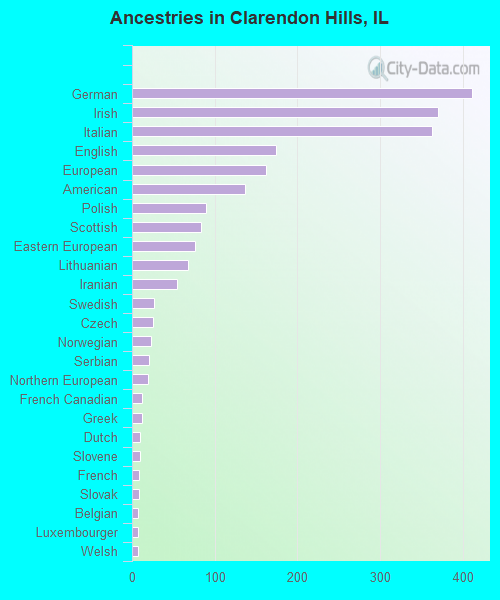
First ancestries reported:
- German: 411 (11.4%)
- Irish: 370 (10.3%)
- Italian: 363 (10.1%)
- English: 174 (4.8%)
- European: 162 (4.5%)
- American: 136 (3.8%)
- Polish: 89 (2.5%)
- Scottish: 83 (2.3%)
- Eastern European: 76 (2.1%)
- Lithuanian: 68 (1.9%)
- Iranian: 54 (1.5%)
- Swedish: 26 (0.7%)
- Czech: 25 (0.7%)
- Norwegian: 23 (0.6%)
- Serbian: 21 (0.6%)
- Northern European: 19 (0.5%)
- French Canadian: 12 (0.3%)
- Greek: 12 (0.3%)
- Dutch: 10 (0.3%)
- Slovene: 10 (0.3%)
- French: 8 (0.2%)
- Slovak: 8 (0.2%)
- Belgian: 7 (0.2%)
- Luxembourger: 7 (0.2%)
- Welsh: 7 (0.2%)
- Ukrainian: 2 (0.06%)
Most common places of birth for foreign-born residents (%):
| Clarendon Hills: | 37.8% (440) |
| Illinois: | 9.2% (166,409) |
| Clarendon Hills: | 24.2% (282) |
| Illinois: | 0.2% (3,363) |
| Clarendon Hills: | 14.1% (164) |
| Illinois: | 34.7% (626,958) |
| Clarendon Hills: | 4.5% (52) |
| Illinois: | 0.4% (6,922) |
| Clarendon Hills: | 3.8% (44) |
| Illinois: | 0.5% (8,235) |
| Clarendon Hills: | 3.8% (44) |
| Illinois: | 5.2% (93,003) |
| Clarendon Hills: | 3.8% (44) |
| Illinois: | 4.1% (74,364) |
| Clarendon Hills: | 2.6% (30) |
| Illinois: | 0.9% (15,679) |
| Clarendon Hills: | 2.1% (25) |
| Illinois: | 0.6% (10,776) |
| Clarendon Hills: | 1.6% (19) |
| Illinois: | 0.6% (10,249) |
Place of birth for U.S.-born residents:
- This state: 5,389
- Other state: 1,970
- Northeast: 374
- Midwest: 1,174
- South: 226
- West: 216
91.7% of Clarendon Hills residents lived in the same house 1 years ago.
Out of people who lived in different houses, 32.6% lived in this county.
Out of people who lived in different counties, 76.8% lived in Illinois.
| Clarendon Hills: | 91.7% |
| State average: | 88.3% |
Education attainment for males 25 years and older:
- No schooling: 2
- Nursery to 4th grade: 2
- 5th and 6th grade: 10
- 7th and 8th grade: 0
- 9th grade: 30
- 10th grade: 0
- 11th grade: 0
- 12th grade, no diploma: 0
- High school graduate (or equivalency): 110
- Less than 1 year of college: 22
- Some college more than 1 year, no degree: 104
- Associate degree: 83
- Bachelor's degree: 1,125
- Master's degree: 615
- Professional school degree: 286
- Doctorate degree: 103

Education attainment for females 25 years and older:
- No schooling: 0
- Nursery to 4th grade: 0
- 5th and 6th grade: 0
- 7th and 8th grade: 0
- 9th grade: 67
- 10th grade: 0
- 11th grade: 0
- 12th grade, no diploma: 0
- High school graduate (or equivalency): 201
- Less than 1 year of college: 83
- Some college more than 1 year, no degree: 199
- Associate degree: 86
- Bachelor's degree: 1,190
- Master's degree: 684
- Professional school degree: 499
- Doctorate degree: 23


Housing units in structures:
- One, detached: 2,410
- One, attached: 214
- 3 or 4: 75
- 5 to 9: 259
- 10 to 19: 127
- 20 to 49: 241
- 50 or more: 72
House/condo owner moved in on average 9 years ago
Renter moved in on average 0 years ago

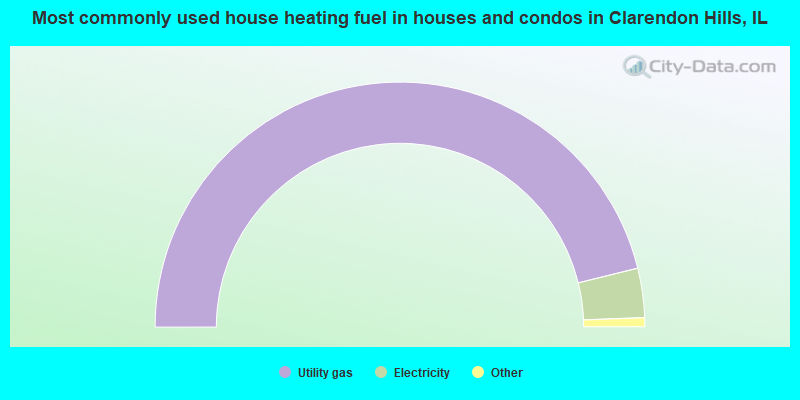
- 92.4%Utility gas
- 6.5%Electricity
- 0.8%Fuel oil, kerosene, etc.
- 0.3%Bottled, tank, or LP gas
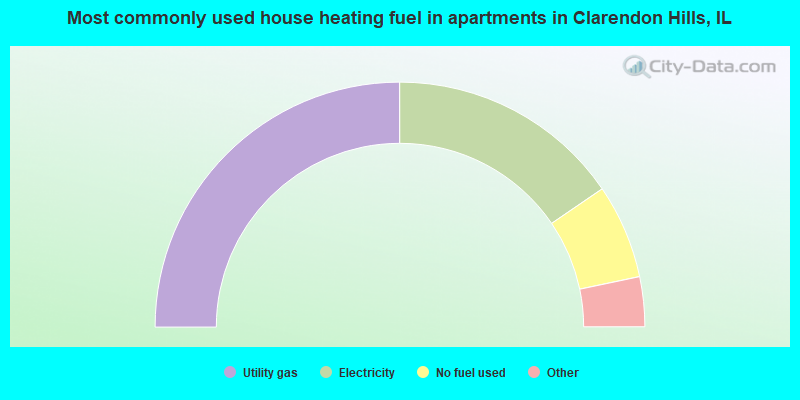
- 50.0%Utility gas
- 31.0%Electricity
- 12.5%No fuel used
- 3.5%Bottled, tank, or LP gas
- 3.1%Other fuel
Private vs. public school enrollment:
| Here: | 16.0% |
| Illinois: | 13.3% |
| Here: | 14.3% |
| Illinois: | 9.9% |
| Here: | 18.0% |
| Illinois: | 27.4% |


