Cimarron Hills, CO (Colorado) Houses and Residents
Estimated median house or condo value in 2022: $373,461 (it was $118,500 in 2000 )
Cimarron Hills:
$373,461Colorado:
$531,100
Lower value quartile - upper value quartile: $290,764 - $474,290Mean price in 2022: Detached houses: $315,896 Here:
$315,896State:
$676,667
Townhouses or other attached units: $194,412 Here:
$194,412State:
$526,340
Mobile homes: $61,261 Here:
$61,261State:
$115,510
Total population: 16,161 (Urban population: 14,986, Rural population: 270 (all nonfarm) )
Houses: 7,750 (7,422 occupied: 5,789 owner occupied, 1,707 renter occupied )
% of renters here:
23%State:
34%
Housing density: 1,271 houses/condos per square mile
Median price asked for vacant for-sale houses and condos in 2022 in this county: $443,323.
Median contract rent in 2022: $1,167 (lower quartile is $954, upper quartile is $1,488)
Median rent asked for vacant for-rent units in 2022: $842
Median gross rent in Cimarron Hills, CO in 2022: $1,340
Housing units in Cimarron Hills with a mortgage: 4,107 (326 second mortgage, 11 home equity loan, 200 both second mortgage and home equity loan )Houses without a mortgage: 40
Median household income for houses/condos with a mortgage: $99,121
Median household income for apartments without a mortgage: $68,556
Median monthly housing costs: $1,463
Data:
Median house or condo value ($)
Median house or condo value ($ change since 2000)
Median house or condo value ($) - White
Median house or condo value ($) - Black or African American
Median house or condo value ($) - Asian
Median house or condo value ($) - Hispanic or Latino
Median house or condo value ($) - American Indian and Alaska Native
Median house or condo value ($) - Multirace
Median house or condo value ($) - Other Race
Median price asked for mobile homes ($)
Household density (households per square mile)
Mean house or condo value by units in structure - 1, detached ($)
Mean house or condo value by units in structure - 1, attached ($)
Mean house or condo value by units in structure - 2 ($)
Mean house or condo value by units in structure by units in structure - 3 or 4 ($)
Mean house or condo value by units in structure - 5 or more ($)
Mean house or condo value by units in structure - Boat, RV, van, etc. ($)
Mean house or condo value by units in structure - Mobile home ($)
Median contract rent ($)
Median contract rent - Lower quartile ($)
Median contract rent - Upper quartile ($)
Median gross rent ($)
Urban houses (%)
Rural houses (%)
Houses occupied (%)
Houses occupied (% change since 2000)
Houses owner occupied (%)
Houses owner occupied (% change since 2000)
Houses renter occupied (%)
Houses renter occupied (% change since 2000)
Vacant housing units - For rent (%)
Vacant housing units - For rent (% change since 2000)
Vacant housing units - For sale only (%)
Vacant housing units - For sale only (% change since 2000)
Vacant housing units - Rented or sold, not occupied (%)
Vacant housing units - Rented or sold, not occupied (% change since 2000)
Vacant housing units - For seasonal, recreational, or occasional use (%)
Vacant housing units - For seasonal, recreational, or occasional use (% change since 2000)
Vacant housing units - For migrant workers (%)
Vacant housing units - For migrant workers (% change since 2000)
Vacant housing units - Other vacant (%)
Vacant housing units - Other vacant (% change since 2000)
Median monthly housing costs ($)
Median household income for houses/condos with a mortgage ($)
Median household income for houses/condos without a mortgage ($)
Median household income ($)
Median household income ($) - White
Median household income ($) - Black or African American
Median household income ($) - Asian
Median household income ($) - Hispanic or Latino
Median household income ($) - American Indian and Alaska Native
Median household income ($) - Multirace
Median household income ($) - Other Race
Mortgage status - with mortgage (%)
Mortgage status - with second mortgage (%)
Mortgage status - with home equity loan (%)
Mortgage status - with both second mortgage and home equity loan (%)
Mortgage status - without a mortgage (%)
Median year house/condo built
Median year apartment built
Household type by relationship - Male householder living alone (%)
Household type by relationship - Male householder not living alone (%)
Household type by relationship - Female householder living alone (%)
Household type by relationship - Female householder not living alone (%)
Household type by relationship - Opposite-Sex spouse (%)
Household type by relationship - Same-Sex spouse (%)
Household type by relationship - Opposite-Sex unmarried partner (%)
Household type by relationship - Same-Sex unmarried partner (%)
Household type by relationship - In group quarters (%)
Size of family households - 2-person household (%)
Size of family households - 3-person household (%)
Size of family households - 4-person household (%)
Size of family households - 5-person household (%)
Size of family households - 6-person household (%)
Size of family households - 7-or-more-person household (%)
Size of nonfamily households - 1-person household (%)
Size of nonfamily households - 2-person household (%)
Size of nonfamily households - 3-person household (%)
Size of nonfamily households - 4-person household (%)
Size of nonfamily households - 5-person household (%)
Size of nonfamily households - 6-person household (%)
Size of nonfamily households - 7-or-moreperson household (%)
Year house built - Built 2010 or later (%)
Year house built - Built 2000 to 2009 (%)
Year house built - Built 1990 to 1999 (%)
Year house built - Built 1980 to 1989 (%)
Year house built - Built 1970 to 1979 (%)
Year house built - Built 1960 to 1969 (%)
Year house built - Built 1950 to 1959 (%)
Year house built - Built 1940 to 1949 (%)
Year house built - Built 1939 or earlier (%)
Median number of rooms in houses and condos
Median number of rooms in apartments
Median number of bedrooms in owner occupied houses
Mean number of bedrooms in owner occupied houses
Median number of bedrooms in renter occupied houses
Mean number of bedrooms in renter occupied houses
Median number of vehichles in owner occupied houses
Mean number of vehichles in owner occupied houses
Median number of vehichles in renter occupied houses
Mean number of vehichles in renter occupied houses
Rooms in owner-occupied houses - 1 room (%)
Rooms in owner-occupied houses - 2 rooms (%)
Rooms in owner-occupied houses - 3 rooms (%)
Rooms in owner-occupied houses - 4 rooms (%)
Rooms in owner-occupied houses - 5 rooms (%)
Rooms in owner-occupied houses - 6 rooms (%)
Rooms in owner-occupied houses - 7 rooms (%)
Rooms in owner-occupied houses - 8 rooms (%)
Rooms in owner-occupied houses - 9+ rooms (%)
Rooms in renter-occupied houses - 1 room (%)
Rooms in renter-occupied houses - 2 rooms (%)
Rooms in renter-occupied houses - 3 rooms (%)
Rooms in renter-occupied houses - 4 rooms (%)
Rooms in renter-occupied houses - 5 rooms (%)
Rooms in renter-occupied houses - 6 rooms (%)
Rooms in renter-occupied houses - 7 rooms (%)
Rooms in renter-occupied houses - 8 rooms (%)
Rooms in renter-occupied houses - 9+ rooms (%)
Bedrooms in owner-occupied houses - no bedrooms (%)
Bedrooms in owner-occupied houses - 1 bedroom (%)
Bedrooms in owner-occupied houses - 2 bedrooms (%)
Bedrooms in owner-occupied houses - 3 bedrooms (%)
Bedrooms in owner-occupied houses - 4 bedrooms (%)
Bedrooms in owner-occupied houses - 5+ bedrooms (%)
Bedrooms in renter-occupied houses - no bedrooms (%)
Bedrooms in renter-occupied houses - 1 bedroom (%)
Bedrooms in renter-occupied houses - 2 bedrooms (%)
Bedrooms in renter-occupied houses - 3 bedrooms (%)
Bedrooms in renter-occupied houses - 4 bedrooms (%)
Bedrooms in renter-occupied houses - 5+ bedrooms (%)
Vehicles available in owner-occupied houses - no vehicle available (%)
Vehicles available in owner-occupied houses - 1 vehicle available(%)
Vehicles available in owner-occupied houses - 2 Vehicles available (%)
Vehicles available in owner-occupied houses - 3 Vehicles available (%)
Vehicles available in owner-occupied houses - 4 Vehicles available (%)
Vehicles available in owner-occupied houses - 5+ Vehicles available (%)
Vehicles available in renter-occupied houses - no vehicle available (%)
Vehicles available in renter-occupied houses - 1 vehicle available (%)
Vehicles available in renter-occupied houses - 2 Vehicles available (%)
Vehicles available in renter-occupied houses - 3 Vehicles available (%)
Vehicles available in renter-occupied houses - 4 Vehicles available (%)
Vehicles available in renter-occupied houses - 5+ Vehicles available (%)
Housing units in structures - 1, detached (%)
Housing units in structures - 1, attached (%)
Housing units in structures - 2 (%)
Housing units in structures - 3 or 4 (%)
Housing units in structures - 5 to 9 (%)
Housing units in structures - 10 to 19 (%)
Housing units in structures - 20 to 49 (%)
Housing units in structures - 50 or more (%)
Housing units in structures - Mobile home (%)
Housing units in structures - Boat, RV, van, etc. (%)
Housing units in structures - Owners - 1, detached (%)
Housing units in structures - Owners - 1, attached (%)
Housing units in structures - Owners - 2 (%)
Housing units in structures - Owners - 3 or 4 (%)
Housing units in structures - Owners - 5 to 9 (%)
Housing units in structures - Owners - 10 to 19 (%)
Housing units in structures - Owners - 20 to 49 (%)
Housing units in structures - Owners - 50 or more (%)
Housing units in structures - Owners - Mobile home (%)
Housing units in structures - Owners - Boat, RV, van, etc. (%)
Housing units in structures - Renters - 1, detached (%)
Housing units in structures - Renters - 1, attached (%)
Housing units in structures - Renters - 2 (%)
Housing units in structures - Renters - 3 or 4 (%)
Housing units in structures - Renters - 5 to 9 (%)
Housing units in structures - Renters - 10 to 19 (%)
Housing units in structures - Renters - 20 to 49 (%)
Housing units in structures - Renters - 50 or more (%)
Housing units in structures - Renters - Mobile home (%)
Housing units in structures - Renters - Boat, RV, van, etc. (%)
House/condo owner moved in on average (years ago)
Renter moved in on average (years ago)
Year householder moved into unit - Moved in 1999 to March 2000 (%)
Year householder moved into unit - Moved in 1999 to March 2000 (%) - White
Year householder moved into unit - Moved in 1999 to March 2000 (%) - Black or African American
Year householder moved into unit - Moved in 1999 to March 2000 (%) - Asian
Year householder moved into unit - Moved in 1999 to March 2000 (%) - Hispanic or Latino
Year householder moved into unit - Moved in 1999 to March 2000 (%) - American Indian and Alaska Native
Year householder moved into unit - Moved in 1999 to March 2000 (%) - Multirace
Year householder moved into unit - Moved in 1999 to March 2000 (%) - Other Race
Year householder moved into unit - Moved in 1995 to 1998 (%)
Year householder moved into unit - Moved in 1995 to 1998 (%) - White
Year householder moved into unit - Moved in 1995 to 1998 (%) - Black or African American
Year householder moved into unit - Moved in 1995 to 1998 (%) - Asian
Year householder moved into unit - Moved in 1995 to 1998 (%) - Hispanic or Latino
Year householder moved into unit - Moved in 1995 to 1998 (%) - American Indian and Alaska Native
Year householder moved into unit - Moved in 1995 to 1998 (%) - Multirace
Year householder moved into unit - Moved in 1995 to 1998 (%) - Other Race
Year householder moved into unit - Moved in 1990 to 1994 (%)
Year householder moved into unit - Moved in 1990 to 1994 (%) - White
Year householder moved into unit - Moved in 1990 to 1994 (%) - Black or African American
Year householder moved into unit - Moved in 1990 to 1994 (%) - Asian
Year householder moved into unit - Moved in 1990 to 1994 (%) - Hispanic or Latino
Year householder moved into unit - Moved in 1990 to 1994 (%) - American Indian and Alaska Native
Year householder moved into unit - Moved in 1990 to 1994 (%) - Multirace
Year householder moved into unit - Moved in 1990 to 1994 (%) - Other Race
Year householder moved into unit - Moved in 1980 to 1989 (%)
Year householder moved into unit - Moved in 1980 to 1989 (%) - White
Year householder moved into unit - Moved in 1980 to 1989 (%) - Black or African American
Year householder moved into unit - Moved in 1980 to 1989 (%) - Asian
Year householder moved into unit - Moved in 1980 to 1989 (%) - Hispanic or Latino
Year householder moved into unit - Moved in 1980 to 1989 (%) - American Indian and Alaska Native
Year householder moved into unit - Moved in 1980 to 1989 (%) - Multirace
Year householder moved into unit - Moved in 1980 to 1989 (%) - Other Race
Year householder moved into unit - Moved in 1970 to 1979 (%)
Year householder moved into unit - Moved in 1970 to 1979 (%) - White
Year householder moved into unit - Moved in 1970 to 1979 (%) - Black or African American
Year householder moved into unit - Moved in 1970 to 1979 (%) - Asian
Year householder moved into unit - Moved in 1970 to 1979 (%) - Hispanic or Latino
Year householder moved into unit - Moved in 1970 to 1979 (%) - American Indian and Alaska Native
Year householder moved into unit - Moved in 1970 to 1979 (%) - Multirace
Year householder moved into unit - Moved in 1970 to 1979 (%) - Other Race
Year householder moved into unit - Moved in 1969 or earlier (%)
Year householder moved into unit - Moved in 1969 or earlier (%) - White
Year householder moved into unit - Moved in 1969 or earlier (%) - Black or African American
Year householder moved into unit - Moved in 1969 or earlier (%) - Asian
Year householder moved into unit - Moved in 1969 or earlier (%) - Hispanic or Latino
Year householder moved into unit - Moved in 1969 or earlier (%) - American Indian and Alaska Native
Year householder moved into unit - Moved in 1969 or earlier (%) - Multirace
Year householder moved into unit - Moved in 1969 or earlier (%) - Other Race
Housing units lacking complete plumbing facilities (%)
Housing units lacking complete kitchen facilities (%)
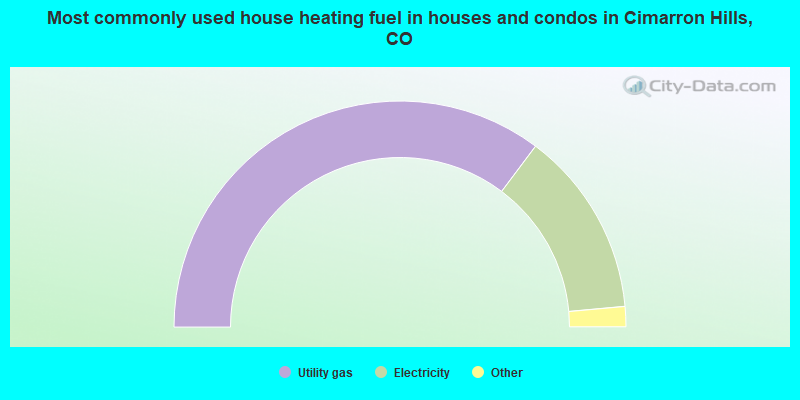
House heating fuel used in houses and condos - Utility gas (%)
House heating fuel used in houses and condos - Bottled, tank, or LP gas (%)
House heating fuel used in houses and condos - Electricity (%)
House heating fuel used in houses and condos - Fuel oil, kerosene, etc. (%)
House heating fuel used in houses and condos - Coal or coke (%)
House heating fuel used in houses and condos - Wood (%)
House heating fuel used in houses and condos - Solar energy (%)
House heating fuel used in houses and condos - Other fuel (%)
House heating fuel used in houses and condos - No fuel used (%)
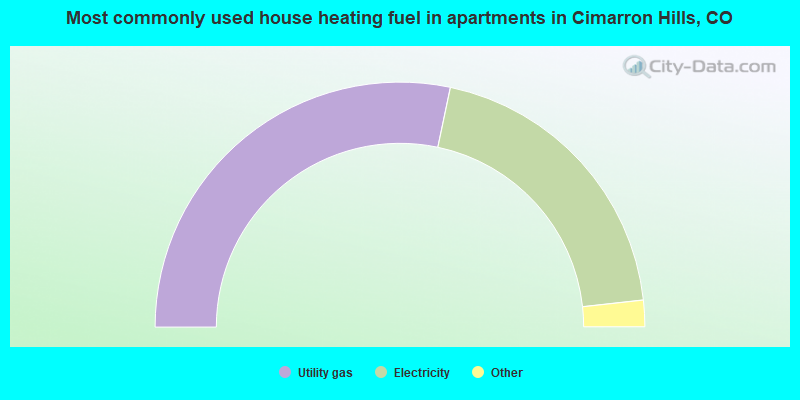
House heating fuel used in apartments - Utility gas (%)
House heating fuel used in apartments - Bottled, tank, or LP gas (%)
House heating fuel used in apartments - Electricity (%)
House heating fuel used in apartments - Fuel oil, kerosene, etc. (%)
House heating fuel used in apartments - Coal or coke (%)
House heating fuel used in apartments - Wood (%)
House heating fuel used in apartments - Solar energy (%)
House heating fuel used in apartments - Other fuel (%)
House heating fuel used in apartments - No fuel used (%)
Median year house/condo built: 1991Median year apartment built: 1985Household type by relationship:
Households: 19,306
Male householders: 3,654 (682 living alone ), Female householders: 3,514 (837 living alone )3,719 spouses (3,683 opposite-sex spouses ), 453 unmarried partners , (419 opposite-sex unmarried partners ), 6,413 children (6,076 natural , 38 adopted , 299 stepchildren ), 169 grandchildren , 244 brothers or sisters , 141 parents , 0 foster children , 196 other relatives , 775 non-relatives In group quarters: 22
Size of family households: 2,045 2-persons , 1,395 3-persons , 1,003 4-persons , 494 5-persons , 222 6-persons , 71 7-or-more-persons .
Size of nonfamily households: 1,627 1-person , 439 2-persons , 86 3-persons , 12 4-persons , 17 5-persons .
3,426 married couples with children. single-parent households (225 men , 829 women ).
86.4% of residents of Cimarron Hills speak English at home. of residents speak Spanish at home (72% speak English very well , 23% speak English well , 4% speak English not well , 1% don't speak English at all ).of residents speak other Indo-European language at home (94% speak English very well , 6% speak English well ).of residents speak Asian or Pacific Island language at home (39% speak English very well , 40% speak English well , 21% speak English not well ).of residents speak other language at home (67% speak English very well , 33% speak English well ).
Foreign born population: 1,178 (6.1%)of them are naturalized citizens )
Median number of rooms in houses and condos:
Median number of rooms in apartments
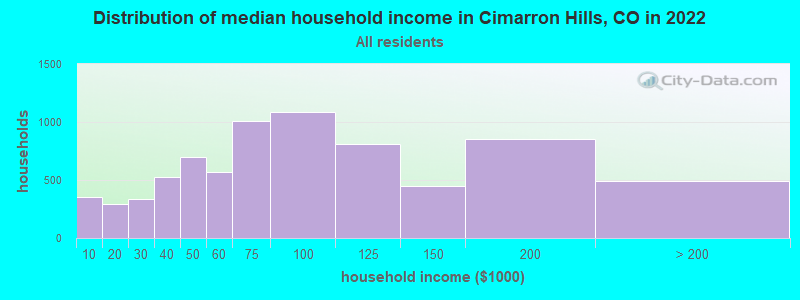
Cimarron Hills, CO household income distribution 353 Less than $10,000297 $10,000 to $19,999333 $20,000 to $29,999529 $30,000 to $39,999694 $40,000 to $49,999573 $50,000 to $59,9991,009 $60,000 to $74,9991,090 $75,000 to $99,999808 $100,000 to $124,999450 $125,000 to $149,999857 $150,000 to $199,999489 $200,000 or more
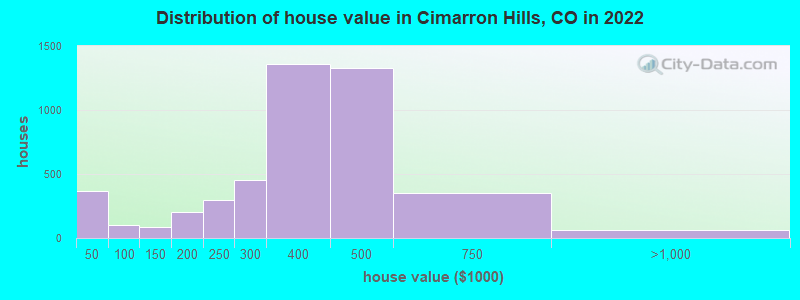
Home value of owner - occupied houses in 2022 in Cimarron Hills, CO 127 Less than $10,00093 $10,000 to $14,99924 $20,000 to $24,99951 $25,000 to $29,99922 $30,000 to $34,99937 $35,000 to $39,99911 $40,000 to $49,99933 $50,000 to $59,9998 $60,000 to $69,99911 $70,000 to $79,99936 $80,000 to $89,99969 $100,000 to $124,99916 $125,000 to $149,99972 $150,000 to $174,999127 $175,000 to $199,999300 $200,000 to $249,999451 $250,000 to $299,9991,359 $300,000 to $399,9991,331 $400,000 to $499,999355 $500,000 to $749,99947 $750,000 to $999,99912 $2,000,000 or moreRent paid by renters in 2022 in Cimarron Hills, CO 159 $100 to $14951 $150 to $19915 $350 to $39941 $450 to $49943 $650 to $69913 $700 to $7494 $750 to $79990 $800 to $899163 $900 to $999544 $1,000 to $1,249141 $1,250 to $1,499305 $1,500 to $1,999144 $2,000 to $2,49965 No cash rent
Percentage of workers working in this county: 96.0%Number of people working at home: 1,051 (10.1% of all workers )
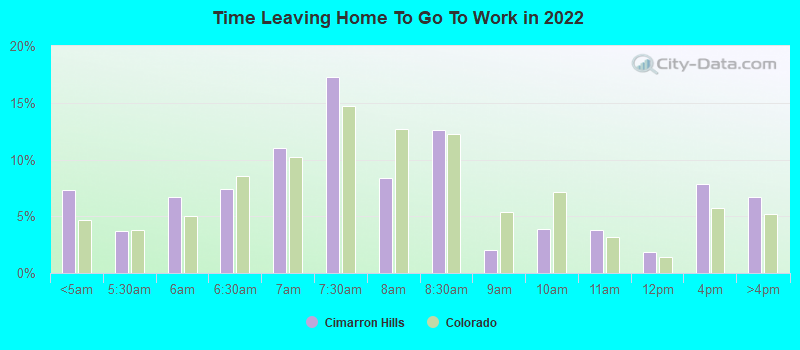
Travel time to work (commute)
Less than 5 minutes: 2505 to 9 minutes: 72810 to 14 minutes: 1,21115 to 19 minutes: 1,38820 to 24 minutes: 1,86525 to 29 minutes: 71330 to 34 minutes: 1,51735 to 39 minutes: 32340 to 44 minutes: 44245 to 59 minutes: 32160 to 89 minutes: 22790 or more minutes: 142
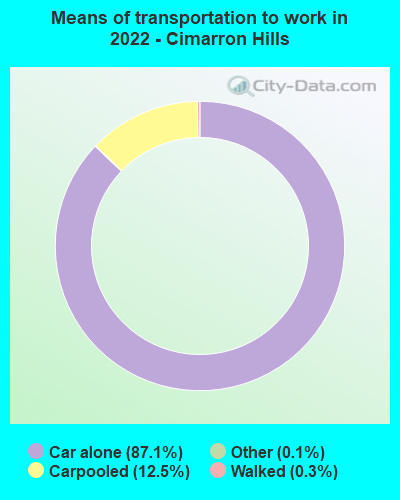
Means of transportation to work:
Drove a car alone: 4,907 (72.4%)Carpooled: 672 (9.9%)Taxi: 7 (0.1%)Walked: 21 (0.3%)Worked at home: 1,051 (15.5%)
Unemployment by race in 2022
Unemployment rate for White non-Hispanic residents 3.9% Males1.7% FemalesUnemployment rate for Black residents 10.1% MalesUnemployment rate for Asian residents 4.9% MalesUnemployment rate for other race residents 5.4% Males11.4% FemalesUnemployment rate for two or more race residents 4.8% Males3.1% FemalesUnemployment rate for Hispanic or Latino residents 6.2% Males13.9% Females
Year of entry for the foreign-born population in Cimarron Hills, Colorado
342 2010 or later 342 2000 to 2009 127 1990 to 1999 231 1980 to 1989 237 1970 to 1979 226 Before 1970
First ancestries reported:
German: 893 (12.8%)
English: 622 (8.9%)
Italian: 570 (8.1%)
European: 492 (7.0%)
Irish: 440 (6.3%)
American: 394 (5.6%)
French: 137 (2.0%)
Scottish: 62 (0.9%)
Latvian: 45 (0.6%)
Norwegian: 38 (0.5%)
Hungarian: 29 (0.4%)
Scotch-Irish: 27 (0.4%)
Ghanaian: 22 (0.3%)
British: 20 (0.3%)
Finnish: 14 (0.2%)
Scandinavian: 14 (0.2%)
Croatian: 13 (0.2%)
French Canadian: 11 (0.2%)
Jamaican: 11 (0.2%)
Slovak: 10 (0.1%)
Swedish: 9 (0.1%)
Portuguese: 7 (0.1%)
Lithuanian: 4 (0.06%)
Welsh: 1 (0.01%) Most common places of birth for foreign-born residents (%): Argentina Cimarron Hills:
18.3% (227)Colorado:
0.6% (3,016)
Philippines Cimarron Hills:
15.3% (189)Colorado:
2.3% (12,342)
Mexico Cimarron Hills:
13.6% (168)Colorado:
38.3% (209,491)
Germany Cimarron Hills:
9.6% (119)Colorado:
2.5% (13,706)
Dominican Republic Cimarron Hills:
7.8% (97)Colorado:
0.4% (2,298)
Korea Cimarron Hills:
3.3% (41)Colorado:
2.9% (15,981)
Brazil Cimarron Hills:
3.1% (39)Colorado:
1.0% (5,365)
Vietnam Cimarron Hills:
2.2% (27)Colorado:
3.0% (16,616)
Latvia Cimarron Hills:
2.1% (26)Colorado:
0.1% (514)
Chile Cimarron Hills:
1.9% (23)Colorado:
0.4% (1,938)
Ghana Cimarron Hills:
1.6% (20)Colorado:
0.7% (3,596)
Japan Cimarron Hills:
1.5% (19)Colorado:
0.7% (4,075)
Other Northern Europe Cimarron Hills:
1.5% (19)Colorado:
0.1% (547)
Place of birth for U.S.-born residents:
This state: 6,931Other state: 10,253Northeast: 1,030Midwest: 2,774South: 3,868West: 2,614 84.1% of Cimarron Hills residents lived in the same house 1 years ago.
Out of people who lived in different houses, 33.2% lived in this county.
Out of people who lived in different counties, 18.4% lived in Colorado.
Cimarron Hills:
84.1%State average:
83.6%
Education attainment for males 25 years and older:
No schooling: 48Nursery to 4th grade: 05th and 6th grade: 127th and 8th grade: 249th grade: 010th grade: 2211th grade: 2712th grade, no diploma: 83High school graduate (or equivalency): 2,243Less than 1 year of college: 524Some college more than 1 year, no degree: 955Associate degree: 652Bachelor's degree: 1,590Master's degree: 458Professional school degree: 13Doctorate degree: 16
Education attainment for females 25 years and older:
No schooling: 48Nursery to 4th grade: 05th and 6th grade: 247th and 8th grade: 09th grade: 1010th grade: 2611th grade: 4012th grade, no diploma: 128High school graduate (or equivalency): 1,258Less than 1 year of college: 791Some college more than 1 year, no degree: 946Associate degree: 696Bachelor's degree: 1,327Master's degree: 461Professional school degree: 52Doctorate degree: 41
Housing units in structures:
One, detached: 5,517One, attached: 491Two: 223 or 4: 6525 to 9: 5110 to 19: 29720 to 49: 19750 or more: 29Mobile homes: 491Median worth of mobile homes: $41,773
Housing units lacking complete plumbing facilities in 2022: 1.6%House/condo owner moved in on average 6 years ago
Renter moved in on average 0 years ago
Private vs. public school enrollment:
Students in private schools in grades 1 to 8 (elementary and middle school): 296 Students in private schools in grades 9 to 12 (high school): 133 Students in private undergraduate colleges: 171