Housing density: 1,728 houses/condos per square mile
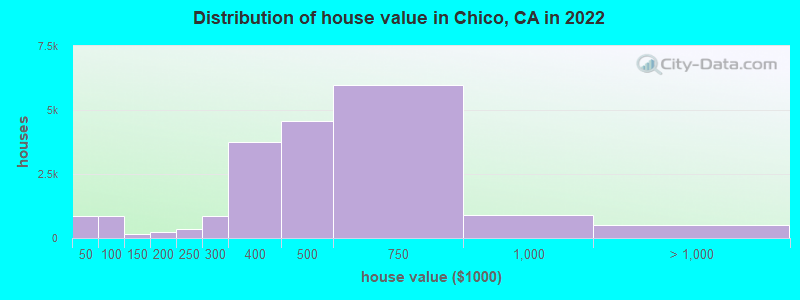
Median price asked for vacant for-sale houses and condos in 2022: $276,987.
Median contract rent in 2022: $1,232 (lower quartile is $979, upper quartile is $1,486)
Median rent asked for vacant for-rent units in 2022: $1,576
Median gross rent in Chico, CA in 2022: $1,404
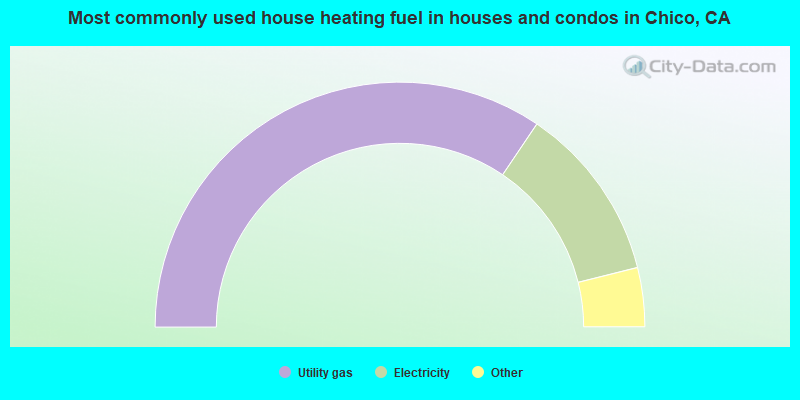
Housing units in Chico with a mortgage: 12,221 (658 second mortgage, 0 home equity loan, 594 both second mortgage and home equity loan) Houses without a mortgage: 201
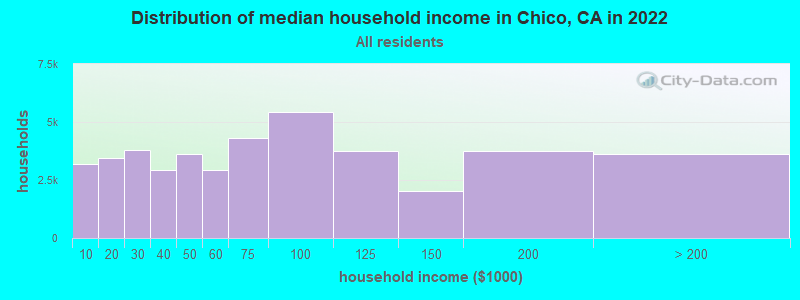
Median household income for houses/condos with a mortgage: $124,295
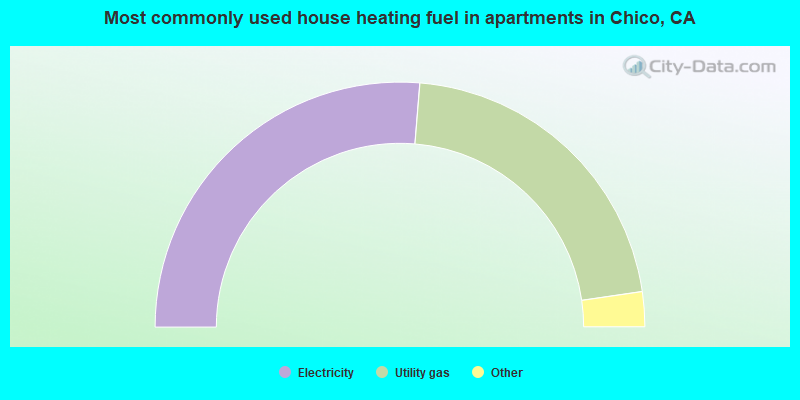
Median household income for apartments without a mortgage: $69,960
11,118 married couples with children.
4,829 single-parent households (1,084 men, 3,745 women).
82.1% of residents of Chico speak English at home.
11.1% of residents speak Spanish at home (74% speak English very well, 10% speak English well, 11% speak English not well, 4% don't speak English at all).
2.2% of residents speak other Indo-European language at home (80% speak English very well, 15% speak English well, 4% speak English not well, 1% don't speak English at all).
3.6% of residents speak Asian or Pacific Island language at home (56% speak English very well, 21% speak English well, 20% speak English not well, 3% don't speak English at all).
0.3% of residents speak other language at home (96% speak English very well, 4% speak English well).
Foreign born population: 8,280 (8.2%)
(59.2% of them are naturalized citizens)
Percentage of workers working in this county: 90.0% Number of people working at home: 7,580 (14.5% of all workers)
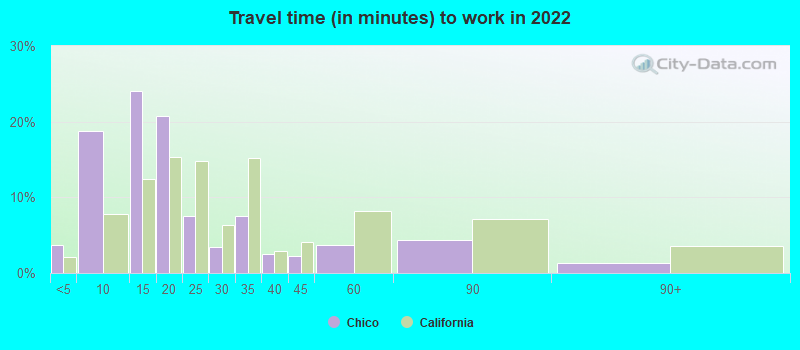
Travel time to work (commute)
Less than 5 minutes: 1,759
5 to 9 minutes: 9,002
10 to 14 minutes: 11,450
15 to 19 minutes: 9,182
20 to 24 minutes: 2,493
25 to 29 minutes: 1,672
30 to 34 minutes: 3,751
35 to 39 minutes: 621
40 to 44 minutes: 500
45 to 59 minutes: 1,484
60 to 89 minutes: 2,499
90 or more minutes: 296
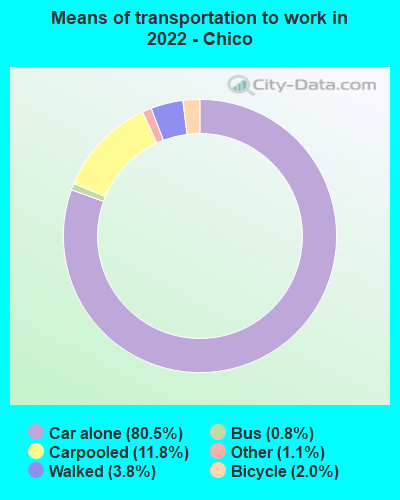
Means of transportation to work:
Drove a car alone: 38,236 (70.4%)
Carpooled: 5,775 (10.6%)
Bus: 179 (0.3%)
Long-distance train or commuter rail: 17 (0.0%)
Taxi: 425 (0.8%)
Bicycle: 656 (1.2%)
Walked: 2,096 (3.9%)
Worked at home: 6,843 (12.6%)
Unemployment by race in 2022
Unemployment rate for White non-Hispanic residents
6.4%Males
2.6%Females
Unemployment rate for Black residents
5.7%Males
5.6%Females
Unemployment rate for American Indian and Alaska Native residents
2.6%Females
Unemployment rate for Asian residents
0.4%Males
6.5%Females
Unemployment rate for other race residents
8.6%Males
6.3%Females
Unemployment rate for two or more race residents
4.9%Males
2.8%Females
Unemployment rate for Hispanic or Latino residents
6.1%Males
9.0%Females
Year of entry for the foreign-born population in Chico, California
2,2892010 or later
1,6112000 to 2009
1,7091990 to 1999
1,6721980 to 1989
5831970 to 1979
656Before 1970
First ancestries reported:
American: 3,046 (7.7%)
German: 2,961 (7.5%)
English: 2,930 (7.4%)
European: 2,172 (5.5%)
Irish: 1,764 (4.5%)
Italian: 1,390 (3.5%)
Scottish: 784 (2.0%)
Portuguese: 557 (1.4%)
Norwegian: 549 (1.4%)
Swedish: 336 (0.8%)
Polish: 324 (0.8%)
Scotch-Irish: 306 (0.8%)
Canadian: 280 (0.7%)
French: 263 (0.7%)
Northern European: 262 (0.7%)
Russian: 245 (0.6%)
Croatian: 218 (0.6%)
Dutch: 191 (0.5%)
Danish: 184 (0.5%)
Ukrainian: 153 (0.4%)
Iranian: 97 (0.2%)
Australian: 85 (0.2%)
African: 72 (0.2%)
Czech: 70 (0.2%)
Czechoslovakian: 69 (0.2%)
Welsh: 68 (0.2%)
Israeli: 68 (0.2%)
Romanian: 58 (0.1%)
French Canadian: 57 (0.1%)
Armenian: 56 (0.1%)
Scandinavian: 55 (0.1%)
Cajun: 53 (0.1%)
Hungarian: 52 (0.1%)
Arab: 48 (0.1%)
Swiss: 48 (0.1%)
British: 40 (0.1%)
Basque: 37 (0.09%)
Eastern European: 32 (0.08%)
Greek: 32 (0.08%)
Nigerian: 27 (0.07%)
Austrian: 27 (0.07%)
Serbian: 24 (0.06%)
South African: 23 (0.06%)
Brazilian: 22 (0.06%)
Lebanese: 21 (0.05%)
Finnish: 19 (0.05%)
Latvian: 19 (0.05%)
Slovak: 19 (0.05%)
Lithuanian: 17 (0.04%)
Palestinian: 16 (0.04%)
Icelander: 14 (0.04%)
Yugoslavian: 12 (0.03%)
Syrian: 12 (0.03%)
Belgian: 11 (0.03%)
Egyptian: 7 (0.02%)
Ethiopian: 5 (0.01%)
Slovene: 4 (0.01%)
Turkish: 2 (0.01%)
Most common places of birth for foreign-born residents (%):
Mexico
Chico:
34.0% (2,733)
California:
37.2% (3,881,193)
China, excluding Hong Kong and Taiwan
Chico:
8.0% (644)
California:
6.6% (684,672)
Thailand
Chico:
5.7% (459)
California:
0.6% (65,335)
India
Chico:
3.9% (310)
California:
5.2% (539,184)
Canada
Chico:
3.8% (303)
California:
1.2% (127,477)
Laos
Chico:
3.4% (271)
California:
0.5% (48,911)
El Salvador
Chico:
2.8% (229)
California:
4.2% (440,287)
Russia
Chico:
2.7% (216)
California:
0.7% (71,932)
Vietnam
Chico:
2.7% (214)
California:
4.9% (512,335)
Philippines
Chico:
2.6% (213)
California:
7.8% (818,297)
Korea
Chico:
2.1% (171)
California:
3.0% (315,248)
Germany
Chico:
2.0% (159)
California:
0.7% (73,304)
Iran
Chico:
1.9% (156)
California:
2.0% (206,004)
Taiwan
Chico:
1.6% (132)
California:
1.7% (176,274)
Kuwait
Chico:
1.6% (129)
California:
0.1% (6,353)
Place of birth for U.S.-born residents:
This state: 76,341
Other state: 16,253
Northeast: 2,894
Midwest: 4,059
South: 3,076
West: 6,224
76.5% of Chico residents lived in the same house 1 years ago. Out of people who lived in different houses, 37.1% lived in this county. Out of people who lived in different counties, 88.7% lived in California.
Chico:
76.5%
State average:
88.9%
Education attainment for males 25 years and older:
No schooling: 266
Nursery to 4th grade: 0
5th and 6th grade: 236
7th and 8th grade: 13
9th grade: 0
10th grade: 246
11th grade: 146
12th grade, no diploma: 296
High school graduate (or equivalency): 4,707
Less than 1 year of college: 1,835
Some college more than 1 year, no degree: 5,801
Associate degree: 3,553
Bachelor's degree: 8,878
Master's degree: 2,707
Professional school degree: 748
Doctorate degree: 849
Education attainment for females 25 years and older:
No schooling: 514
Nursery to 4th grade: 0
5th and 6th grade: 122
7th and 8th grade: 83
9th grade: 248
10th grade: 154
11th grade: 454
12th grade, no diploma: 440
High school graduate (or equivalency): 4,005
Less than 1 year of college: 2,212
Some college more than 1 year, no degree: 4,606
Associate degree: 3,980
Bachelor's degree: 8,944
Master's degree: 3,874
Professional school degree: 1,440
Doctorate degree: 803
Housing units in structures:
One, detached: 25,637
One, attached: 2,639
Two: 1,808
3 or 4: 4,865
5 to 9: 4,192
10 to 19: 2,549
20 to 49: 1,592
50 or more: 3,061
Mobile homes: 1,506
Boats, RVs, vans, etc.: 81
Median worth of mobile homes: $84,800
Housing units lacking complete plumbing facilities in 2022: 0.2%
Housing units lacking complete kitchen facilities in 2022: 0.6%