Chicago Ridge, IL (Illinois) Houses and Residents
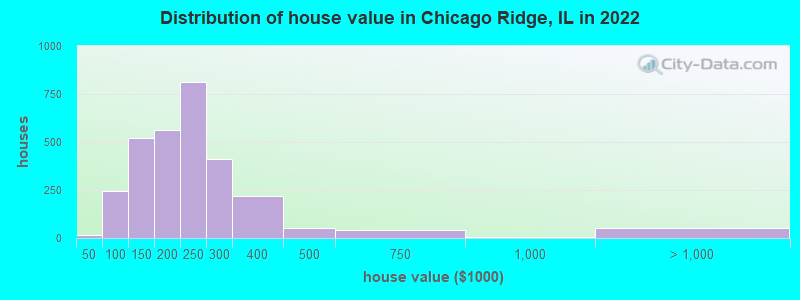
Estimated median house or condo value in 2022: $208,630 (it was $123,200 in 2000 )
Chicago Ridge:
$208,630Illinois:
$251,600
Lower value quartile - upper value quartile: $143,514 - $247,694Total population: 14,434 (Urban population: 13,878, Rural population: 0)
Houses: 5,719 (5,273 occupied: 3,106 owner occupied, 2,257 renter occupied )
% of renters here:
42%State:
33%
Housing density: 2,565 houses/condos per square mile
Median price asked for vacant for-sale houses and condos in 2022: $221,808.
Median contract rent in 2022: $1,070 (lower quartile is $916, upper quartile is $1,213)
Median rent asked for vacant for-rent units in 2022: $874
Median gross rent in Chicago Ridge, IL in 2022: $1,155
Housing units in Chicago Ridge with a mortgage: 2,002 (63 second mortgage, 0 home equity loan, 46 both second mortgage and home equity loan )Houses without a mortgage: 283
Median household income for houses/condos with a mortgage: $96,771
Median household income for apartments without a mortgage: $60,817
Median monthly housing costs: $1,174
Data:
Median house or condo value ($)
Median house or condo value ($ change since 2000)
Median house or condo value ($) - White
Median house or condo value ($) - Black or African American
Median house or condo value ($) - Asian
Median house or condo value ($) - Hispanic or Latino
Median house or condo value ($) - American Indian and Alaska Native
Median house or condo value ($) - Multirace
Median house or condo value ($) - Other Race
Median price asked for mobile homes ($)
Household density (households per square mile)
Mean house or condo value by units in structure - 1, detached ($)
Mean house or condo value by units in structure - 1, attached ($)
Mean house or condo value by units in structure - 2 ($)
Mean house or condo value by units in structure by units in structure - 3 or 4 ($)
Mean house or condo value by units in structure - 5 or more ($)
Mean house or condo value by units in structure - Boat, RV, van, etc. ($)
Mean house or condo value by units in structure - Mobile home ($)
Median contract rent ($)
Median contract rent - Lower quartile ($)
Median contract rent - Upper quartile ($)
Median gross rent ($)
Urban houses (%)
Rural houses (%)
Houses occupied (%)
Houses occupied (% change since 2000)
Houses owner occupied (%)
Houses owner occupied (% change since 2000)
Houses renter occupied (%)
Houses renter occupied (% change since 2000)
Vacant housing units - For rent (%)
Vacant housing units - For rent (% change since 2000)
Vacant housing units - For sale only (%)
Vacant housing units - For sale only (% change since 2000)
Vacant housing units - Rented or sold, not occupied (%)
Vacant housing units - Rented or sold, not occupied (% change since 2000)
Vacant housing units - For seasonal, recreational, or occasional use (%)
Vacant housing units - For seasonal, recreational, or occasional use (% change since 2000)
Vacant housing units - For migrant workers (%)
Vacant housing units - For migrant workers (% change since 2000)
Vacant housing units - Other vacant (%)
Vacant housing units - Other vacant (% change since 2000)
Median monthly housing costs ($)
Median household income for houses/condos with a mortgage ($)
Median household income for houses/condos without a mortgage ($)
Median household income ($)
Median household income ($) - White
Median household income ($) - Black or African American
Median household income ($) - Asian
Median household income ($) - Hispanic or Latino
Median household income ($) - American Indian and Alaska Native
Median household income ($) - Multirace
Median household income ($) - Other Race
Mortgage status - with mortgage (%)
Mortgage status - with second mortgage (%)
Mortgage status - with home equity loan (%)
Mortgage status - with both second mortgage and home equity loan (%)
Mortgage status - without a mortgage (%)
Median year house/condo built
Median year apartment built
Household type by relationship - Male householder living alone (%)
Household type by relationship - Male householder not living alone (%)
Household type by relationship - Female householder living alone (%)
Household type by relationship - Female householder not living alone (%)
Household type by relationship - Opposite-Sex spouse (%)
Household type by relationship - Same-Sex spouse (%)
Household type by relationship - Opposite-Sex unmarried partner (%)
Household type by relationship - Same-Sex unmarried partner (%)
Household type by relationship - In group quarters (%)
Size of family households - 2-person household (%)
Size of family households - 3-person household (%)
Size of family households - 4-person household (%)
Size of family households - 5-person household (%)
Size of family households - 6-person household (%)
Size of family households - 7-or-more-person household (%)
Size of nonfamily households - 1-person household (%)
Size of nonfamily households - 2-person household (%)
Size of nonfamily households - 3-person household (%)
Size of nonfamily households - 4-person household (%)
Size of nonfamily households - 5-person household (%)
Size of nonfamily households - 6-person household (%)
Size of nonfamily households - 7-or-moreperson household (%)
Year house built - Built 2010 or later (%)
Year house built - Built 2000 to 2009 (%)
Year house built - Built 1990 to 1999 (%)
Year house built - Built 1980 to 1989 (%)
Year house built - Built 1970 to 1979 (%)
Year house built - Built 1960 to 1969 (%)
Year house built - Built 1950 to 1959 (%)
Year house built - Built 1940 to 1949 (%)
Year house built - Built 1939 or earlier (%)
Median number of rooms in houses and condos
Median number of rooms in apartments
Median number of bedrooms in owner occupied houses
Mean number of bedrooms in owner occupied houses
Median number of bedrooms in renter occupied houses
Mean number of bedrooms in renter occupied houses
Median number of vehichles in owner occupied houses
Mean number of vehichles in owner occupied houses
Median number of vehichles in renter occupied houses
Mean number of vehichles in renter occupied houses
Rooms in owner-occupied houses - 1 room (%)
Rooms in owner-occupied houses - 2 rooms (%)
Rooms in owner-occupied houses - 3 rooms (%)
Rooms in owner-occupied houses - 4 rooms (%)
Rooms in owner-occupied houses - 5 rooms (%)
Rooms in owner-occupied houses - 6 rooms (%)
Rooms in owner-occupied houses - 7 rooms (%)
Rooms in owner-occupied houses - 8 rooms (%)
Rooms in owner-occupied houses - 9+ rooms (%)
Rooms in renter-occupied houses - 1 room (%)
Rooms in renter-occupied houses - 2 rooms (%)
Rooms in renter-occupied houses - 3 rooms (%)
Rooms in renter-occupied houses - 4 rooms (%)
Rooms in renter-occupied houses - 5 rooms (%)
Rooms in renter-occupied houses - 6 rooms (%)
Rooms in renter-occupied houses - 7 rooms (%)
Rooms in renter-occupied houses - 8 rooms (%)
Rooms in renter-occupied houses - 9+ rooms (%)
Bedrooms in owner-occupied houses - no bedrooms (%)
Bedrooms in owner-occupied houses - 1 bedroom (%)
Bedrooms in owner-occupied houses - 2 bedrooms (%)
Bedrooms in owner-occupied houses - 3 bedrooms (%)
Bedrooms in owner-occupied houses - 4 bedrooms (%)
Bedrooms in owner-occupied houses - 5+ bedrooms (%)
Bedrooms in renter-occupied houses - no bedrooms (%)
Bedrooms in renter-occupied houses - 1 bedroom (%)
Bedrooms in renter-occupied houses - 2 bedrooms (%)
Bedrooms in renter-occupied houses - 3 bedrooms (%)
Bedrooms in renter-occupied houses - 4 bedrooms (%)
Bedrooms in renter-occupied houses - 5+ bedrooms (%)
Vehicles available in owner-occupied houses - no vehicle available (%)
Vehicles available in owner-occupied houses - 1 vehicle available(%)
Vehicles available in owner-occupied houses - 2 Vehicles available (%)
Vehicles available in owner-occupied houses - 3 Vehicles available (%)
Vehicles available in owner-occupied houses - 4 Vehicles available (%)
Vehicles available in owner-occupied houses - 5+ Vehicles available (%)
Vehicles available in renter-occupied houses - no vehicle available (%)
Vehicles available in renter-occupied houses - 1 vehicle available (%)
Vehicles available in renter-occupied houses - 2 Vehicles available (%)
Vehicles available in renter-occupied houses - 3 Vehicles available (%)
Vehicles available in renter-occupied houses - 4 Vehicles available (%)
Vehicles available in renter-occupied houses - 5+ Vehicles available (%)
Housing units in structures - 1, detached (%)
Housing units in structures - 1, attached (%)
Housing units in structures - 2 (%)
Housing units in structures - 3 or 4 (%)
Housing units in structures - 5 to 9 (%)
Housing units in structures - 10 to 19 (%)
Housing units in structures - 20 to 49 (%)
Housing units in structures - 50 or more (%)
Housing units in structures - Mobile home (%)
Housing units in structures - Boat, RV, van, etc. (%)
Housing units in structures - Owners - 1, detached (%)
Housing units in structures - Owners - 1, attached (%)
Housing units in structures - Owners - 2 (%)
Housing units in structures - Owners - 3 or 4 (%)
Housing units in structures - Owners - 5 to 9 (%)
Housing units in structures - Owners - 10 to 19 (%)
Housing units in structures - Owners - 20 to 49 (%)
Housing units in structures - Owners - 50 or more (%)
Housing units in structures - Owners - Mobile home (%)
Housing units in structures - Owners - Boat, RV, van, etc. (%)
Housing units in structures - Renters - 1, detached (%)
Housing units in structures - Renters - 1, attached (%)
Housing units in structures - Renters - 2 (%)
Housing units in structures - Renters - 3 or 4 (%)
Housing units in structures - Renters - 5 to 9 (%)
Housing units in structures - Renters - 10 to 19 (%)
Housing units in structures - Renters - 20 to 49 (%)
Housing units in structures - Renters - 50 or more (%)
Housing units in structures - Renters - Mobile home (%)
Housing units in structures - Renters - Boat, RV, van, etc. (%)
House/condo owner moved in on average (years ago)
Renter moved in on average (years ago)
Year householder moved into unit - Moved in 1999 to March 2000 (%)
Year householder moved into unit - Moved in 1999 to March 2000 (%) - White
Year householder moved into unit - Moved in 1999 to March 2000 (%) - Black or African American
Year householder moved into unit - Moved in 1999 to March 2000 (%) - Asian
Year householder moved into unit - Moved in 1999 to March 2000 (%) - Hispanic or Latino
Year householder moved into unit - Moved in 1999 to March 2000 (%) - American Indian and Alaska Native
Year householder moved into unit - Moved in 1999 to March 2000 (%) - Multirace
Year householder moved into unit - Moved in 1999 to March 2000 (%) - Other Race
Year householder moved into unit - Moved in 1995 to 1998 (%)
Year householder moved into unit - Moved in 1995 to 1998 (%) - White
Year householder moved into unit - Moved in 1995 to 1998 (%) - Black or African American
Year householder moved into unit - Moved in 1995 to 1998 (%) - Asian
Year householder moved into unit - Moved in 1995 to 1998 (%) - Hispanic or Latino
Year householder moved into unit - Moved in 1995 to 1998 (%) - American Indian and Alaska Native
Year householder moved into unit - Moved in 1995 to 1998 (%) - Multirace
Year householder moved into unit - Moved in 1995 to 1998 (%) - Other Race
Year householder moved into unit - Moved in 1990 to 1994 (%)
Year householder moved into unit - Moved in 1990 to 1994 (%) - White
Year householder moved into unit - Moved in 1990 to 1994 (%) - Black or African American
Year householder moved into unit - Moved in 1990 to 1994 (%) - Asian
Year householder moved into unit - Moved in 1990 to 1994 (%) - Hispanic or Latino
Year householder moved into unit - Moved in 1990 to 1994 (%) - American Indian and Alaska Native
Year householder moved into unit - Moved in 1990 to 1994 (%) - Multirace
Year householder moved into unit - Moved in 1990 to 1994 (%) - Other Race
Year householder moved into unit - Moved in 1980 to 1989 (%)
Year householder moved into unit - Moved in 1980 to 1989 (%) - White
Year householder moved into unit - Moved in 1980 to 1989 (%) - Black or African American
Year householder moved into unit - Moved in 1980 to 1989 (%) - Asian
Year householder moved into unit - Moved in 1980 to 1989 (%) - Hispanic or Latino
Year householder moved into unit - Moved in 1980 to 1989 (%) - American Indian and Alaska Native
Year householder moved into unit - Moved in 1980 to 1989 (%) - Multirace
Year householder moved into unit - Moved in 1980 to 1989 (%) - Other Race
Year householder moved into unit - Moved in 1970 to 1979 (%)
Year householder moved into unit - Moved in 1970 to 1979 (%) - White
Year householder moved into unit - Moved in 1970 to 1979 (%) - Black or African American
Year householder moved into unit - Moved in 1970 to 1979 (%) - Asian
Year householder moved into unit - Moved in 1970 to 1979 (%) - Hispanic or Latino
Year householder moved into unit - Moved in 1970 to 1979 (%) - American Indian and Alaska Native
Year householder moved into unit - Moved in 1970 to 1979 (%) - Multirace
Year householder moved into unit - Moved in 1970 to 1979 (%) - Other Race
Year householder moved into unit - Moved in 1969 or earlier (%)
Year householder moved into unit - Moved in 1969 or earlier (%) - White
Year householder moved into unit - Moved in 1969 or earlier (%) - Black or African American
Year householder moved into unit - Moved in 1969 or earlier (%) - Asian
Year householder moved into unit - Moved in 1969 or earlier (%) - Hispanic or Latino
Year householder moved into unit - Moved in 1969 or earlier (%) - American Indian and Alaska Native
Year householder moved into unit - Moved in 1969 or earlier (%) - Multirace
Year householder moved into unit - Moved in 1969 or earlier (%) - Other Race
Housing units lacking complete plumbing facilities (%)
Housing units lacking complete kitchen facilities (%)
House heating fuel used in houses and condos - Utility gas (%)
House heating fuel used in houses and condos - Bottled, tank, or LP gas (%)
House heating fuel used in houses and condos - Electricity (%)
House heating fuel used in houses and condos - Fuel oil, kerosene, etc. (%)
House heating fuel used in houses and condos - Coal or coke (%)
House heating fuel used in houses and condos - Wood (%)
House heating fuel used in houses and condos - Solar energy (%)
House heating fuel used in houses and condos - Other fuel (%)
House heating fuel used in houses and condos - No fuel used (%)
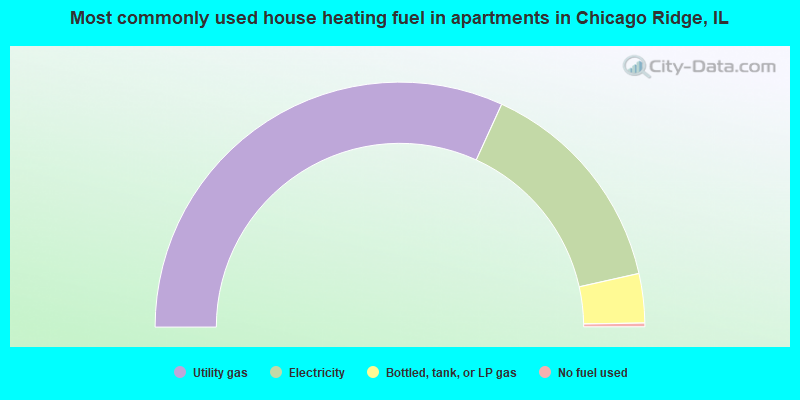
House heating fuel used in apartments - Utility gas (%)
House heating fuel used in apartments - Bottled, tank, or LP gas (%)
House heating fuel used in apartments - Electricity (%)
House heating fuel used in apartments - Fuel oil, kerosene, etc. (%)
House heating fuel used in apartments - Coal or coke (%)
House heating fuel used in apartments - Wood (%)
House heating fuel used in apartments - Solar energy (%)
House heating fuel used in apartments - Other fuel (%)
House heating fuel used in apartments - No fuel used (%)
Median year house/condo built: 1967Median year apartment built: 1980Household type by relationship:
Households: 13,966
Male householders: 2,871 (853 living alone ), Female householders: 2,262 (857 living alone )2,346 spouses (2,346 opposite-sex spouses ), 261 unmarried partners , (261 opposite-sex unmarried partners ), 4,705 children (4,475 natural , 42 adopted , 187 stepchildren ), 169 grandchildren , 188 brothers or sisters , 445 parents , 0 foster children , 163 other relatives , 136 non-relatives In group quarters: 415
Size of family households: 1,273 2-persons , 720 3-persons , 675 4-persons , 443 5-persons , 136 6-persons , 73 7-or-more-persons .
Size of nonfamily households: 1,838 1-person , 169 2-persons , 3 3-persons .
2,277 married couples with children. single-parent households (89 men , 403 women ).
58.4% of residents of Chicago Ridge speak English at home. of residents speak Spanish at home (82% speak English very well , 10% speak English well , 5% speak English not well , 3% don't speak English at all ).of residents speak other Indo-European language at home (58% speak English very well , 18% speak English well , 23% speak English not well , 1% don't speak English at all ).of residents speak Asian or Pacific Island language at home (56% speak English very well , 13% speak English well , 29% speak English not well , 1% don't speak English at all ).of residents speak other language at home (37% speak English very well , 48% speak English well , 12% speak English not well , 3% don't speak English at all ).
Foreign born population: 3,433 (24.6%)of them are naturalized citizens )
Median number of rooms in houses and condos:
Median number of rooms in apartments
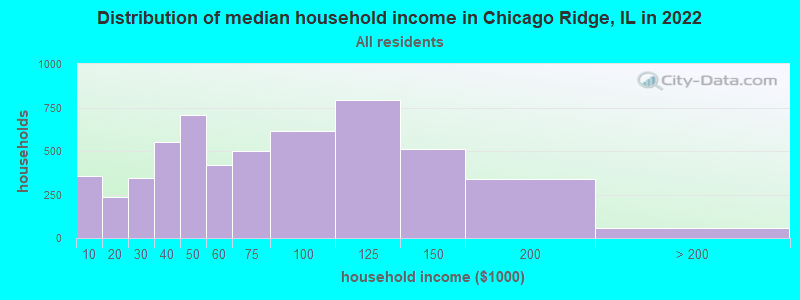
Chicago Ridge, IL household income distribution 354 Less than $10,000236 $10,000 to $19,999342 $20,000 to $29,999551 $30,000 to $39,999706 $40,000 to $49,999422 $50,000 to $59,999498 $60,000 to $74,999615 $75,000 to $99,999795 $100,000 to $124,999511 $125,000 to $149,999339 $150,000 to $199,99955 $200,000 or more
Home value of owner - occupied houses in 2022 in Chicago Ridge, IL 16 Less than $10,00011 $50,000 to $59,99916 $60,000 to $69,99999 $70,000 to $79,99946 $80,000 to $89,99969 $90,000 to $99,999292 $100,000 to $124,999229 $125,000 to $149,999389 $150,000 to $174,999171 $175,000 to $199,999812 $200,000 to $249,999409 $250,000 to $299,999220 $300,000 to $399,99950 $400,000 to $499,99942 $500,000 to $749,9993 $750,000 to $999,99954 $2,000,000 or moreRent paid by renters in 2022 in Chicago Ridge, IL 25 $100 to $14951 $200 to $24925 $300 to $34957 $350 to $39919 $400 to $44922 $600 to $64954 $700 to $74972 $750 to $799177 $800 to $899262 $900 to $999999 $1,000 to $1,249236 $1,250 to $1,499152 $1,500 to $1,999139 No cash rent
Percentage of workers working in this county: 83.9%Number of people working at home: 616 (9.0% of all workers )
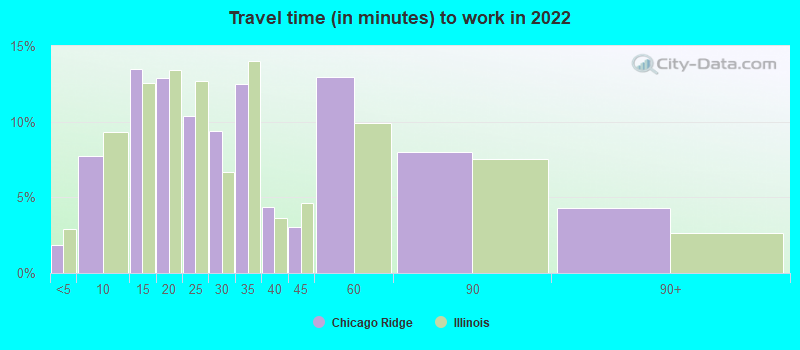
Travel time to work (commute)
Less than 5 minutes: 1365 to 9 minutes: 31510 to 14 minutes: 47315 to 19 minutes: 77920 to 24 minutes: 60925 to 29 minutes: 30130 to 34 minutes: 1,35335 to 39 minutes: 13140 to 44 minutes: 43545 to 59 minutes: 67560 to 89 minutes: 66690 or more minutes: 123
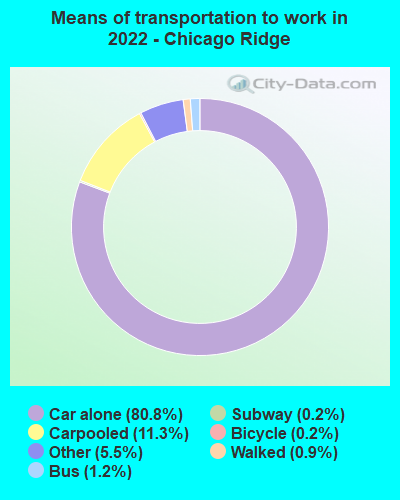
Means of transportation to work:
Drove a car alone: 3,522 (71.1%)Carpooled: 525 (10.6%)Bus : 48 (1.0%)Long-distance train or commuter rail : 4 (0.1%)Taxi: 240 (4.8%)Bicycle: 10 (0.2%)Walked: 39 (0.8%)Worked at home: 616 (12.4%)
Unemployment by race in 2022
Unemployment rate for White non-Hispanic residents 1.4% Males2.2% FemalesUnemployment rate for Black residents 25.2% MalesUnemployment rate for American Indian and Alaska Native residents 100.0% MalesUnemployment rate for two or more race residents 10.3% Males6.2% FemalesUnemployment rate for Hispanic or Latino residents 1.7% Males1.3% Females
Year of entry for the foreign-born population in Chicago Ridge, Illinois
1,034 2010 or later 929 2000 to 2009 659 1990 to 1999 473 1980 to 1989 236 1970 to 1979 280 Before 1970
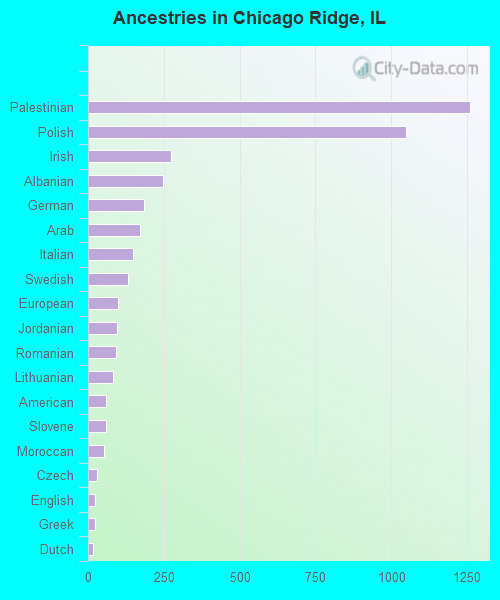
First ancestries reported:
Palestinian: 1,260 (18.0%)
Polish: 1,050 (15.0%)
Irish: 274 (3.9%)
Albanian: 249 (3.6%)
German: 185 (2.6%)
Arab: 172 (2.5%)
Italian: 148 (2.1%)
Swedish: 133 (1.9%)
European: 100 (1.4%)
Jordanian: 96 (1.4%)
Romanian: 91 (1.3%)
Lithuanian: 82 (1.2%)
American: 61 (0.9%)
Slovene: 61 (0.9%)
Moroccan: 53 (0.8%)
Czech: 30 (0.4%)
English: 23 (0.3%)
Greek: 23 (0.3%)
Dutch: 15 (0.2%)
Ukrainian: 5 (0.07%) Most common places of birth for foreign-born residents (%): Poland Chicago Ridge:
18.4% (631)Illinois:
6.9% (124,474)
Philippines Chicago Ridge:
16.8% (576)Illinois:
5.2% (93,003)
Asia, n.e.c. Chicago Ridge:
12.0% (413)Illinois:
0.4% (7,117)
Jordan Chicago Ridge:
11.8% (405)Illinois:
0.5% (8,827)
Mexico Chicago Ridge:
8.5% (293)Illinois:
34.7% (626,958)
Yemen Chicago Ridge:
5.4% (187)Illinois:
0.1% (1,771)
Saudi Arabia Chicago Ridge:
4.7% (163)Illinois:
0.2% (3,363)
Kuwait Chicago Ridge:
2.7% (93)Illinois:
0.1% (1,630)
Romania Chicago Ridge:
2.3% (79)Illinois:
0.8% (14,736)
Iraq Chicago Ridge:
2.2% (76)Illinois:
0.7% (13,214)
Lithuania Chicago Ridge:
2.2% (74)Illinois:
0.6% (10,249)
Place of birth for U.S.-born residents:
This state: 9,523Other state: 723Northeast: 81Midwest: 205South: 296West: 129 93.5% of Chicago Ridge residents lived in the same house 1 years ago.
Out of people who lived in different houses, 47.3% lived in this county.
Out of people who lived in different counties, 60.9% lived in Illinois.
Chicago Ridge:
93.5%State average:
88.3%
Education attainment for males 25 years and older:
No schooling: 57Nursery to 4th grade: 405th and 6th grade: 07th and 8th grade: 279th grade: 1310th grade: 9211th grade: 5812th grade, no diploma: 160High school graduate (or equivalency): 1,600Less than 1 year of college: 377Some college more than 1 year, no degree: 725Associate degree: 390Bachelor's degree: 1,118Master's degree: 139Professional school degree: 16Doctorate degree: 16
Education attainment for females 25 years and older:
No schooling: 140Nursery to 4th grade: 355th and 6th grade: 87th and 8th grade: 89th grade: 1910th grade: 1811th grade: 1412th grade, no diploma: 160High school graduate (or equivalency): 1,056Less than 1 year of college: 343Some college more than 1 year, no degree: 984Associate degree: 673Bachelor's degree: 851Master's degree: 275Professional school degree: 29Doctorate degree: 137
Housing units in structures:
One, detached: 2,154One, attached: 148Two: 803 or 4: 1575 to 9: 1,49410 to 19: 1,31520 to 49: 24050 or more: 128Housing units lacking complete kitchen facilities in 2022: 1.7%House/condo owner moved in on average 12 years ago
Renter moved in on average 2 years ago
Private vs. public school enrollment:
Students in private schools in grades 1 to 8 (elementary and middle school): 42 Students in private schools in grades 9 to 12 (high school): 273 Students in private undergraduate colleges: 197