Charlotte, NC (North Carolina) Houses and Residents
| Charlotte: | $385,600 |
| North Carolina: | $280,600 |
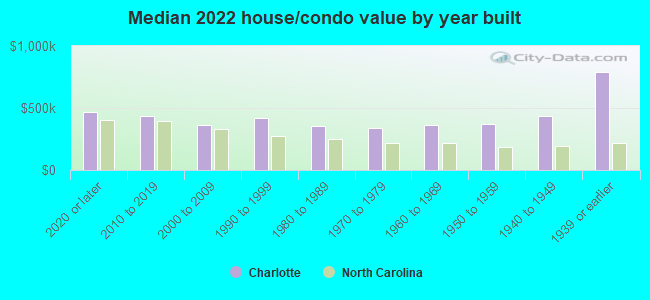
Mean price in 2022:
Detached houses: $527,854
Here: $527,854 State: $375,326 Townhouses or other attached units: $374,002
Here: $374,002 State: $317,935 In 2-unit structures: $235,219
Here: $235,219 State: $250,488 In 3-to-4-unit structures: $348,752
Here: $348,752 State: $254,939 In 5-or-more-unit structures: $394,427
Here: $394,427 State: $329,290 Mobile homes: $64,461
Here: $64,461 State: $124,933
Total population: 809,958 (Urban population: 541,137, Rural population: 994 (all nonfarm))
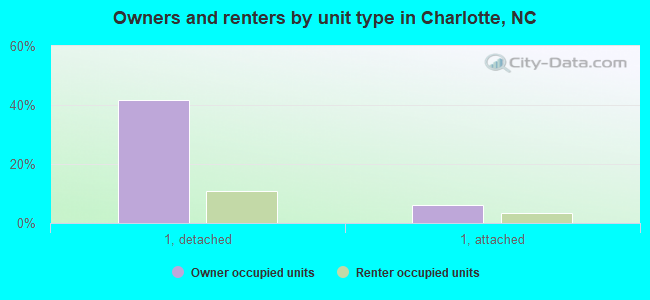
Houses: 406,055 (378,089 occupied: 192,091 owner occupied, 185,998 renter occupied)
| % of renters here: | 49% |
| State: | 33% |
Housing density: 1,676 houses/condos per square mile
Median price asked for vacant for-sale houses and condos in 2022: $481,419.
Median contract rent in 2022: $1,334 (lower quartile is $1,006, upper quartile is $1,705)
Median rent asked for vacant for-rent units in 2022: $1,463
Median gross rent in Charlotte, NC in 2022: $1,463
Housing units in Charlotte with a mortgage: 143,793 (14,553 second mortgage, 315 home equity loan, 13,005 both second mortgage and home equity loan)
Houses without a mortgage: 2,888
Median household income for houses/condos with a mortgage: $117,646
Median household income for apartments without a mortgage: $76,267
Median monthly housing costs: $1,436
Compare current foreclosures in Charlotte, NC:
| Photo | Address | Area | Beds / Baths | Price | Details |
|---|---|---|---|---|---|

|
#1
Landover Rd
Charlotte, NC 28278
|
1,524 sq. feet
|
2 baths 3 beds |
show details | |

|
#2
S Cloudman St
Charlotte, NC 28208
|
1,152 sq. feet
|
2 baths 4 beds |
show details | |

|
#3
Kitty Dr
Charlotte, NC 28216
|
1,168 sq. feet
|
1 baths 3 beds |
show details | |

|
#4
Northgate Trail Dr
Charlotte, NC 28215
|
2,063 sq. feet
|
2 baths 3 beds |
show details | |

|
#5
Valerie Dr
Charlotte, NC 28216
|
2,380 sq. feet
|
2 baths 3 beds |
show details | |

|
#6
Lebanon Rd
Charlotte, NC 28227
|
1,374 sq. feet
|
2 baths 3 beds |
show details | |

|
#7
Stourbridge Lion Dr
Charlotte, NC 28213
|
1,448 sq. feet
|
2 baths 3 beds |
show details | |

|
#8
Chastain Walk Dr
Charlotte, NC 28216
|
2,109 sq. feet
|
2 baths 3 beds |
show details | |

|
#9
Fugate Ave
Charlotte, NC 28205
|
1,472 sq. feet
|
1 baths 3 beds |
show details | |

|
#10
Windy Knoll Ln
Charlotte, NC 28227
|
3,621 sq. feet
|
5 baths 4 beds |
show details |
| Photo | Address | Area | Beds / Baths | Price | Details |
|---|---|---|---|---|---|

|
#11
Haverstraw Ct
Charlotte, NC 28212
|
1,282 sq. feet
|
2 baths 3 beds |
show details | |

|
#12
Lederer Ave
Charlotte, NC 28277
|
3,768 sq. feet
|
4 baths 5 beds |
show details | |

|
#13
Lambert Bridge Dr
Charlotte, NC 28270
|
- sq. feet
|
2 baths 2 beds |
show details | |

|
#14
Frostmoor Pl
Charlotte, NC 28269
|
1,445 sq. feet
|
2 baths 3 beds |
show details | |

|
#15
Northwoods Forest Dr
Charlotte, NC 28214
|
1,614 sq. feet
|
2 baths 3 beds |
show details | |

|
#16
Avalon Loop Rd
Charlotte, NC 28269
|
1,504 sq. feet
|
2 baths 2 beds |
show details | |

|
#17
Sudbury Rd
Charlotte, NC 28205
|
1,409 sq. feet
|
1 baths 3 beds |
show details | |

|
#18
Denali Ln
Charlotte, NC 28216
|
2,870 sq. feet
|
2 baths 4 beds |
show details | |

|
#19
Peachtree Rd
Charlotte, NC 28216
|
1,938 sq. feet
|
2 baths 3 beds |
show details | |

|
#20
Corwin Dr
Charlotte, NC 28213
|
1,528 sq. feet
|
2 baths 3 beds |
show details |
| Photo | Address | Area | Beds / Baths | Price | Details |
|---|---|---|---|---|---|

|
#21
Chalkstone Rd
Charlotte, NC 28216
|
3,025 sq. feet
|
2 baths 3 beds |
show details | |

|
#22
West Blvd
Charlotte, NC 28203
|
1,690 sq. feet
|
1 baths 3 beds |
show details | |

|
#23
Reedy Creek Rd
Charlotte, NC 28215
|
2,635 sq. feet
|
2 baths 3 beds |
show details | |

|
#24
Vista Grande Cir
Charlotte, NC 28226
|
1,575 sq. feet
|
2 baths 3 beds |
show details | |

|
#25
Carmathen Rd
Charlotte, NC 28269
|
1,793 sq. feet
|
2 baths 3 beds |
show details | |

|
#26
Waverly Lynn Ln
Charlotte, NC 28269
|
1,886 sq. feet
|
2 baths 3 beds |
show details | |

|
#27
Kavan Hunter Dr
Charlotte, NC 28214
|
1,078 sq. feet
|
2 baths 3 beds |
show details | |

|
#28
Lakehouse Ln # 12
Charlotte, NC 28210
|
1,297 sq. feet
|
1 baths 3 beds |
show details | |

|
#29
Louisiana Ave
Charlotte, NC 28208
|
960 sq. feet
|
1 baths 3 beds |
show details | |

|
#30
Carlyle Dr
Charlotte, NC 28208
|
1,092 sq. feet
|
1 baths 3 beds |
show details |
| Photo | Address | Area | Beds / Baths | Price | Details |
|---|---|---|---|---|---|

|
#31
Preakness Ct
Charlotte, NC 28273
|
1,304 sq. feet
|
2 baths 3 beds |
show details | |

|
#32
Reddman Rd
Charlotte, NC 28212
|
2,600 sq. feet
|
2 baths 4 beds |
show details | |

|
#33
Swan Dr
Charlotte, NC 28216
|
2,953 sq. feet
|
2 baths 4 beds |
show details | |

|
#34
Silver Eagle Dr
Charlotte, NC 28214
|
1,008 sq. feet
|
2 baths 3 beds |
show details | |

|
#35
Kings Creek Dr
Charlotte, NC 28273
|
1,149 sq. feet
|
2 baths 3 beds |
show details | |

|
#36
Stringfellow Ln
Charlotte, NC 28278
|
2,472 sq. feet
|
2 baths 4 beds |
show details | |

|
#37
Stone Trail Rd
Charlotte, NC 28213
|
2,539 sq. feet
|
2 baths 3 beds |
show details | |

|
#38
Graybark Ave
Charlotte, NC 28205
|
1,316 sq. feet
|
1 baths 3 beds |
show details | |

|
#39
Winslow Hills Dr
Charlotte, NC 28278
|
2,949 sq. feet
|
2 baths 5 beds |
show details | |

|
#40
Versage Dr
Charlotte, NC 28227
|
2,196 sq. feet
|
2 baths 3 beds |
show details |
| Photo | Address | Area | Beds / Baths | Price | Details |
|---|---|---|---|---|---|

|
#41
Honor Guard Ave
Charlotte, NC 28277
|
2,440 sq. feet
|
2 baths 3 beds |
show details | |

|
#42
Silveroak Ln
Charlotte, NC 28277
|
2,270 sq. feet
|
2 baths 4 beds |
show details | |

|
#43
Melanie Thompson Dr
Charlotte, NC 28213
|
2,216 sq. feet
|
2 baths 3 beds |
show details | |

|
#44
Silverberry Ct
Charlotte, NC 28214
|
2,294 sq. feet
|
2 baths 3 beds |
show details | |

|
#45
Rolling Sky Dr
Charlotte, NC 28273
|
1,639 sq. feet
|
2 baths 3 beds |
show details | |

|
#46
Topsail Ct
Charlotte, NC 28212
|
1,452 sq. feet
|
2 baths 3 beds |
show details | |

|
#47
Hanging Moss Trl
Charlotte, NC 28227
|
2,252 sq. feet
|
2 baths 3 beds |
show details | |

|
#48
Yorkdale Dr
Charlotte, NC 28273
|
1,688 sq. feet
|
2 baths 3 beds |
show details | |

|
#49
Appleberry Ln
Charlotte, NC 28214
|
2,659 sq. feet
|
2 baths 4 beds |
show details | |

|
Check over 1 million property listings on Foreclosure.com!
|
browse all offers | |||

Latest news about housing in Charlotte, NC collected exclusively by city-data.com from local newspapers, TV, and radio stations


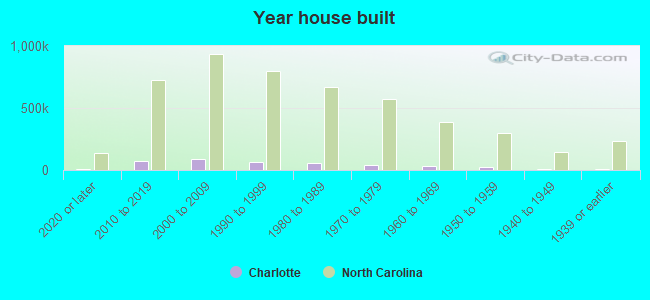
Median year apartment built: 1999
Household type by relationship:
Households: 897,720- Male householders: 182,376 (59,926 living alone), Female householders: 195,713 (79,312 living alone)
139,446 spouses (137,765 opposite-sex spouses), 32,840 unmarried partners, (29,899 opposite-sex unmarried partners), 246,256 children (234,726 natural, 4,310 adopted, 7,220 stepchildren), 16,488 grandchildren, 12,154 brothers or sisters, 11,886 parents, 264 foster children, 15,138 other relatives, 31,545 non-relatives
- In group quarters: 13,614
Size of family households: 89,286 2-persons, 52,493 3-persons, 34,145 4-persons, 17,465 5-persons, 5,833 6-persons, 4,542 7-or-more-persons.
Size of nonfamily households: 139,238 1-person, 31,638 2-persons, 2,166 3-persons, 758 4-persons, 496 5-persons, 29 7-or-more-persons.
115,177 married couples with children.
63,731 single-parent households (17,137 men, 46,594 women).
78.1% of residents of Charlotte speak English at home.
13.0% of residents speak Spanish at home (46% speak English very well, 20% speak English well, 18% speak English not well, 16% don't speak English at all).
4.2% of residents speak other Indo-European language at home (77% speak English very well, 14% speak English well, 6% speak English not well, 2% don't speak English at all).
3.5% of residents speak Asian or Pacific Island language at home (55% speak English very well, 21% speak English well, 17% speak English not well, 7% don't speak English at all).
1.2% of residents speak other language at home (70% speak English very well, 28% speak English well, 2% speak English not well).
Foreign born population: 151,181 (16.8%)
(43.4% of them are naturalized citizens)
| Here: | 6.6 |
| State: | 6.4 |
| Here: | 4.0 |
| State: | 4.4 |
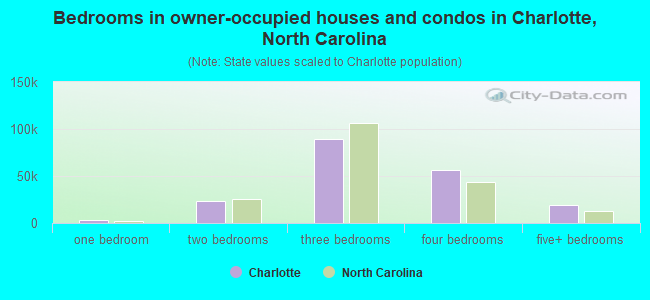
- Bedrooms in owner-occupied houses and condos in Charlotte, North Carolina
- 938no bedroom
- 3,1081 bedroom
- 23,0582 bedrooms
- 89,2723 bedrooms
- 56,1614 bedrooms
- 19,5545+ bedrooms
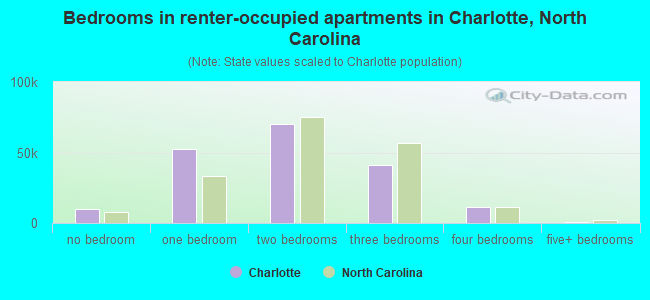
- Bedrooms in renter-occupied apartments in Charlotte, North Carolina
- 9,869no bedroom
- 52,5621 bedroom
- 70,2802 bedrooms
- 41,3003 bedrooms
- 11,0974 bedrooms
- 8905+ bedrooms
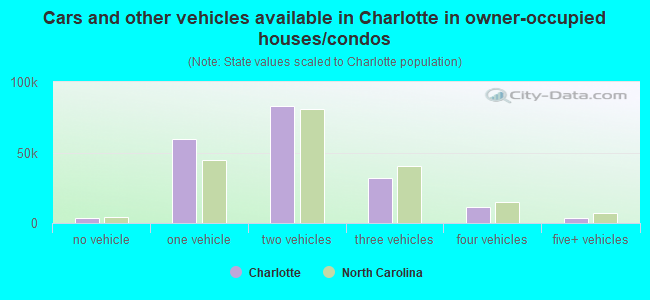
- Cars and other vehicles available in Charlotte in owner-occupied houses/condos
- 3,229no vehicle
- 59,2541 vehicle
- 83,2042 vehicles
- 31,5833 vehicles
- 11,5944 vehicles
- 3,2275+ vehicles

- Cars and other vehicles available in Charlotte in renter-occupied apartments
- 18,256no vehicle
- 101,0391 vehicle
- 52,4462 vehicles
- 10,5073 vehicles
- 2,2384 vehicles
- 1,5125+ vehicles
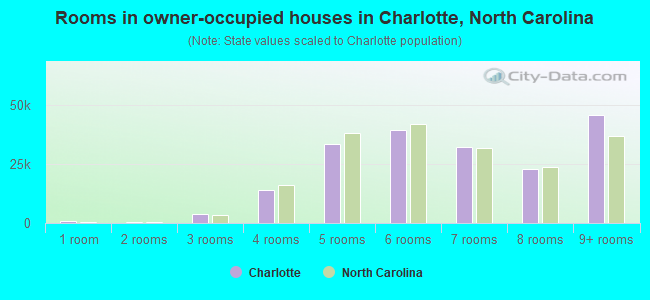
- Rooms in owner-occupied houses in Charlotte, North Carolina
- 7921 room
- 4082 rooms
- 3,6283 rooms
- 14,0454 rooms
- 33,2565 rooms
- 39,4386 rooms
- 32,2227 rooms
- 22,6968 rooms
- 45,6069+ rooms
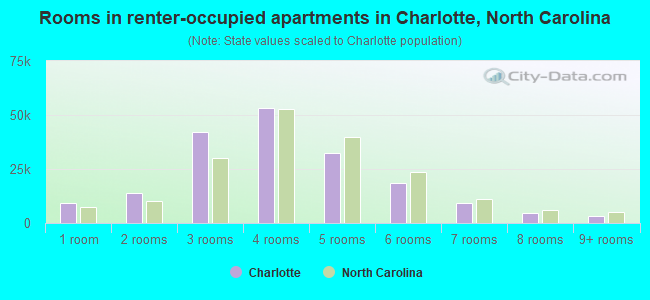
- Rooms in renter-occupied apartments in Charlotte, North Carolina
- 9,0901 room
- 13,8052 rooms
- 42,0163 rooms
- 53,2584 rooms
- 32,4225 rooms
- 18,4886 rooms
- 9,3687 rooms
- 4,4548 rooms
- 3,0979+ rooms
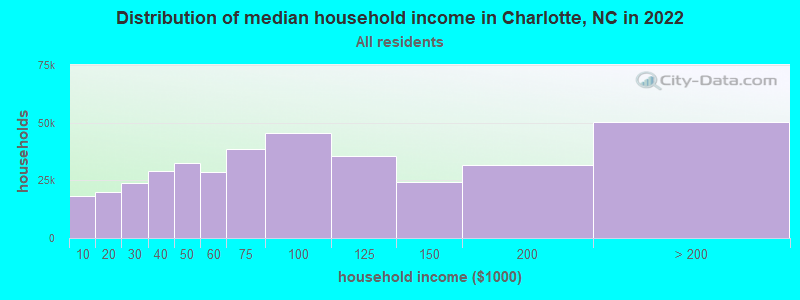
Charlotte, NC household income distribution

- 18,321Less than $10,000
- 20,068$10,000 to $19,999
- 23,855$20,000 to $29,999
- 28,897$30,000 to $39,999
- 32,469$40,000 to $49,999
- 28,492$50,000 to $59,999
- 38,626$60,000 to $74,999
- 45,472$75,000 to $99,999
- 35,464$100,000 to $124,999
- 24,327$125,000 to $149,999
- 31,702$150,000 to $199,999
- 50,396$200,000 or more
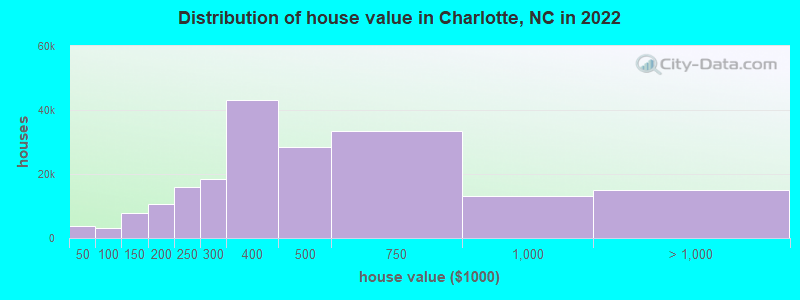
Home value of owner - occupied houses in 2022 in Charlotte, NC
-
- 1,532Less than $10,000
- 248$10,000 to $14,999
- 312$15,000 to $19,999
- 401$20,000 to $24,999
- 280$25,000 to $29,999
- 197$30,000 to $34,999
- 460$35,000 to $39,999
- 435$40,000 to $49,999
- 279$50,000 to $59,999
- 339$60,000 to $69,999
- 1,123$70,000 to $79,999
- 614$80,000 to $89,999
- 424$90,000 to $99,999
- 4,270$100,000 to $124,999
- 3,475$125,000 to $149,999
- 4,670$150,000 to $174,999
- 5,864$175,000 to $199,999
- 15,795$200,000 to $249,999
- 18,503$250,000 to $299,999
- 43,015$300,000 to $399,999
- 28,520$400,000 to $499,999
- 33,298$500,000 to $749,999
- 13,127$750,000 to $999,999
- 8,387$1,000,000 to $1,499,999
- 3,075$1,500,000 to $1,999,999
- 3,448$2,000,000 or more
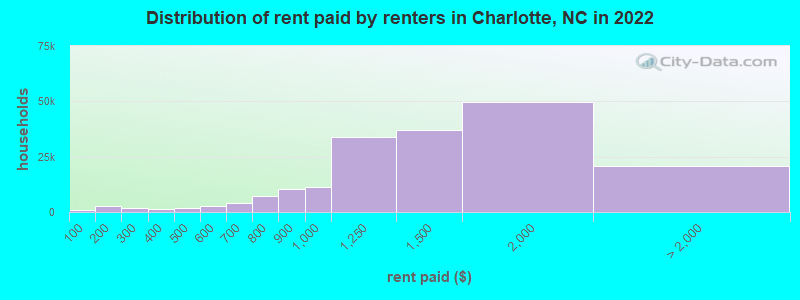
Rent paid by renters in 2022 in Charlotte, NC
-
- 826Less than $100
- 962$100 to $149
- 1,626$150 to $199
- 1,410$200 to $249
- 321$250 to $299
- 945$300 to $349
- 403$350 to $399
- 759$400 to $449
- 886$450 to $499
- 2,016$500 to $549
- 643$550 to $599
- 2,070$600 to $649
- 2,213$650 to $699
- 4,050$700 to $749
- 3,156$750 to $799
- 10,583$800 to $899
- 11,318$900 to $999
- 33,769$1,000 to $1,249
- 37,152$1,250 to $1,499
- 49,895$1,500 to $1,999
- 9,149$2,000 to $2,499
- 4,319$2,500 to $2,999
- 840$3,000 to $3,499
- 1,487$3,500 or more
- 5,200No cash rent

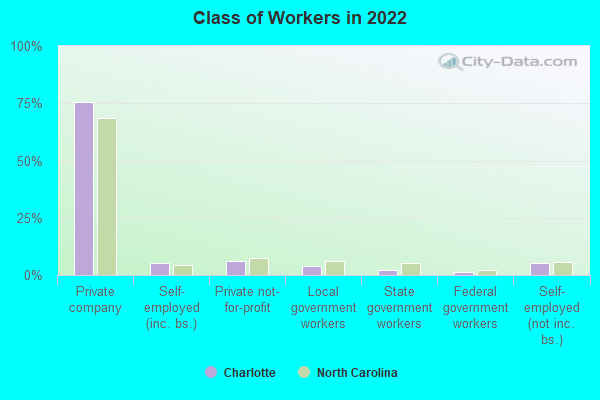
Percentage of workers working in this county: 91.7%
Number of people working at home: 152,076 (30.9% of all workers)

Travel time to work (commute)
- Less than 5 minutes: 6,241
- 5 to 9 minutes: 24,852
- 10 to 14 minutes: 45,736
- 15 to 19 minutes: 60,139
- 20 to 24 minutes: 58,049
- 25 to 29 minutes: 34,794
- 30 to 34 minutes: 54,836
- 35 to 39 minutes: 11,864
- 40 to 44 minutes: 10,193
- 45 to 59 minutes: 19,192
- 60 to 89 minutes: 9,710
- 90 or more minutes: 4,855

Means of transportation to work:
- Drove a car alone: 417,081 (64.8%)
- Carpooled: 49,171 (7.6%)
- Bus: 5,610 (0.9%)
- Subway or elevated rail: 480 (0.1%)
- Long-distance train or commuter rail: 66 (0.0%)
- Light rail, streetcar or trolley: 3,193 (0.5%)
- Ferryboat: 89 (0.0%)
- Taxi: 7,117 (1.1%)
- Bicycle: 841 (0.1%)
- Walked: 8,322 (1.3%)
- Worked at home: 152,076 (23.6%)
- Unemployment by race in 2022
- Unemployment rate for White non-Hispanic residents
- 1.8%Males
- 2.6%Females
- Unemployment rate for Black residents
- 5.0%Males
- 3.7%Females
- Unemployment rate for American Indian and Alaska Native residents
- 3.9%Males
- 4.1%Females
- Unemployment rate for Asian residents
- 3.2%Males
- 5.7%Females
- Unemployment rate for other race residents
- 3.2%Males
- 3.1%Females
- Unemployment rate for two or more race residents
- 3.3%Males
- 6.3%Females
- Unemployment rate for Hispanic or Latino residents
- 1.8%Males
- 3.5%Females
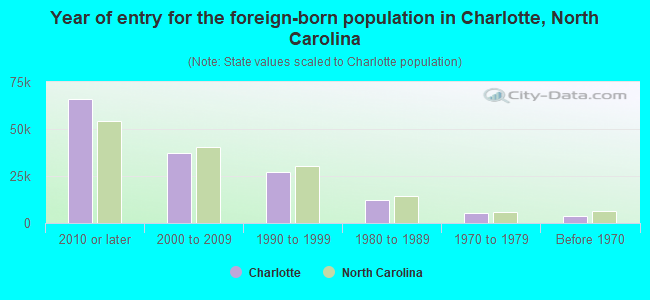
- Year of entry for the foreign-born population in Charlotte, North Carolina
- 65,9882010 or later
- 36,9762000 to 2009
- 27,3541990 to 1999
- 12,3991980 to 1989
- 5,3841970 to 1979
- 3,853Before 1970
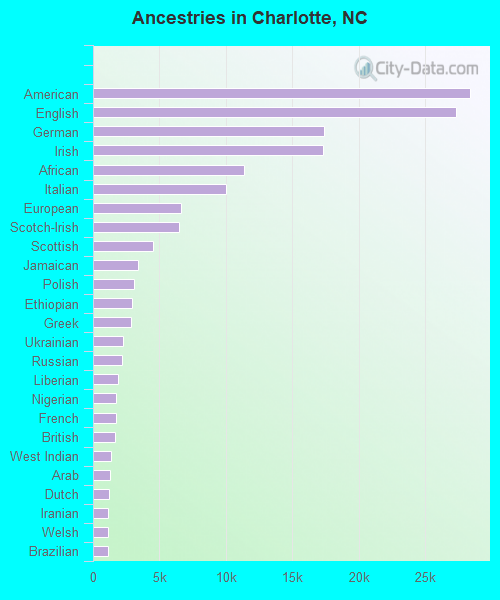
First ancestries reported:
- American: 28,396 (5.2%)
- English: 27,322 (5.0%)
- German: 17,365 (3.2%)
- Irish: 17,346 (3.2%)
- African: 11,364 (2.1%)
- Italian: 9,995 (1.8%)
- European: 6,597 (1.2%)
- Scotch-Irish: 6,510 (1.2%)
- Scottish: 4,546 (0.8%)
- Jamaican: 3,369 (0.6%)
- Polish: 3,091 (0.6%)
- Ethiopian: 2,958 (0.5%)
- Greek: 2,827 (0.5%)
- Ukrainian: 2,245 (0.4%)
- Russian: 2,148 (0.4%)
- Liberian: 1,855 (0.3%)
- Nigerian: 1,719 (0.3%)
- French: 1,717 (0.3%)
- British: 1,652 (0.3%)
- West Indian: 1,351 (0.2%)
- Arab: 1,293 (0.2%)
- Dutch: 1,184 (0.2%)
- Iranian: 1,136 (0.2%)
- Welsh: 1,098 (0.2%)
- Brazilian: 1,096 (0.2%)
- Romanian: 1,080 (0.2%)
- Haitian: 1,006 (0.2%)
- Lebanese: 979 (0.2%)
- Norwegian: 866 (0.2%)
- Ghanaian: 835 (0.2%)
- Eastern European: 747 (0.1%)
- French Canadian: 737 (0.1%)
- Swedish: 671 (0.1%)
- Moroccan: 573 (0.1%)
- Somali: 536 (0.10%)
- Yugoslavian: 495 (0.09%)
- Trinidadian and Tobagonian: 439 (0.08%)
- Scandinavian: 426 (0.08%)
- Portuguese: 422 (0.08%)
- Hungarian: 382 (0.07%)
- Slovak: 370 (0.07%)
- Egyptian: 367 (0.07%)
- Guyanese: 357 (0.06%)
- Swiss: 352 (0.06%)
- Turkish: 345 (0.06%)
- Canadian: 337 (0.06%)
- Armenian: 334 (0.06%)
- Czech: 333 (0.06%)
- Danish: 288 (0.05%)
- Senegalese: 287 (0.05%)
- Zimbabwean: 264 (0.05%)
- Belgian: 260 (0.05%)
- Cape Verdean: 254 (0.05%)
- Finnish: 253 (0.05%)
- Northern European: 241 (0.04%)
- South African: 238 (0.04%)
- Austrian: 235 (0.04%)
- Afghan: 221 (0.04%)
- Slavic: 215 (0.04%)
- Sudanese: 215 (0.04%)
- Lithuanian: 208 (0.04%)
- Palestinian: 206 (0.04%)
- Bulgarian: 205 (0.04%)
- Barbadian: 180 (0.03%)
- Macedonian: 171 (0.03%)
- Jordanian: 168 (0.03%)
- Croatian: 156 (0.03%)
- Sierra Leonean: 153 (0.03%)
- Albanian: 132 (0.02%)
- Kenyan: 131 (0.02%)
- Iraqi: 130 (0.02%)
- Syrian: 127 (0.02%)
- Czechoslovakian: 119 (0.02%)
- Israeli: 108 (0.02%)
- Serbian: 106 (0.02%)
- Slovene: 103 (0.02%)
- British West Indian: 94 (0.02%)
- Australian: 87 (0.02%)
- German Russian: 83 (0.02%)
- Estonian: 53 (0.01%)
- Latvian: 45 (0.01%)
- Belizean: 41 (0.01%)
- Dutch West Indian: 41 (0.01%)
- Maltese: 32 (0.01%)
Most common places of birth for foreign-born residents (%):
| Charlotte: | 12.9% (20,773) |
| North Carolina: | 24.7% (214,776) |
| Charlotte: | 11.5% (18,574) |
| North Carolina: | 9.3% (80,594) |
| Charlotte: | 10.7% (17,176) |
| North Carolina: | 4.7% (40,707) |
| Charlotte: | 5.1% (8,171) |
| North Carolina: | 3.8% (33,379) |
| Charlotte: | 4.1% (6,579) |
| North Carolina: | 2.9% (24,965) |
| Charlotte: | 3.0% (4,829) |
| North Carolina: | 2.6% (22,964) |
| Charlotte: | 2.5% (4,059) |
| North Carolina: | 2.1% (18,275) |
| Charlotte: | 2.4% (3,806) |
| North Carolina: | 3.2% (27,477) |
| Charlotte: | 2.1% (3,411) |
| North Carolina: | 1.7% (15,135) |
| Charlotte: | 1.9% (3,109) |
| North Carolina: | 1.3% (11,419) |
| Charlotte: | 1.9% (3,057) |
| North Carolina: | 0.9% (7,765) |
| Charlotte: | 1.6% (2,536) |
| North Carolina: | 1.2% (9,986) |
| Charlotte: | 1.5% (2,473) |
| North Carolina: | 0.5% (4,475) |
Place of birth for U.S.-born residents:
- This state: 360,080
- Other state: 372,648
- Northeast: 125,337
- Midwest: 57,790
- South: 160,612
- West: 28,909
83.4% of Charlotte residents lived in the same house 1 years ago.
Out of people who lived in different houses, 34.0% lived in this county.
Out of people who lived in different counties, 39.1% lived in North Carolina.
| Charlotte: | 83.4% |
| State average: | 87.3% |
Education attainment for males 25 years and older:
- No schooling: 6,208
- Nursery to 4th grade: 1,383
- 5th and 6th grade: 6,212
- 7th and 8th grade: 1,568
- 9th grade: 2,485
- 10th grade: 3,555
- 11th grade: 4,354
- 12th grade, no diploma: 3,781
- High school graduate (or equivalency): 50,563
- Less than 1 year of college: 10,773
- Some college more than 1 year, no degree: 41,424
- Associate degree: 19,126
- Bachelor's degree: 88,311
- Master's degree: 33,980
- Professional school degree: 8,309
- Doctorate degree: 4,911

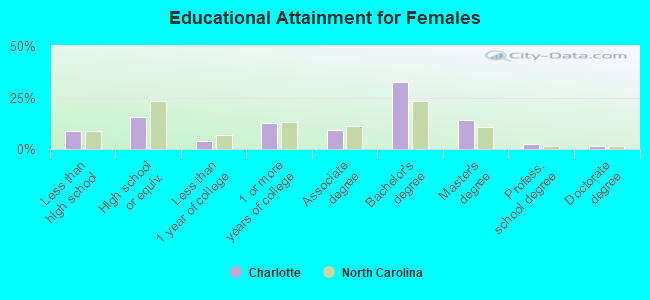
Education attainment for females 25 years and older:
- No schooling: 5,756
- Nursery to 4th grade: 1,286
- 5th and 6th grade: 3,743
- 7th and 8th grade: 3,226
- 9th grade: 1,923
- 10th grade: 3,625
- 11th grade: 3,602
- 12th grade, no diploma: 4,212
- High school graduate (or equivalency): 49,667
- Less than 1 year of college: 11,899
- Some college more than 1 year, no degree: 40,602
- Associate degree: 28,740
- Bachelor's degree: 104,186
- Master's degree: 44,510
- Professional school degree: 7,358
- Doctorate degree: 4,089


Housing units in structures:
- One, detached: 208,925
- One, attached: 38,286
- Two: 3,357
- 3 or 4: 11,129
- 5 to 9: 20,872
- 10 to 19: 40,342
- 20 to 49: 31,714
- 50 or more: 46,197
- Mobile homes: 4,844
- Boats, RVs, vans, etc.: 389
Median worth of mobile homes: $82,500
Housing units lacking complete kitchen facilities in 2022: 0.8%
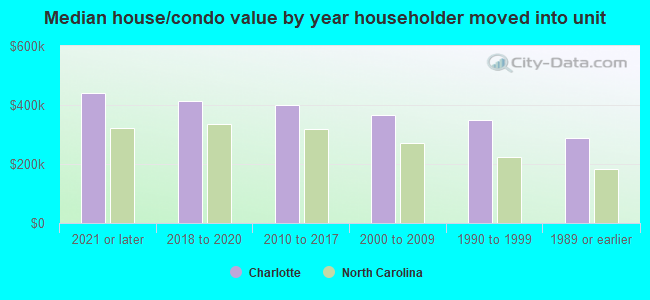
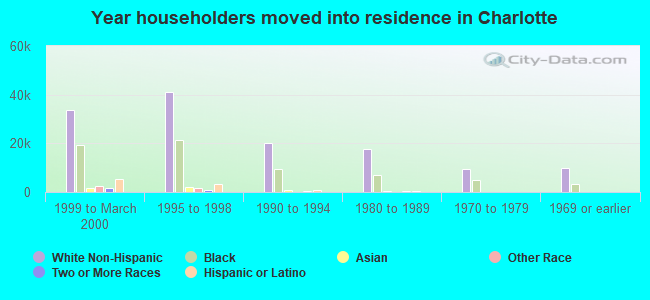
House/condo owner moved in on average 10 years ago
Renter moved in on average 2 years ago
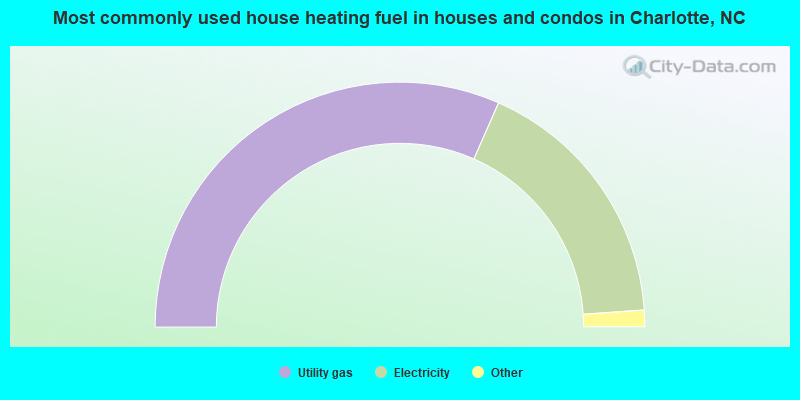
- 63.2%Utility gas
- 34.6%Electricity
- 1.7%Bottled, tank, or LP gas
- 0.2%Fuel oil, kerosene, etc.
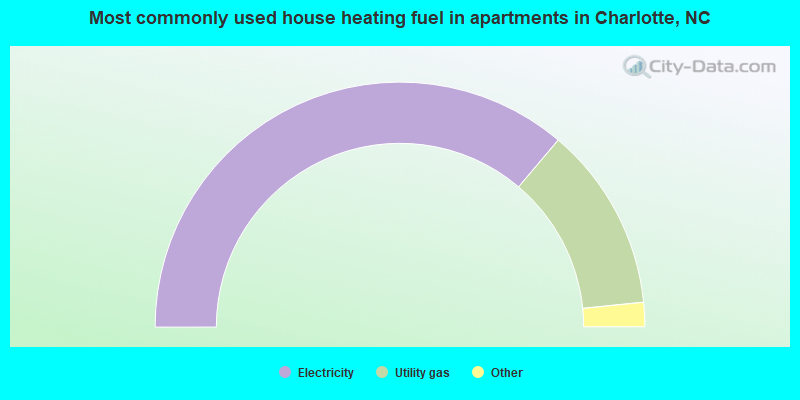
- 74.5%Electricity
- 23.4%Utility gas
- 1.0%Bottled, tank, or LP gas
- 0.7%No fuel used
- 0.2%Wood
- 0.1%Fuel oil, kerosene, etc.
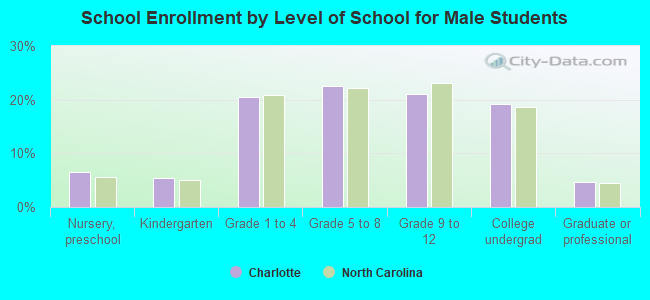
Private vs. public school enrollment:
| Here: | 9.8% |
| North Carolina: | 13.8% |
| Here: | 10.8% |
| North Carolina: | 11.9% |
| Here: | 15.8% |
| North Carolina: | 19.3% |