Charlestown, RI (Rhode Island) Houses and Residents
| Charlestown: | $470,364 |
| Rhode Island: | $383,900 |
Total population: 7,827 (Urban population: 1,891 (all inside urban clusters), Rural population: 5,968 (16 farm, 5,952 nonfarm))
Houses: 4,797 (3,178 occupied: 2,664 owner occupied, 514 renter occupied)
| % of renters here: | 16% |
| State: | 37% |
Housing density: 130 houses/condos per square mile
Median price asked for vacant for-sale houses and condos in 2022 in this county: $451,032.
Median contract rent in 2022: $1,257 (lower quartile is $990, upper quartile is $1,695)
Median rent asked for vacant for-rent units in 2022: $1,179
Median gross rent in Charlestown, RI in 2022: $1,460
Housing units in Charlestown with a mortgage: 1,564 (96 second mortgage, 219 home equity loan, 27 both second mortgage and home equity loan)
Houses without a mortgage: 699
Compare current foreclosures near Charlestown, RI:
| Photo | Address | Area | Beds / Baths | Price | Details |
|---|---|---|---|---|---|

|
#1
Ross Hill Rd
Charlestown, RI 02813
|
2,100 sq. feet
|
2 baths 3 beds |
show details | |

|
#2
Blue Ridge Dr
Charlestown, RI 02813
|
2,338 sq. feet
|
2 baths 3 beds |
show details | |

|
#3
S County Trl
Charlestown, RI 02813
|
- sq. feet
|
- baths - beds |
show details | |

|
#4
Lauri Dr # 1b
Charlestown, RI 02813
|
- sq. feet
|
- baths - beds |
show details | |

|
#5
Johnson Ln
Charlestown, RI 02813
|
- sq. feet
|
- baths - beds |
show details | |

|
#6
Hallville Rd
Exeter, RI 02822
|
943 sq. feet
|
1 baths 2 beds |
$69,900
|
show details |

|
#7
Cow Hill Rd
Mystic, CT 06355
|
1,614 sq. feet
|
2 baths 3 beds |
show details | |

|
#8
Red Oak Dr
Wyoming, RI 02898
|
1,132 sq. feet
|
1 baths 3 beds |
show details | |

|
#9
Liberty St
Pawcatuck, CT 06379
|
1,880 sq. feet
|
2 baths 4 beds |
show details | |

|
#10
Hillsdale Rd
West Kingston, RI 02892
|
792 sq. feet
|
1 baths 1 beds |
show details |
| Photo | Address | Area | Beds / Baths | Price | Details |
|---|---|---|---|---|---|

|
#11
Crestwood Dr
Hope Valley, RI 02832
|
1,320 sq. feet
|
2 baths 3 beds |
show details | |

|
#12
High St
Wakefield, RI 02879
|
2,400 sq. feet
|
3 baths 5 beds |
show details | |

|
#13
Shannon Rd
Exeter, RI 02822
|
3,550 sq. feet
|
3 baths 5 beds |
show details | |

|
#14
Cole Dr
North Kingstown, RI 02852
|
1,483 sq. feet
|
1 baths 3 beds |
show details | |

|
#15
Oak Hill Rd
Wakefield, RI 02879
|
2,100 sq. feet
|
2 baths 4 beds |
show details | |

|
#16
Reutemann Rd
North Stonington, CT 06359
|
1,296 sq. feet
|
1 baths 3 beds |
show details | |

|
#17
Shady Grove Rd
Hope Valley, RI 02832
|
2,520 sq. feet
|
3 baths 4 beds |
show details | |

|
#18
Breezy Knls
Mystic, CT 06355
|
1,376 sq. feet
|
1 baths 3 beds |
show details | |

|
#19
Palm Beach Ave
Narragansett, RI 02882
|
1,404 sq. feet
|
1 baths 3 beds |
show details | |

|
#20
Andre Ave
Wakefield, RI 02879
|
1,306 sq. feet
|
1 baths 3 beds |
show details |
| Photo | Address | Area | Beds / Baths | Price | Details |
|---|---|---|---|---|---|

|
#21
South Rd
Exeter, RI 02822
|
1,258 sq. feet
|
1 baths 3 beds |
show details | |

|
#22
Cardinal Dr
North Kingstown, RI 02852
|
1,166 sq. feet
|
2 baths 2 beds |
show details | |

|
#23
Dinonsie Way
Wakefield, RI 02879
|
2,048 sq. feet
|
2 baths 3 beds |
show details | |

|
#24
Chickadee Ln
Westerly, RI 02891
|
1,915 sq. feet
|
2 baths 3 beds |
show details | |

|
#25
Arlington St
Westerly, RI 02891
|
1,056 sq. feet
|
1 baths 2 beds |
show details | |

|
#26
Andrews St
Pawcatuck, CT 06379
|
790 sq. feet
|
1 baths 2 beds |
show details | |

|
#27
Fenner Hill Rd
Hope Valley, RI 02832
|
1,092 sq. feet
|
1 baths 3 beds |
show details | |

|
#28
Clarks Falls Rd
North Stonington, CT 06359
|
1,638 sq. feet
|
2 baths 4 beds |
show details | |

|
#29
Old Rose Hill Rd
Wakefield, RI 02879
|
1,132 sq. feet
|
3 baths 3 beds |
show details | |

|
#30
Frank Ave
West Kingston, RI 02892
|
3,029 sq. feet
|
2 baths 5 beds |
show details |
| Photo | Address | Area | Beds / Baths | Price | Details |
|---|---|---|---|---|---|

|
#31
Usquepaugh Rd
West Kingston, RI 02892
|
1,311 sq. feet
|
1 baths 3 beds |
show details | |

|
#32
Top St
Westerly, RI 02891
|
1,118 sq. feet
|
1 baths 3 beds |
show details | |

|
#33
Mulberry Dr
Wakefield, RI 02879
|
2,930 sq. feet
|
2 baths 3 beds |
show details | |

|
#34
Old Post Rd
Wakefield, RI 02879
|
988 sq. feet
|
1 baths 3 beds |
show details | |

|
#35
Blacksmith Dr
Ledyard, CT 06339
|
1,196 sq. feet
|
2 baths 4 beds |
show details | |

|
#36
Sachem Ln
Ledyard, CT 06339
|
1,200 sq. feet
|
1 baths 3 beds |
show details | |

|
#37
Canal St
Westerly, RI 02891
|
878 sq. feet
|
1 baths 2 beds |
show details | |

|
#38
Dugway Bridge Rd # C
West Kingston, RI 02892
|
3,024 sq. feet
|
2 baths 3 beds |
show details | |

|
#39
Hewitt Rd Apt B2
Mystic, CT 06355
|
- sq. feet
|
- baths - beds |
show details | |

|
#40
Elmridge Rd
Pawcatuck, CT 06379
|
- sq. feet
|
- baths - beds |
show details |
| Photo | Address | Area | Beds / Baths | Price | Details |
|---|---|---|---|---|---|

|
#41
Grandeville Ct Apt 932
Wakefield, RI 02879
|
- sq. feet
|
- baths - beds |
show details | |

|
#42
Stony Fort Rd
West Kingston, RI 02892
|
- sq. feet
|
- baths - beds |
show details | |

|
#43
A Stony Fort Rd
West Kingston, RI 02892
|
- sq. feet
|
- baths - beds |
show details | |

|
#44
Fairview Ave
Hope Valley, RI 02832
|
- sq. feet
|
- baths - beds |
show details | |

|
#45
Meadow Ave
Wakefield, RI 02879
|
- sq. feet
|
- baths - beds |
show details | |

|
#46
Liberty St # 3
Pawcatuck, CT 06379
|
- sq. feet
|
- baths - beds |
show details | |

|
#47
Palmer St # 2
Pawcatuck, CT 06379
|
- sq. feet
|
- baths - beds |
show details | |

|
#48
Clearview Dr
West Kingston, RI 02892
|
- sq. feet
|
- baths - beds |
show details | |

|
#49
Turano Ave # B
Westerly, RI 02891
|
- sq. feet
|
- baths - beds |
show details | |

|
Check over 1 million property listings on Foreclosure.com!
|
browse all offers | |||

Latest news about housing in Charlestown, RI collected exclusively by city-data.com from local newspapers, TV, and radio stations

 | Boston (more than ever) Drives RI's housing market - Up (239 replies) |
| Buying a house in RI vs CT? (177 replies) |
| Crazy Rhode Island real estate market (525 replies) |
| WOW! What's going on with Westerly Real Estate? (81 replies) |
| New List of Affordable Housing Projects (12 replies) |
| Fane Tower moves forward bigger than originally planned (155 replies) |

Household type by relationship:
Households: 120,455- In family households: 97,517 (22,521 male householders, 9,776 female householders)
25,672 spouses, 32,659 children (30,624 natural, 890 adopted, 1,145 stepchildren), 1,621 grandchildren, 699 brothers or sisters, 886 parents, foster children, 740 other relatives, 2,278 non-relatives
- In nonfamily households: 22,938 (7,677 male householders (5,469 living alone)), 9,203 female householders (7,356 living alone)), 6,058 nonrelatives
- In group quarters: 6,524 (790 institutionalized population)
21,663 married couples with children.
5,466 single-parent households (1,196 men, 4,270 women).
95.4% of residents of Charlestown speak English at home.
1.6% of residents speak Spanish at home (82% speak English very well, 9% speak English well, 8% speak English not well).
2.5% of residents speak other Indo-European language at home (73% speak English very well, 24% speak English well, 3% speak English not well).
0.5% of residents speak Asian or Pacific Island language at home (68% speak English very well, 32% speak English well).
Foreign born population: 159 (1.9%)
(89.3% of them are naturalized citizens)
| Here: | 5.2 |
| State: | 6.2 |
| Here: | 4.4 |
| State: | 4.1 |

- Bedrooms in owner-occupied houses and condos in Charlestown, Rhode Island
- 0no bedroom
- 1131 bedroom
- 7582 bedrooms
- 1,3193 bedrooms
- 4184 bedrooms
- 565+ bedrooms

- Bedrooms in renter-occupied apartments in Charlestown, Rhode Island
- 6no bedroom
- 901 bedroom
- 2112 bedrooms
- 1693 bedrooms
- 354 bedrooms
- 35+ bedrooms

- Cars and other vehicles available in Charlestown in owner-occupied houses/condos
- 60no vehicle
- 7631 vehicle
- 1,2932 vehicles
- 3743 vehicles
- 1304 vehicles
- 445+ vehicles

- Cars and other vehicles available in Charlestown in renter-occupied apartments
- 0no vehicle
- 1421 vehicle
- 2842 vehicles
- 883 vehicles
- 04 vehicles
- 05+ vehicles

- Rooms in owner-occupied houses in Charlestown, Rhode Island
- 01 room
- 202 rooms
- 953 rooms
- 3924 rooms
- 6165 rooms
- 6406 rooms
- 4207 rooms
- 2938 rooms
- 1889+ rooms

- Rooms in renter-occupied apartments in Charlestown, Rhode Island
- 61 room
- 222 rooms
- 403 rooms
- 1684 rooms
- 635 rooms
- 1416 rooms
- 517 rooms
- 148 rooms
- 99+ rooms


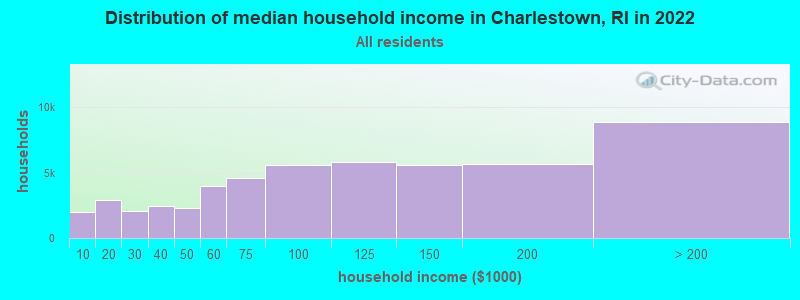
Charlestown, RI household income distribution

- 1,952Less than $10,000
- 2,886$10,000 to $19,999
- 2,058$20,000 to $29,999
- 2,466$30,000 to $39,999
- 2,262$40,000 to $49,999
- 3,941$50,000 to $59,999
- 4,568$60,000 to $74,999
- 5,542$75,000 to $99,999
- 5,833$100,000 to $124,999
- 5,542$125,000 to $149,999
- 5,617$150,000 to $199,999
- 8,859$200,000 or more
Percentage of workers working in this county: 70.4%
Number of people working at home: 606 (13.4% of all workers)
Travel time to work (commute)
- Less than 5 minutes: 145
- 5 to 9 minutes: 163
- 10 to 14 minutes: 431
- 15 to 19 minutes: 672
- 20 to 24 minutes: 681
- 25 to 29 minutes: 195
- 30 to 34 minutes: 458
- 35 to 39 minutes: 144
- 40 to 44 minutes: 228
- 45 to 59 minutes: 605
- 60 to 89 minutes: 154
- 90 or more minutes: 48
Means of transportation to work:
- Drove a car alone: 3,396 (84.2%)
- Carpooled: 372 (9.2%)
- Bus or trolley bus: 9 (0.2%)
- Subway or elevated: 6 (0.1%)
- Railroad: 6 (0.1%)
- Motorcycle: 1 (0.0%)
- Bicycle: 19 (0.5%)
- Walked: 82 (2.0%)
- Other means: 33 (0.8%)
- Worked at home: 110 (2.7%)


- Year of entry for the foreign-born population in Charlestown, Rhode Island
- 201995 to March 2000
- 01990 to 1994
- 01985 to 1989
- 61980 to 1984
- 121975 to 1979
- 71970 to 1974
- 351965 to 1969
- 93Before 1965

First ancestries reported:
- Irish: 1,858 (18.6%)
- English: 1,709 (17.1%)
- Italian: 1,215 (12.2%)
- French: 958 (9.6%)
- German: 765 (7.7%)
- Other: 666 (6.7%)
- French Canadian: 443 (4.4%)
- Polish: 412 (4.1%)
- Scottish: 315 (3.2%)
- United States: 295 (3.0%)
- Swedish: 286 (2.9%)
- Portuguese: 223 (2.2%)
- Scotch-Irish: 207 (2.1%)
- Welsh: 92 (0.9%)
- Norwegian: 82 (0.8%)
- Russian: 71 (0.7%)
- Lithuanian: 70 (0.7%)
- Czech: 60 (0.6%)
- Dutch: 56 (0.6%)
- Greek: 41 (0.4%)
- Ukrainian: 40 (0.4%)
- Arab: 31 (0.3%)
- Hungarian: 25 (0.3%)
- Danish: 20 (0.2%)
- Subsaharan African: 17 (0.2%)
- Slovak: 7 (0.07%)
- West Indian: 4 (0.04%)
Most common places of birth for foreign-born residents (%):
| Charlestown: | 19.7% (34) |
| Rhode Island: | 2.6% (3,120) |
| Charlestown: | 15.6% (27) |
| Rhode Island: | 1.7% (1,982) |
| Charlestown: | 12.1% (21) |
| Rhode Island: | 0.4% (509) |
| Charlestown: | 10.4% (18) |
| Rhode Island: | 3.4% (4,015) |
| Charlestown: | 8.1% (14) |
| Rhode Island: | 1.6% (1,936) |
| Charlestown: | 5.2% (9) |
| Rhode Island: | 0.4% (474) |
| Charlestown: | 4.0% (7) |
| Rhode Island: | 3.8% (4,502) |
| Charlestown: | 3.5% (6) |
| Rhode Island: | 0.2% (210) |
| Charlestown: | 3.5% (6) |
| Rhode Island: | 0.5% (640) |
| Charlestown: | 2.9% (5) |
| Rhode Island: | 1.2% (1,473) |
| Charlestown: | 2.9% (5) |
| Rhode Island: | 0.7% (792) |
| Charlestown: | 2.9% (5) |
| Rhode Island: | 7.0% (8,389) |
| Charlestown: | 2.3% (4) |
| Rhode Island: | 0.9% (1,014) |
| Charlestown: | 2.3% (4) |
| Rhode Island: | 2.8% (3,335) |
| Charlestown: | 1.7% (3) |
| Rhode Island: | 0.1% (154) |
Place of birth for U.S.-born residents:
- This state: 4,456
- Other state: 3,174
- Northeast: 2,472
- Midwest: 216
- South: 358
- West: 128
56% of Charlestown residents lived in the same house 5 years ago.
Out of people who lived in different houses, 53% lived in this county.
Out of people who lived in different counties, 37% lived in Rhode Island.
Education attainment for males 25 years and older:
- No schooling: 40
- Nursery to 4th grade: 0
- 5th and 6th grade: 5
- 7th and 8th grade: 48
- 9th grade: 34
- 10th grade: 55
- 11th grade: 70
- 12th grade, no diploma: 81
- High school graduate (or equivalency): 857
- Less than 1 year of college: 228
- Some college more than 1 year, no degree: 386
- Associate degree: 156
- Bachelor's degree: 495
- Master's degree: 211
- Professional school degree: 52
- Doctorate degree: 23

Education attainment for females 25 years and older:
- No schooling: 2
- Nursery to 4th grade: 0
- 5th and 6th grade: 0
- 7th and 8th grade: 20
- 9th grade: 43
- 10th grade: 46
- 11th grade: 85
- 12th grade, no diploma: 36
- High school graduate (or equivalency): 945
- Less than 1 year of college: 198
- Some college more than 1 year, no degree: 356
- Associate degree: 285
- Bachelor's degree: 513
- Master's degree: 307
- Professional school degree: 45
- Doctorate degree: 15


Housing units in structures:
- One, detached: 4,127
- One, attached: 189
- Two: 132
- 3 or 4: 128
- 5 to 9: 31
- 10 to 19: 18
- Mobile homes: 172
Median worth of mobile homes: $169,723
Housing units lacking complete kitchen facilities: 0.2%

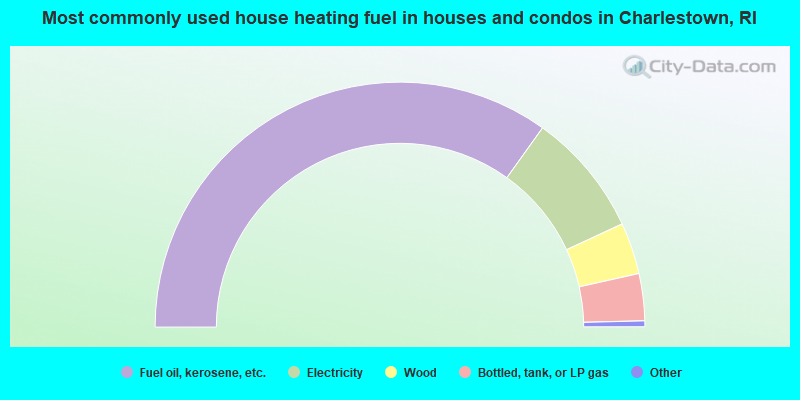
- 69.8%Fuel oil, kerosene, etc.
- 16.4%Electricity
- 6.8%Wood
- 6.2%Bottled, tank, or LP gas
- 0.6%Utility gas
- 0.1%Coal or coke
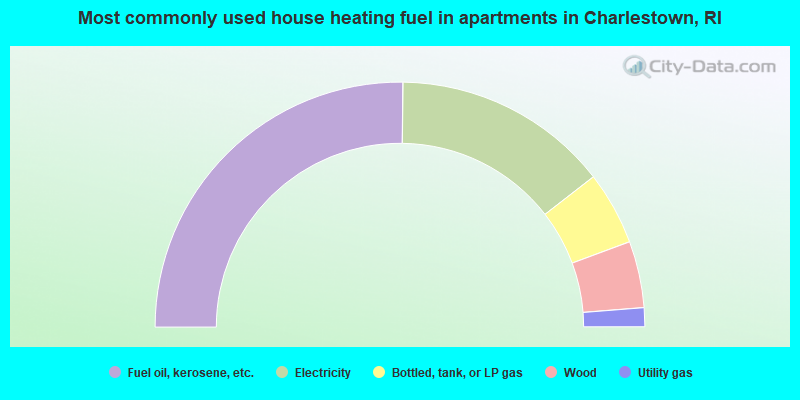
- 50.4%Fuel oil, kerosene, etc.
- 28.6%Electricity
- 9.7%Bottled, tank, or LP gas
- 8.8%Wood
- 2.5%Utility gas
Private vs. public school enrollment:
| Here: | 6.8% |
| Rhode Island: | 12.6% |
| Here: | 10.4% |
| Rhode Island: | 12.7% |
| Here: | 38.3% |
| Rhode Island: | 43.8% |


