Centerton, AR (Arkansas) Houses and Residents
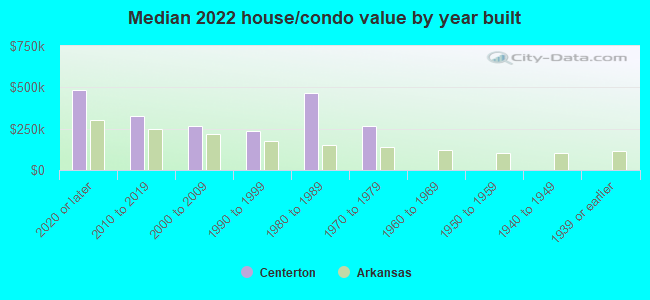
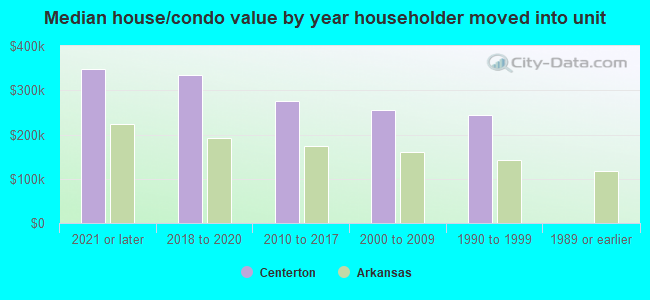
| Centerton: | $299,409 |
| Arkansas: | $179,800 |
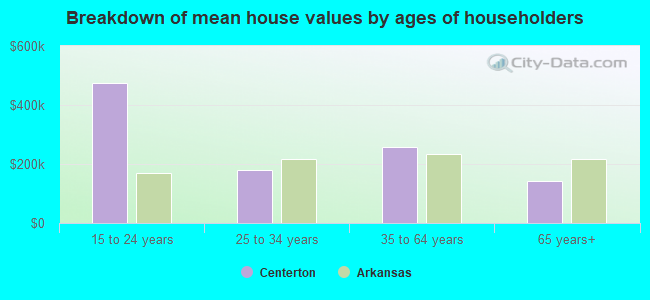
Mean price in 2022:
Detached houses: $287,559
Here: $287,559 State: $243,881 Townhouses or other attached units: $272,782
Here: $272,782 State: $244,376 Mobile homes: $45,759
Here: $45,759 State: $79,566
Total population: 11,193 (Urban population: 0, Rural population: 2,123 (22 farm, 2,101 nonfarm))
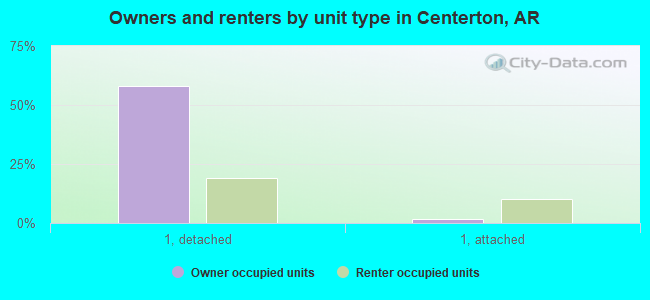
Houses: 7,698 (7,346 occupied: 4,986 owner occupied, 2,394 renter occupied)
| % of renters here: | 32% |
| State: | 34% |
Housing density: 1,915 houses/condos per square mile
Median price asked for vacant for-sale houses and condos in 2022: $62,311.
Median contract rent in 2022: $1,174 (lower quartile is $987, upper quartile is $1,312)
Median rent asked for vacant for-rent units in 2022: $813
Median gross rent in Centerton, AR in 2022: $1,311
Housing units in Centerton with a mortgage: 4,112 (137 second mortgage, 0 home equity loan, 94 both second mortgage and home equity loan)
Houses without a mortgage: 0
Median household income for houses/condos with a mortgage: $120,708
Median household income for apartments without a mortgage: $102,902
Median monthly housing costs: $1,350
Compare current foreclosures in Centerton, AR:
| Photo | Address | Area | Beds / Baths | Price | Details |
|---|---|---|---|---|---|

|
#1
Dassero Ct
Centerton, AR 72719
|
1,547 sq. feet
|
2 baths 3 beds |
show details | |

|
#2
Forest Drive
Centerton, AR 72719
|
1,526 sq. feet
|
2 baths 3 beds |
show details | |

|
#3
Timber Ridge St
Centerton, AR 72719
|
- sq. feet
|
2 baths 3 beds |
show details | |

|
#4
Shane Dr
Centerton, AR 72719
|
1,877 sq. feet
|
2 baths - beds |
show details | |

|
#5
Fern St
Centerton, AR 72719
|
1,200 sq. feet
|
2 baths - beds |
show details | |

|
#6
Olivia Ln
Centerton, AR 72719
|
1,300 sq. feet
|
2 baths - beds |
show details | |

|
#7
Sun Meadow Dr
Centerton, AR 72719
|
1,248 sq. feet
|
2 baths - beds |
show details | |

|
#8
Carlson St
Centerton, AR 72719
|
1,861 sq. feet
|
2 baths - beds |
show details | |

|
#9
Evergreen St
Centerton, AR 72719
|
1,523 sq. feet
|
2 baths - beds |
show details | |

|
#10
Harvest St
Centerton, AR 72719
|
1,770 sq. feet
|
2 baths - beds |
show details |
| Photo | Address | Area | Beds / Baths | Price | Details |
|---|---|---|---|---|---|

|
#11
Highway 279
Centerton, AR 72719
|
- sq. feet
|
- baths - beds |
show details | |

|
#12
Copper Oaks Dr
Centerton, AR 72719
|
- sq. feet
|
- baths - beds |
show details | |

|
#13
Meadowlands Dr
Centerton, AR 72719
|
- sq. feet
|
- baths - beds |
show details | |

|
#14
Meadowlands Dr
Centerton, AR 72719
|
- sq. feet
|
- baths - beds |
show details | |

|
#15
N B St
Centerton, AR 72719
|
- sq. feet
|
- baths - beds |
show details | |

|
#16
Forest Dr
Centerton, AR 72719
|
- sq. feet
|
- baths - beds |
show details | |

|
#17
Mckissic Spring Rd
Centerton, AR 72719
|
- sq. feet
|
- baths - beds |
show details | |

|
#18
W Centerton Blvd
Centerton, AR 72719
|
- sq. feet
|
- baths - beds |
show details | |

|
#19
Cisterna Dr
Centerton, AR 72719
|
- sq. feet
|
- baths - beds |
show details | |

|
#20
Greenbank Dr
Centerton, AR 72719
|
- sq. feet
|
- baths - beds |
show details |
| Photo | Address | Area | Beds / Baths | Price | Details |
|---|---|---|---|---|---|

|
#21
Amber Way
Centerton, AR 72719
|
- sq. feet
|
- baths - beds |
show details | |

|
#22
Tamarron Dr
Centerton, AR 72719
|
- sq. feet
|
- baths - beds |
show details | |

|
#23
Steepro Dr
Centerton, AR 72719
|
- sq. feet
|
- baths - beds |
show details | |

|
#24
Western Heights Cir
Centerton, AR 72719
|
- sq. feet
|
- baths - beds |
show details | |

|
#25
Appleridge Dr
Centerton, AR 72719
|
- sq. feet
|
- baths - beds |
show details | |

|
#26
Romano Ave
Centerton, AR 72719
|
- sq. feet
|
- baths - beds |
show details | |

|
#27
Kensington Dr
Centerton, AR 72719
|
- sq. feet
|
- baths - beds |
show details | |

|
#28
King Rd
Centerton, AR 72719
|
- sq. feet
|
- baths - beds |
show details | |

|
#29
Holly St
Centerton, AR 72719
|
- sq. feet
|
- baths - beds |
show details | |

|
#30
Spur Ln
Centerton, AR 72719
|
- sq. feet
|
- baths - beds |
show details |
| Photo | Address | Area | Beds / Baths | Price | Details |
|---|---|---|---|---|---|

|
#31
E Centerton Blvd Apt 633
Centerton, AR 72719
|
- sq. feet
|
- baths - beds |
show details | |

|
#32
Meadowlands Dr
Centerton, AR 72719
|
- sq. feet
|
- baths - beds |
show details | |

|
#33
Napoli Ln
Centerton, AR 72719
|
- sq. feet
|
- baths - beds |
show details | |

|
#34
Scotland Dr
Centerton, AR 72719
|
- sq. feet
|
- baths - beds |
show details | |

|
#35
Lakeview Dr
Centerton, AR 72719
|
- sq. feet
|
- baths - beds |
show details | |

|
#36
Brimwood St
Centerton, AR 72719
|
- sq. feet
|
- baths - beds |
show details | |

|
#37
E Centerton Blvd Apt 1017
Centerton, AR 72719
|
- sq. feet
|
- baths - beds |
show details | |

|
#38
Graystone Cir
Centerton, AR 72719
|
- sq. feet
|
- baths - beds |
show details | |

|
#39
Meadowlands Dr
Centerton, AR 72719
|
- sq. feet
|
- baths - beds |
show details | |

|
Check over 1 million property listings on Foreclosure.com!
|
browse all offers | |||

Latest news about housing in Centerton, AR collected exclusively by city-data.com from local newspapers, TV, and radio stations

 | Current Real Estate Market - July 2020 (19 replies) |
| Bentonville/Rogers crime? Homeschooling? Family friendly? (35 replies) |
| Homes with Acreage in Bentonville School District (10 replies) |
| Best NWA cities (16 replies) |
| The White Picket Fence - A symbol of the American Dream (42 replies) |
| Bella Vista bound (99 replies) |

Median year apartment built: 2011
Household type by relationship:
Households: 19,718- Male householders: 3,824 (925 living alone), Female householders: 3,428 (655 living alone)
4,224 spouses (4,168 opposite-sex spouses), 663 unmarried partners, (621 opposite-sex unmarried partners), 6,166 children (5,384 natural, 253 adopted, 528 stepchildren), 232 grandchildren, 184 brothers or sisters, 139 parents, 0 foster children, 337 other relatives, 476 non-relatives
- In group quarters: 39
Size of family households: 1,713 2-persons, 1,356 3-persons, 1,529 4-persons, 375 5-persons, 129 6-persons, 103 7-or-more-persons.
Size of nonfamily households: 1,730 1-person, 336 2-persons, 41 3-persons.
4,093 married couples with children.
807 single-parent households (213 men, 594 women).
90.5% of residents of Centerton speak English at home.
5.9% of residents speak Spanish at home (71% speak English very well, 19% speak English well, 9% speak English not well).
1.1% of residents speak other Indo-European language at home (93% speak English very well, 7% speak English not well).
1.7% of residents speak Asian or Pacific Island language at home (98% speak English very well, 2% speak English well).
1.1% of residents speak other language at home (45% speak English very well, 55% speak English well).
Foreign born population: 1,568 (8.0%)
(31.0% of them are naturalized citizens)
| Here: | 6.0 |
| State: | 6.1 |
| Here: | 4.6 |
| State: | 4.3 |
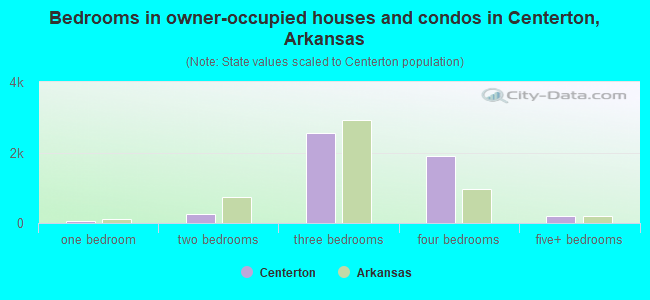
- Bedrooms in owner-occupied houses and condos in Centerton, Arkansas
- 0no bedroom
- 541 bedroom
- 2602 bedrooms
- 2,5533 bedrooms
- 1,9094 bedrooms
- 2115+ bedrooms
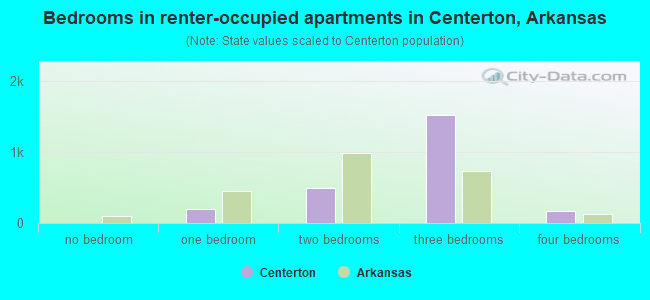
- Bedrooms in renter-occupied apartments in Centerton, Arkansas
- 0no bedroom
- 2031 bedroom
- 4932 bedrooms
- 1,5253 bedrooms
- 1734 bedrooms
- 05+ bedrooms
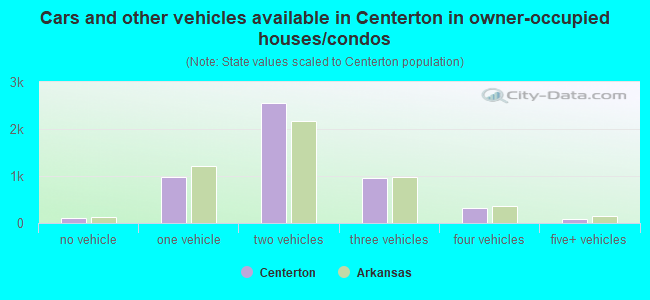
- Cars and other vehicles available in Centerton in owner-occupied houses/condos
- 104no vehicle
- 9821 vehicle
- 2,5462 vehicles
- 9493 vehicles
- 3264 vehicles
- 805+ vehicles
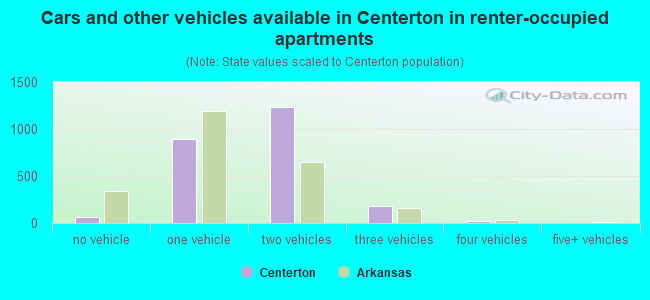
- Cars and other vehicles available in Centerton in renter-occupied apartments
- 62no vehicle
- 8921 vehicle
- 1,2312 vehicles
- 1853 vehicles
- 254 vehicles
- 05+ vehicles
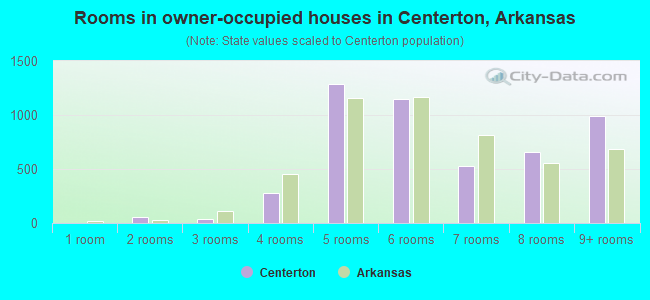
- Rooms in owner-occupied houses in Centerton, Arkansas
- 01 room
- 542 rooms
- 373 rooms
- 2814 rooms
- 1,2895 rooms
- 1,1506 rooms
- 5307 rooms
- 6568 rooms
- 9919+ rooms
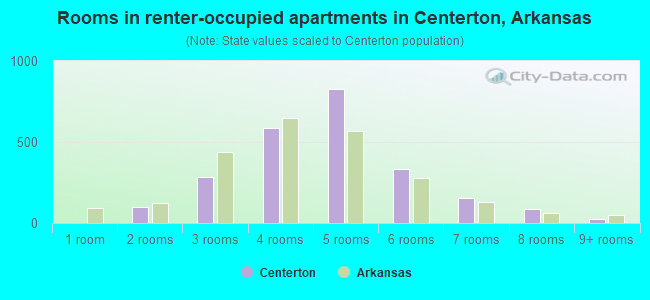
- Rooms in renter-occupied apartments in Centerton, Arkansas
- 01 room
- 962 rooms
- 2843 rooms
- 5894 rooms
- 8255 rooms
- 3336 rooms
- 1577 rooms
- 888 rooms
- 229+ rooms
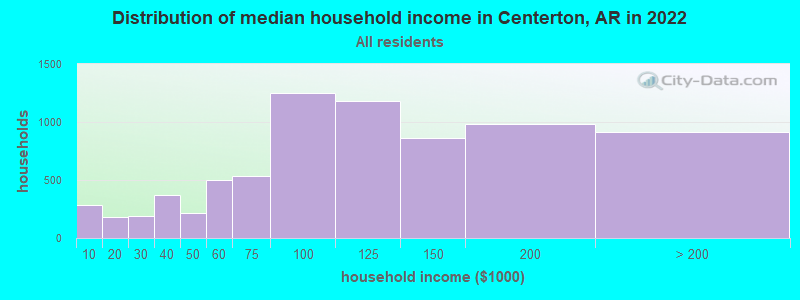
Centerton, AR household income distribution

- 282Less than $10,000
- 179$10,000 to $19,999
- 190$20,000 to $29,999
- 374$30,000 to $39,999
- 219$40,000 to $49,999
- 497$50,000 to $59,999
- 534$60,000 to $74,999
- 1,249$75,000 to $99,999
- 1,178$100,000 to $124,999
- 865$125,000 to $149,999
- 986$150,000 to $199,999
- 916$200,000 or more
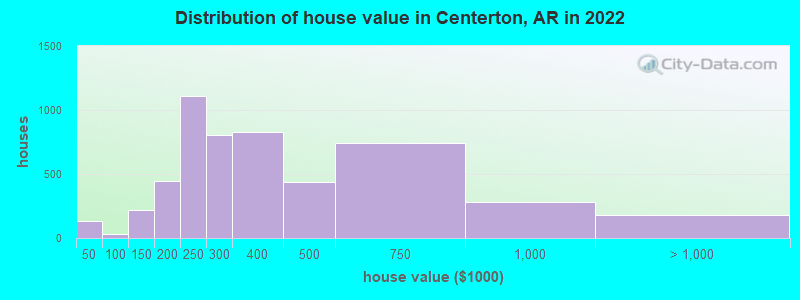
Home value of owner - occupied houses in 2022 in Centerton, AR
-
- 89$20,000 to $24,999
- 44$35,000 to $39,999
- 31$90,000 to $99,999
- 95$100,000 to $124,999
- 121$125,000 to $149,999
- 256$150,000 to $174,999
- 191$175,000 to $199,999
- 1,110$200,000 to $249,999
- 808$250,000 to $299,999
- 827$300,000 to $399,999
- 436$400,000 to $499,999
- 741$500,000 to $749,999
- 281$750,000 to $999,999
- 178$1,000,000 to $1,499,999
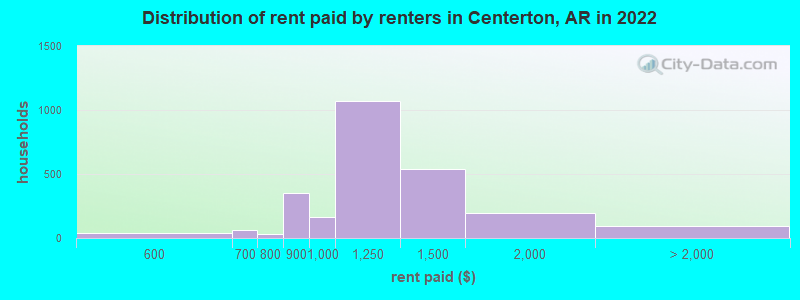
Rent paid by renters in 2022 in Centerton, AR
-
- 39$500 to $549
- 63$650 to $699
- 10$700 to $749
- 21$750 to $799
- 351$800 to $899
- 167$900 to $999
- 1,068$1,000 to $1,249
- 537$1,250 to $1,499
- 194$1,500 to $1,999
- 90No cash rent
Percentage of workers working in this county: 87.3%
Number of people working at home: 2,670 (23.4% of all workers)
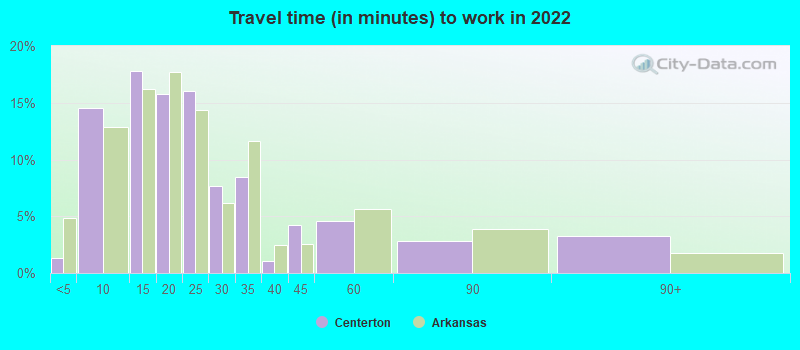
Travel time to work (commute)
- Less than 5 minutes: 131
- 5 to 9 minutes: 426
- 10 to 14 minutes: 896
- 15 to 19 minutes: 1,661
- 20 to 24 minutes: 2,160
- 25 to 29 minutes: 948
- 30 to 34 minutes: 1,700
- 35 to 39 minutes: 282
- 40 to 44 minutes: 171
- 45 to 59 minutes: 433
- 60 to 89 minutes: 197
- 90 or more minutes: 106
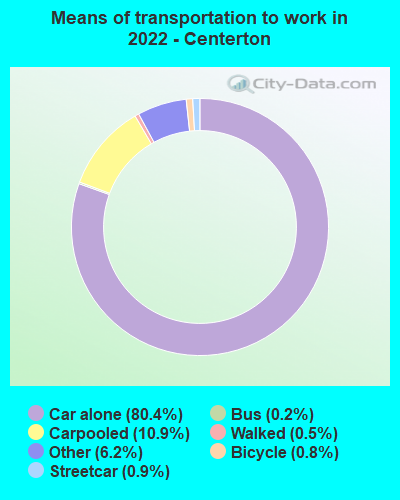
Means of transportation to work:
- Drove a car alone: 1,770 (40.4%)
- Carpooled: 229 (5.2%)
- Bus: 10 (0.2%)
- Subway or elevated rail: 20 (0.5%)
- Taxi: 151 (3.4%)
- Bicycle: 16 (0.4%)
- Walked: 18 (0.4%)
- Worked at home: 2,670 (61.0%)
- Unemployment by race in 2022
- Unemployment rate for White non-Hispanic residents
- 0.9%Males
- 1.1%Females
- Unemployment rate for Black residents
- 3.7%Females
- Unemployment rate for Asian residents
- 6.3%Males
- Unemployment rate for two or more race residents
- 0.7%Females
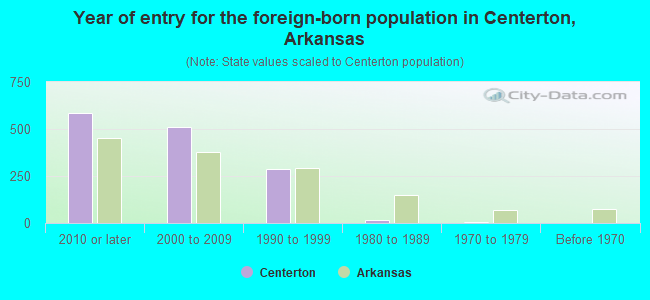
- Year of entry for the foreign-born population in Centerton, Arkansas
- 5862010 or later
- 5132000 to 2009
- 2871990 to 1999
- 161980 to 1989
- 41970 to 1979
- 2Before 1970
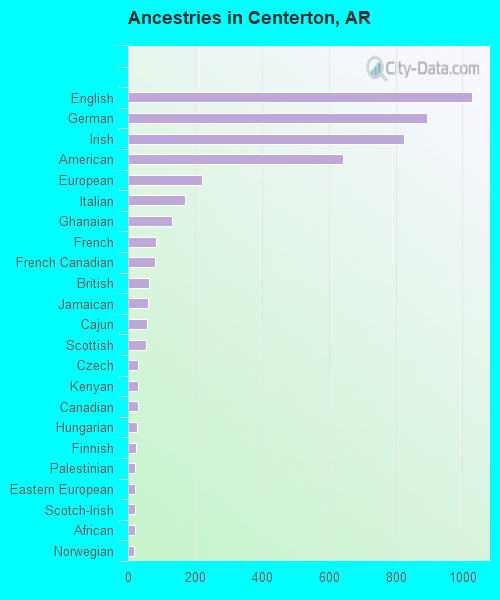
First ancestries reported:
- English: 1,028 (13.1%)
- German: 895 (11.4%)
- Irish: 824 (10.5%)
- American: 644 (8.2%)
- European: 220 (2.8%)
- Italian: 171 (2.2%)
- Ghanaian: 132 (1.7%)
- French: 85 (1.1%)
- French Canadian: 81 (1.0%)
- British: 62 (0.8%)
- Jamaican: 59 (0.7%)
- Cajun: 56 (0.7%)
- Scottish: 55 (0.7%)
- Czech: 31 (0.4%)
- Kenyan: 31 (0.4%)
- Canadian: 30 (0.4%)
- Hungarian: 28 (0.4%)
- Finnish: 23 (0.3%)
- Palestinian: 22 (0.3%)
- Eastern European: 22 (0.3%)
- Scotch-Irish: 21 (0.3%)
- African: 20 (0.3%)
- Norwegian: 17 (0.2%)
Most common places of birth for foreign-born residents (%):
| Centerton: | 29.5% (433) |
| Arkansas: | 40.2% (61,075) |
| Centerton: | 20.2% (296) |
| Arkansas: | 6.1% (9,278) |
| Centerton: | 9.4% (138) |
| Arkansas: | 0.6% (889) |
| Centerton: | 8.7% (128) |
| Arkansas: | 2.3% (3,503) |
| Centerton: | 4.8% (71) |
| Arkansas: | 2.7% (4,128) |
| Centerton: | 4.5% (66) |
| Arkansas: | 0.3% (425) |
| Centerton: | 4.0% (59) |
| Arkansas: | 0.2% (240) |
| Centerton: | 3.3% (49) |
| Arkansas: | 10.7% (16,210) |
| Centerton: | 2.2% (32) |
| Arkansas: | 0.9% (1,434) |
| Centerton: | 2.2% (32) |
| Arkansas: | 1.4% (2,174) |
| Centerton: | 2.1% (31) |
| Arkansas: | 0.3% (404) |
| Centerton: | 1.9% (28) |
| Arkansas: | 0.2% (267) |
| Centerton: | 1.6% (23) |
| Arkansas: | 0.3% (403) |
Place of birth for U.S.-born residents:
- This state: 7,762
- Other state: 10,059
- Northeast: 684
- Midwest: 2,664
- South: 3,790
- West: 2,998
81.7% of Centerton residents lived in the same house 1 years ago.
Out of people who lived in different houses, 35.4% lived in this county.
Out of people who lived in different counties, 45.1% lived in Arkansas.
| Centerton: | 81.7% |
| State average: | 87.0% |
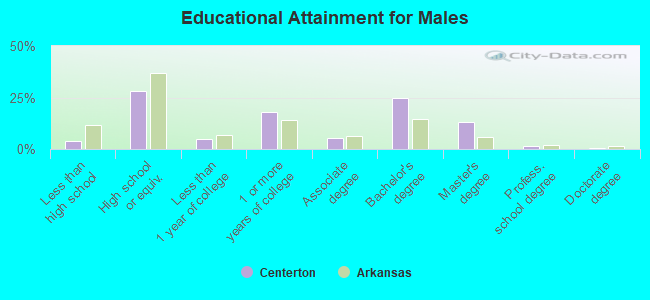
Education attainment for males 25 years and older:
- No schooling: 34
- Nursery to 4th grade: 0
- 5th and 6th grade: 0
- 7th and 8th grade: 20
- 9th grade: 0
- 10th grade: 75
- 11th grade: 82
- 12th grade, no diploma: 33
- High school graduate (or equivalency): 1,756
- Less than 1 year of college: 297
- Some college more than 1 year, no degree: 1,132
- Associate degree: 347
- Bachelor's degree: 1,555
- Master's degree: 818
- Professional school degree: 79
- Doctorate degree: 20
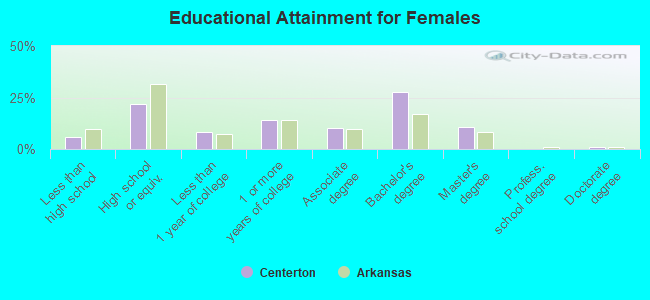
Education attainment for females 25 years and older:
- No schooling: 65
- Nursery to 4th grade: 32
- 5th and 6th grade: 91
- 7th and 8th grade: 73
- 9th grade: 33
- 10th grade: 5
- 11th grade: 29
- 12th grade, no diploma: 66
- High school graduate (or equivalency): 1,450
- Less than 1 year of college: 558
- Some college more than 1 year, no degree: 920
- Associate degree: 683
- Bachelor's degree: 1,842
- Master's degree: 693
- Professional school degree: 13
- Doctorate degree: 58


Housing units in structures:
- One, detached: 6,022
- One, attached: 890
- Two: 36
- 3 or 4: 38
- 5 to 9: 180
- 10 to 19: 213
- 20 to 49: 56
- 50 or more: 108
- Mobile homes: 150
Housing units lacking complete kitchen facilities in 2022: 2.0%
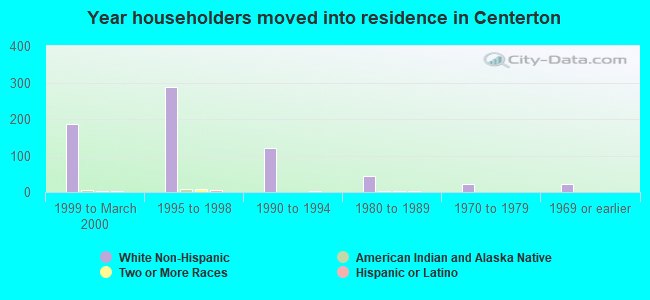
House/condo owner moved in on average 4 years ago
Renter moved in on average 1 years ago
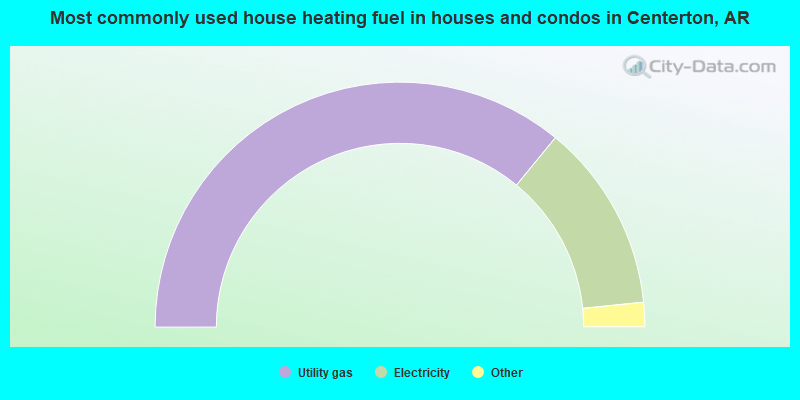
- 71.9%Utility gas
- 24.9%Electricity
- 1.6%Wood
- 1.1%Bottled, tank, or LP gas
- 0.6%Solar energy
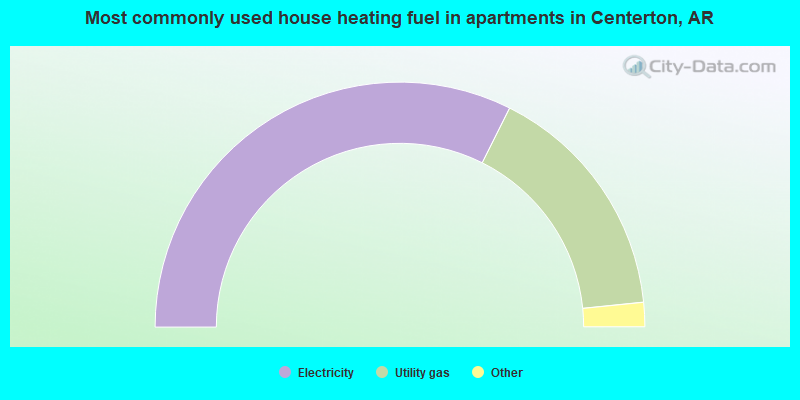
- 64.8%Electricity
- 32.0%Utility gas
- 1.6%Other fuel
- 0.9%No fuel used
- 0.7%Bottled, tank, or LP gas
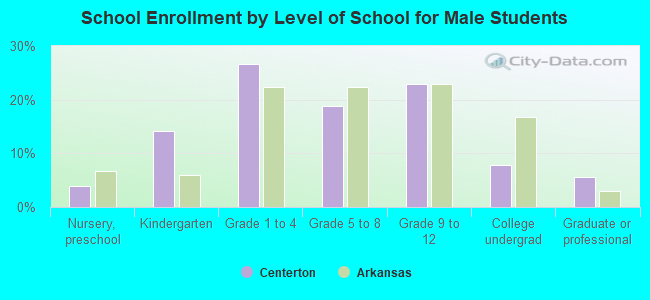
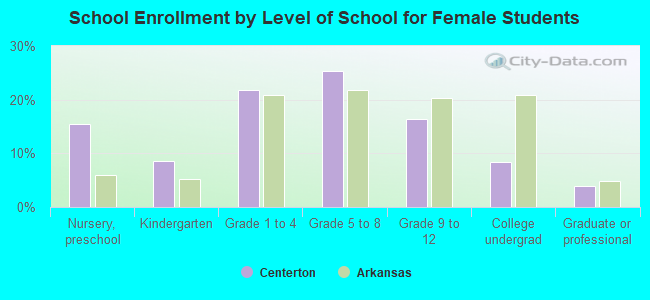
Private vs. public school enrollment:
| Here: | 6.2% |
| Arkansas: | 10.5% |
| Here: | 4.6% |
| Arkansas: | 8.7% |
| Here: | 10.5% |
| Arkansas: | 19.4% |