Jump to a detailed profile or search site with Google Custom Search

Castle Rock, CO (Colorado) Houses and Residents

Estimated median house or condo value in 2022: $661,700 (it was $184,300 in 2000)
Castle Rock:

$661,700
Colorado:

$531,100
Lower value quartile - upper value quartile: $540,800 - $819,800

Mean price in 2022:

Detached houses: $741,965
Here:

$741,965
State:

$676,667

Townhouses or other attached units: $497,158
Here:

$497,158
State:

$526,340

In 2-unit structures: $426,399
Here:

$426,399
State:

$431,509

In 3-to-4-unit structures: $303,992
Here:

$303,992
State:

$385,502

In 5-or-more-unit structures: $357,966
Here:

$357,966
State:

$417,586

Mobile homes: $114,681
Here:

$114,681
State:

$115,510

Total population: 55,747 (Urban population: 19,672 (all inside urban clusters), Rural population: 581 (all nonfarm))

Houses: 30,271 (29,068 occupied: 22,674 owner occupied, 6,394 renter occupied)

% of renters here:

22%
State:

34%

Housing density: 958 houses/condos per square mile

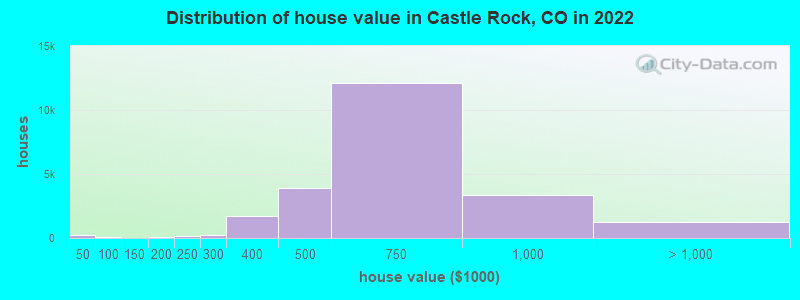
Median price asked for vacant for-sale houses and condos in 2022: $678,427.

Median contract rent in 2022: $1,653 (lower quartile is $1,333, upper quartile is $1,977)


Median rent asked for vacant for-rent units in 2022: $1,374


Median gross rent in Castle Rock, CO in 2022: $1,781

Housing units in Castle Rock with a mortgage: 19,169 (2,116 second mortgage, 165 home equity loan, 1,895 both second mortgage and home equity loan)
Houses without a mortgage: 411

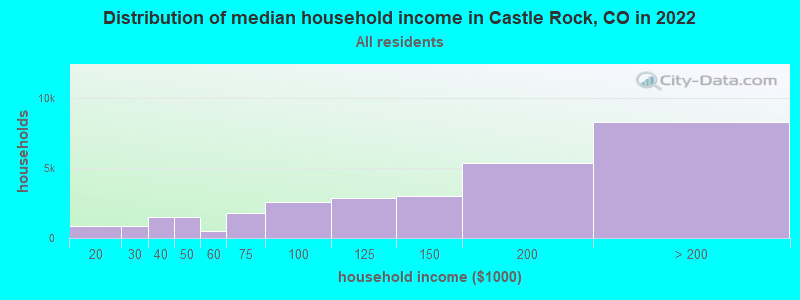
Median household income for houses/condos with a mortgage: $166,415

Median household income for apartments without a mortgage: $119,527

Median monthly housing costs: $2,175

Compare current foreclosures in Castle Rock, CO:

Check out more offers in Castle Rock, CO.
Powered by Foreclosure.com

Settings
X
Data:
Loading data...
Based on 2000-2022 data
Loading data...

123
Hide US histogram

Castle Rock, Colorado Age and Sex of Residents
Median year house/condo built: 2009

Median year apartment built: 2003

Household type by relationship:

Households: 80,192
  • Male householders: 14,402 (3,029 living alone), Female householders: 14,666 (2,605 living alone)
  • 18,495 spouses (18,100 opposite-sex spouses), 1,889 unmarried partners, (1,786 opposite-sex unmarried partners), 25,651 children (23,820 natural, 343 adopted, 1,488 stepchildren), 153 grandchildren, 211 brothers or sisters, 598 parents, 138 foster children, 676 other relatives, 2,767 non-relatives
  • In group quarters: 546

Size of family households: 8,503 2-persons, 5,899 3-persons, 3,753 4-persons, 1,926 5-persons, 395 6-persons, 706 7-or-more-persons.

Size of nonfamily households: 5,634 1-person, 1,850 2-persons, 269 3-persons, 133 5-persons.

15,788 married couples with children.
2,581 single-parent households (1,913 men, 668 women).

92.3% of residents of Castle Rock speak English at home.
4.6% of residents speak Spanish at home (70% speak English very well, 15% speak English well, 9% speak English not well, 6% don't speak English at all).
1.5% of residents speak other Indo-European language at home (93% speak English very well, 6% speak English well, 2% don't speak English at all).
1.0% of residents speak Asian or Pacific Island language at home (65% speak English very well, 20% speak English well, 15% speak English not well, 1% don't speak English at all).
0.3% of residents speak other language at home (96% speak English very well, 4% speak English well).

Foreign born population: 4,063 (5.1%)
(57.2% of them are naturalized citizens)

Median number of rooms in houses and condos:
Here:

8.0
State:

6.8

Median number of rooms in apartments
Here:

3.9
State:

4.0

Owner-occupied Renter-occupied
Bedrooms in owner-occupied houses and condos in Castle Rock, Colorado
  • Bedrooms in owner-occupied houses and condos in Castle Rock, Colorado
  • 0no bedroom
  • 851 bedroom
  • 1,3222 bedrooms
  • 8,1793 bedrooms
  • 7,1064 bedrooms
  • 5,9825+ bedrooms
Bedrooms in renter-occupied apartments in Castle Rock, Colorado
  • Bedrooms in renter-occupied apartments in Castle Rock, Colorado
  • 95no bedroom
  • 2,4201 bedroom
  • 2,3692 bedrooms
  • 9413 bedrooms
  • 3334 bedrooms
  • 2365+ bedrooms
Owner-occupied Renter-occupied
Cars and other vehicles available in Castle Rock in owner-occupied houses/condos
  • Cars and other vehicles available in Castle Rock in owner-occupied houses/condos
  • 85no vehicle
  • 3,1821 vehicle
  • 10,1432 vehicles
  • 6,9823 vehicles
  • 1,0994 vehicles
  • 1,1835+ vehicles
Cars and other vehicles available in Castle Rock in renter-occupied apartments
  • Cars and other vehicles available in Castle Rock in renter-occupied apartments
  • 309no vehicle
  • 3,3271 vehicle
  • 1,9592 vehicles
  • 7693 vehicles
  • 04 vehicles
  • 305+ vehicles
Owner-occupied Renter-occupied
Rooms in owner-occupied houses in Castle Rock, Colorado
  • Rooms in owner-occupied houses in Castle Rock, Colorado
  • 01 room
  • 852 rooms
  • 1343 rooms
  • 1,9964 rooms
  • 1,2645 rooms
  • 3,3786 rooms
  • 2,6057 rooms
  • 3,8508 rooms
  • 9,3629+ rooms
Rooms in renter-occupied apartments in Castle Rock, Colorado
  • Rooms in renter-occupied apartments in Castle Rock, Colorado
  • 951 room
  • 6982 rooms
  • 2,0063 rooms
  • 1,0324 rooms
  • 9465 rooms
  • 5346 rooms
  • 3307 rooms
  • 4768 rooms
  • 2779+ rooms
Year house built
Median 2022 house/condo value by year built
Median house/condo value by year householder moved into unit
Breakdown of mean house values by ages of householders
Owners and renters by unit type in Castle Rock, CO
  • Castle Rock, CO household income distribution

  • Distribution of median household income in Castle Rock, CO in 2022
  • 56Less than $10,000
  • 842$10,000 to $19,999
  • 859$20,000 to $29,999
  • 1,510$30,000 to $39,999
  • 1,515$40,000 to $49,999
  • 492$50,000 to $59,999
  • 1,802$60,000 to $74,999
  • 2,537$75,000 to $99,999
  • 2,862$100,000 to $124,999
  • 2,983$125,000 to $149,999
  • 5,351$150,000 to $199,999
  • 8,259$200,000 or more
  • Home value of owner - occupied houses in 2022 in Castle Rock, CO

  • Distribution of house value in Castle Rock, CO in 2022
  • 157Less than $10,000
  • 28$10,000 to $14,999
  • 11$30,000 to $34,999
  • 35$35,000 to $39,999
  • 27$40,000 to $49,999
  • 19$60,000 to $69,999
  • 25$100,000 to $124,999
  • 7$125,000 to $149,999
  • 54$150,000 to $174,999
  • 61$175,000 to $199,999
  • 128$200,000 to $249,999
  • 197$250,000 to $299,999
  • 1,706$300,000 to $399,999
  • 3,929$400,000 to $499,999
  • 12,124$500,000 to $749,999
  • 3,379$750,000 to $999,999
  • 880$1,000,000 to $1,499,999
  • 201$1,500,000 to $1,999,999
  • 150$2,000,000 or more
  • Rent paid by renters in 2022 in Castle Rock, CO

  • Distribution of rent paid by renters in Castle Rock, CO in 2022
  • 17Less than $100
  • 23$150 to $199
  • 14$400 to $449
  • 18$450 to $499
  • 28$550 to $599
  • 16$600 to $649
  • 15$700 to $749
  • 49$750 to $799
  • 75$800 to $899
  • 79$900 to $999
  • 392$1,000 to $1,249
  • 1,064$1,250 to $1,499
  • 2,281$1,500 to $1,999
  • 755$2,000 to $2,499
  • 659$2,500 to $2,999
  • 205$3,000 to $3,499
  • 214$3,500 or more
  • 127No cash rent
Time Leaving Home To Go To Work in 2022

Percentage of workers working in this county: 68.3%
Number of people working at home: 11,522 (27.7% of all workers)

Travel time (in minutes) to work in 2022

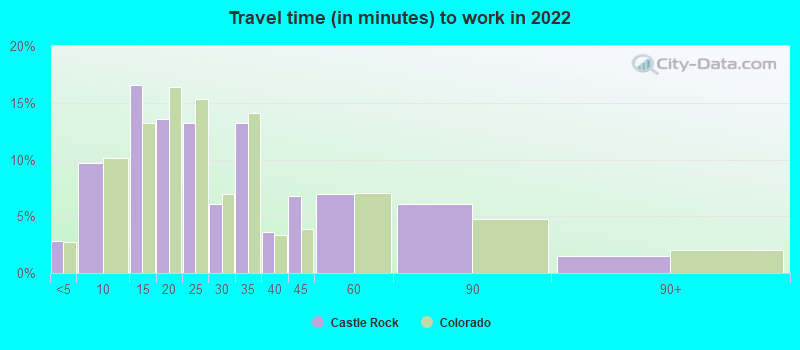
Travel time to work (commute)

  • Less than 5 minutes: 628
  • 5 to 9 minutes: 2,300
  • 10 to 14 minutes: 4,664
  • 15 to 19 minutes: 2,960
  • 20 to 24 minutes: 4,934
  • 25 to 29 minutes: 3,480
  • 30 to 34 minutes: 4,225
  • 35 to 39 minutes: 1,951
  • 40 to 44 minutes: 2,016
  • 45 to 59 minutes: 3,773
  • 60 to 89 minutes: 2,255
  • 90 or more minutes: 0
Means of transportation to work in 2022 - Castle Rock

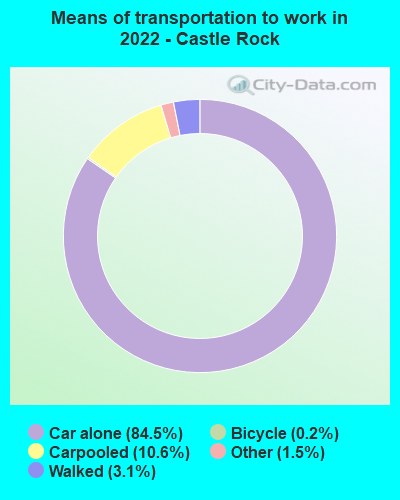
Means of transportation to work:

  • Drove a car alone: 16,418 (52.7%)
  • Carpooled: 2,333 (7.5%)
  • Bus: 19 (0.1%)
  • Taxi: 289 (0.9%)
  • Bicycle: 77 (0.2%)
  • Walked: 560 (1.8%)
  • Worked at home: 11,522 (37.0%)
Class of Workers in 2022
  • Unemployment by race in 2022
  • Unemployment rate for White non-Hispanic residents
  • 2.0%Males
  • 1.0%Females
  • Unemployment rate for Black residents
  • 9.5%Females
  • Unemployment rate for Asian residents
  • 2.3%Males
  • Unemployment rate for other race residents
  • 4.7%Females
  • Unemployment rate for two or more race residents
  • 1.7%Males
  • 3.6%Females
  • Unemployment rate for Hispanic or Latino residents
  • 3.5%Males
  • 5.0%Females
Year of entry for the foreign-born population in Castle Rock, Colorado
  • Year of entry for the foreign-born population in Castle Rock, Colorado
  • 1,2082010 or later
  • 7332000 to 2009
  • 1,1041990 to 1999
  • 1891980 to 1989
  • 1351970 to 1979
  • 152Before 1970
Ancestries in Castle Rock, CO

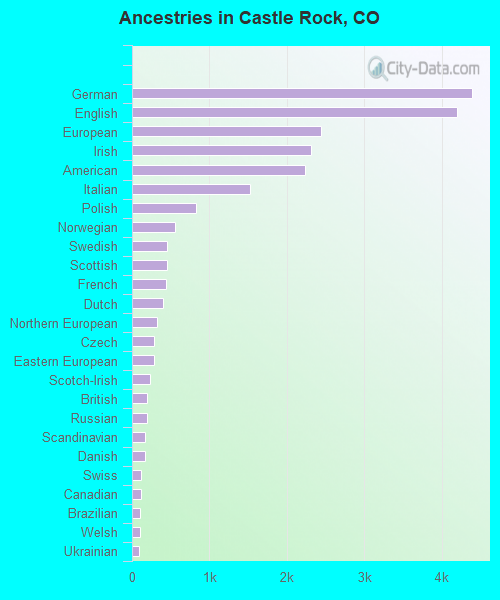
First ancestries reported:

  • German: 4,391 (13.6%)
  • English: 4,195 (13.0%)
  • European: 2,446 (7.6%)
  • Irish: 2,317 (7.2%)
  • American: 2,236 (6.9%)
  • Italian: 1,520 (4.7%)
  • Polish: 825 (2.6%)
  • Norwegian: 549 (1.7%)
  • Swedish: 453 (1.4%)
  • Scottish: 451 (1.4%)
  • French: 435 (1.3%)
  • Dutch: 401 (1.2%)
  • Northern European: 319 (1.0%)
  • Czech: 289 (0.9%)
  • Eastern European: 285 (0.9%)
  • Scotch-Irish: 232 (0.7%)
  • British: 190 (0.6%)
  • Russian: 188 (0.6%)
  • Scandinavian: 170 (0.5%)
  • Danish: 163 (0.5%)
  • Swiss: 120 (0.4%)
  • Canadian: 113 (0.4%)
  • Brazilian: 104 (0.3%)
  • Welsh: 103 (0.3%)
  • Ukrainian: 88 (0.3%)
  • Lebanese: 83 (0.3%)
  • Trinidadian and Tobagonian: 80 (0.2%)
  • French Canadian: 76 (0.2%)
  • Hungarian: 72 (0.2%)
  • Finnish: 69 (0.2%)
  • Lithuanian: 60 (0.2%)
  • Romanian: 50 (0.2%)
  • Yugoslavian: 41 (0.1%)
  • Greek: 38 (0.1%)
  • Belgian: 36 (0.1%)
  • African: 34 (0.1%)
  • Portuguese: 28 (0.09%)
  • Slovak: 21 (0.07%)
  • Egyptian: 18 (0.06%)
  • Slovene: 10 (0.03%)
  • Czechoslovakian: 8 (0.02%)
  • Jamaican: 4 (0.01%)
  • Pennsylvania German: 2 (0.01%)

Most common places of birth for foreign-born residents (%):

Mexico
Castle Rock:

30.5% (1,213)
Colorado:

38.3% (209,491)

Brazil
Castle Rock:

6.6% (264)
Colorado:

1.0% (5,365)

Colombia
Castle Rock:

4.8% (192)
Colorado:

1.1% (5,971)

China, excluding Hong Kong and Taiwan
Castle Rock:

4.6% (184)
Colorado:

3.3% (17,998)

Trinidad and Tobago
Castle Rock:

3.6% (144)
Colorado:

0.1% (422)

Philippines
Castle Rock:

3.5% (141)
Colorado:

2.3% (12,342)

India
Castle Rock:

3.3% (131)
Colorado:

4.0% (21,689)

Korea
Castle Rock:

3.3% (130)
Colorado:

2.9% (15,981)

Canada
Castle Rock:

2.8% (112)
Colorado:

2.7% (15,026)

Russia
Castle Rock:

2.4% (96)
Colorado:

1.4% (7,860)

Germany
Castle Rock:

2.2% (89)
Colorado:

2.5% (13,706)

England
Castle Rock:

2.1% (82)
Colorado:

1.2% (6,672)

Laos
Castle Rock:

1.9% (77)
Colorado:

0.4% (2,063)

United Kingdom, excluding England and Scotland
Castle Rock:

1.6% (64)
Colorado:

1.1% (5,799)

Place of birth for U.S.-born residents:

  • This state: 33,538
  • Other state: 41,555
  • Northeast: 5,170
  • Midwest: 15,395
  • South: 9,484
  • West: 11,506

83.6% of Castle Rock residents lived in the same house 1 years ago.
   Out of people who lived in different houses, 25.3% lived in this county.
   Out of people who lived in different counties, 54.2% lived in Colorado.


Castle Rock:

83.6%
State average:

83.6%

Education attainment for males 25 years and older:

  • No schooling: 211
  • Nursery to 4th grade: 0
  • 5th and 6th grade: 0
  • 7th and 8th grade: 0
  • 9th grade: 0
  • 10th grade: 0
  • 11th grade: 0
  • 12th grade, no diploma: 62
  • High school graduate (or equivalency): 3,327
  • Less than 1 year of college: 1,859
  • Some college more than 1 year, no degree: 4,994
  • Associate degree: 2,390
  • Bachelor's degree: 10,485
  • Master's degree: 3,032
  • Professional school degree: 555
  • Doctorate degree: 382
Educational Attainment for Males

Education attainment for females 25 years and older:

  • No schooling: 96
  • Nursery to 4th grade: 0
  • 5th and 6th grade: 53
  • 7th and 8th grade: 0
  • 9th grade: 0
  • 10th grade: 0
  • 11th grade: 0
  • 12th grade, no diploma: 123
  • High school graduate (or equivalency): 3,428
  • Less than 1 year of college: 712
  • Some college more than 1 year, no degree: 3,791
  • Associate degree: 3,825
  • Bachelor's degree: 9,902
  • Master's degree: 3,458
  • Professional school degree: 382
  • Doctorate degree: 174
Educational Attainment for Females
Castle Rock marital status for males
Castle Rock marital status for females

Housing units in structures:

  • One, detached: 22,040
  • One, attached: 2,206
  • 3 or 4: 69
  • 5 to 9: 1,352
  • 10 to 19: 1,543
  • 20 to 49: 1,768
  • 50 or more: 733
  • Mobile homes: 475
  • Boats, RVs, vans, etc.: 85
Housing units lacking complete plumbing facilities in 2022: 0.3%

Housing units lacking complete kitchen facilities in 2022: 0.3%

House/condo owner moved in on average 5 years ago

Renter moved in on average 0 years ago

Year householders moved into residence in Castle Rock
Houses and condos Apartments
Most commonly used house heating fuel in houses and condos in Castle Rock, CO
  • 84.4%Utility gas
  • 15.1%Electricity
  • 0.3%Bottled, tank, or LP gas
  • 0.1%Fuel oil, kerosene, etc.
Most commonly used house heating fuel in apartments in Castle Rock, CO
  • 54.5%Utility gas
  • 41.6%Electricity
  • 3.0%Bottled, tank, or LP gas
  • 0.5%Other fuel
  • 0.4%No fuel used

Private vs. public school enrollment:

Students in private schools in grades 1 to 8 (elementary and middle school): 515
Here:

5.8%
Colorado:

11.4%

Students in private schools in grades 9 to 12 (high school): 328
Here:

7.6%
Colorado:

8.5%

Students in private undergraduate colleges: 455
Here:

14.5%
Colorado:

14.0%
School Enrollment by Level of School for Male Students
School Enrollment by Level of School for Female Students
Age and Sex of Sensory-Disabled Noninstitutionalized Residents
Age and Sex of Physically-Disabled Noninstitutionalized Residents
Age and Sex of Mentally-Disabled Noninstitutionalized Residents
Age and Sex of Self-Care Disabled Noninstitutionalized Residents
Age and Sex of Go-Outside-Home Disabled Noninstitutionalized Residents
Age and Sex of Noninstitutionalized Residents with Employment Disability