Cary, NC (North Carolina) Houses and Residents
| Cary: | $567,100 |
| North Carolina: | $280,600 |
Mean price in 2022:
Detached houses: $662,970
Here: $662,970 State: $375,326 Townhouses or other attached units: $435,351
Here: $435,351 State: $317,935 In 2-unit structures: $294,423
Here: $294,423 State: $250,488 In 3-to-4-unit structures: $274,216
Here: $274,216 State: $254,939 In 5-or-more-unit structures: $250,197
Here: $250,197 State: $329,290 Mobile homes: $36,631
Here: $36,631 State: $124,933
Total population: 155,227 (Urban population: 94,345, Rural population: 185 (all nonfarm))
Houses: 76,310 (69,980 occupied: 46,824 owner occupied, 23,156 renter occupied)
| % of renters here: | 33% |
| State: | 33% |
Housing density: 1,813 houses/condos per square mile
Median price asked for vacant for-sale houses and condos in 2022: $277,604.
Median contract rent in 2022: $1,420 (lower quartile is $1,126, upper quartile is $1,848)
Median rent asked for vacant for-rent units in 2022: $2,648
Median gross rent in Cary, NC in 2022: $1,548
Housing units in Cary with a mortgage: 33,308 (4,236 second mortgage, 0 home equity loan, 4,032 both second mortgage and home equity loan)
Houses without a mortgage: 1,017
Median household income for houses/condos with a mortgage: $157,082
Median household income for apartments without a mortgage: $124,940
Median monthly housing costs: $1,642
Compare current foreclosures in Cary, NC:
| Photo | Address | Area | Beds / Baths | Price | Details |
|---|---|---|---|---|---|

|
#1
Michigan Ave
Cary, NC 27519
|
1,700 sq. feet
|
3 baths 3 beds |
show details | |

|
#2
Clancy Cir
Cary, NC 27511
|
1,482 sq. feet
|
2 baths - beds |
show details | |

|
#3
Swan Quarter Dr
Cary, NC 27519
|
2,151 sq. feet
|
2 baths - beds |
show details | |

|
#4
Arvo Ln
Cary, NC 27513
|
1,546 sq. feet
|
2 baths - beds |
show details | |

|
#5
Virens Dr
Cary, NC 27511
|
1,436 sq. feet
|
2 baths - beds |
show details | |

|
#6
Ralph Dr
Cary, NC 27511
|
1,192 sq. feet
|
1 baths - beds |
show details | |

|
#7
Belrose Dr
Cary, NC 27513
|
3,443 sq. feet
|
3 baths - beds |
show details | |

|
#8
Lake Brandt Dr
Cary, NC 27519
|
2,245 sq. feet
|
2 baths - beds |
show details | |

|
#9
Macedonia Lake Dr
Cary, NC 27518
|
2,282 sq. feet
|
3 baths - beds |
show details | |

|
#10
Mccrimmon Pkwy
Cary, NC 27519
|
3,315 sq. feet
|
3 baths - beds |
show details |
| Photo | Address | Area | Beds / Baths | Price | Details |
|---|---|---|---|---|---|

|
#11
Matheson Pl
Cary, NC 27511
|
1,499 sq. feet
|
2 baths - beds |
show details | |

|
#12
Royal Tower Way
Cary, NC 27513
|
4,205 sq. feet
|
3 baths - beds |
show details | |

|
#13
Madison Ave
Cary, NC 27513
|
2,060 sq. feet
|
3 baths - beds |
show details | |

|
#14
Remington Oaks Cir
Cary, NC 27519
|
1,682 sq. feet
|
2 baths - beds |
show details | |

|
#15
Loch Lomond Cir
Cary, NC 27511
|
1,979 sq. feet
|
2 baths - beds |
show details | |

|
#16
Mardonie Reach Ln
Cary, NC 27519
|
1,622 sq. feet
|
2 baths - beds |
show details | |

|
#17
Drakewood Pl
Cary, NC 27518
|
3,428 sq. feet
|
3 baths - beds |
show details | |

|
#18
Ellynn Dr
Cary, NC 27511
|
2,211 sq. feet
|
2 baths - beds |
show details | |

|
#19
Oxyard Way
Cary, NC 27519
|
2,719 sq. feet
|
2 baths - beds |
show details | |

|
#20
Seattle Slew Ln
Cary, NC 27519
|
1,819 sq. feet
|
2 baths - beds |
show details |
| Photo | Address | Area | Beds / Baths | Price | Details |
|---|---|---|---|---|---|

|
#21
Colonial Townes Ct
Cary, NC 27511
|
1,274 sq. feet
|
2 baths - beds |
show details | |

|
#22
Skipwyth Cir
Cary, NC 27513
|
1,463 sq. feet
|
2 baths - beds |
show details | |

|
#23
Normandale Dr
Cary, NC 27513
|
2,536 sq. feet
|
3 baths - beds |
show details | |

|
#24
Green Level West Rd
Cary, NC 27519
|
2,013 sq. feet
|
3 baths - beds |
show details | |

|
#25
Linden Park Ln
Cary, NC 27519
|
1,982 sq. feet
|
2 baths - beds |
show details | |

|
#26
Linden Park Ln
Cary, NC 27519
|
2,004 sq. feet
|
3 baths - beds |
show details | |

|
#27
S West St
Cary, NC 27511
|
890 sq. feet
|
1 baths - beds |
show details | |

|
#28
Hickorywood Blvd
Cary, NC 27519
|
2,474 sq. feet
|
2 baths - beds |
show details | |

|
#29
W Marilyn Cir
Cary, NC 27513
|
1,715 sq. feet
|
2 baths - beds |
show details | |

|
#30
Bronte Ln Apt 4202
Cary, NC 27513
|
- sq. feet
|
- baths - beds |
show details |
| Photo | Address | Area | Beds / Baths | Price | Details |
|---|---|---|---|---|---|

|
#31
Langdale Pl
Cary, NC 27513
|
- sq. feet
|
- baths - beds |
show details | |

|
#32
Duden Ct Apt E
Cary, NC 27513
|
- sq. feet
|
- baths - beds |
show details | |

|
#33
Citadel Creek Ln
Cary, NC 27519
|
- sq. feet
|
- baths - beds |
show details | |

|
#34
Magnolia Woods Dr
Cary, NC 27518
|
3,094 sq. feet
|
- baths - beds |
show details | |

|
#35
Ryan Rd # 410
Cary, NC 27511
|
- sq. feet
|
- baths - beds |
show details | |

|
#36
Fumagalli Dr
Cary, NC 27519
|
- sq. feet
|
- baths - beds |
show details | |

|
#37
Preston Grove Ave
Cary, NC 27513
|
- sq. feet
|
- baths - beds |
show details | |

|
#38
Sedgebrook Dr
Cary, NC 27511
|
- sq. feet
|
- baths - beds |
show details | |

|
#39
Hyde Park Ct Apt P
Cary, NC 27513
|
- sq. feet
|
- baths - beds |
show details | |

|
#40
Regency Pkwy
Cary, NC 27518
|
- sq. feet
|
- baths - beds |
show details |
| Photo | Address | Area | Beds / Baths | Price | Details |
|---|---|---|---|---|---|

|
#41
Kempthorne Rd
Cary, NC 27519
|
- sq. feet
|
- baths - beds |
show details | |

|
#42
Ballena Cir
Cary, NC 27513
|
- sq. feet
|
- baths - beds |
show details | |

|
#43
Legault Dr
Cary, NC 27513
|
3,287 sq. feet
|
- baths - beds |
show details | |

|
#44
Pine Perch St
Cary, NC 27519
|
- sq. feet
|
- baths - beds |
show details | |

|
#45
Promontory Point Dr
Cary, NC 27513
|
2,607 sq. feet
|
- baths - beds |
show details | |

|
#46
Barthel Dr
Cary, NC 27513
|
2,469 sq. feet
|
- baths - beds |
show details | |

|
#47
N Harrison Ave
Cary, NC 27513
|
- sq. feet
|
- baths - beds |
show details | |

|
#48
Rexford Ln
Cary, NC 27518
|
- sq. feet
|
- baths - beds |
show details | |

|
#49
Preston Grove Ave
Cary, NC 27513
|
- sq. feet
|
- baths - beds |
show details | |

|
Check over 1 million property listings on Foreclosure.com!
|
browse all offers | |||

Latest news about housing in Cary, NC collected exclusively by city-data.com from local newspapers, TV, and radio stations

 | Looking For Rental Apartments, Condos or Homes with Hardwood Floors Throughout (0 replies) |
| New houses in Cary in the low low 400ks? (74 replies) |
| Raleigh and Cary apartment or condo rental? (13 replies) |
| Opinion on Cary apartments? (25 replies) |
| Quality of condos/townhomes in the < 175K range (9 replies) |
| Condo vs Townhouse vs Single Home (20 replies) |

Median year apartment built: 2005
Household type by relationship:
Households: 179,256- Male householders: 39,404 (7,498 living alone), Female householders: 30,576 (10,072 living alone)
42,586 spouses (42,379 opposite-sex spouses), 2,233 unmarried partners, (2,044 opposite-sex unmarried partners), 49,543 children (47,392 natural, 1,594 adopted, 557 stepchildren), 1,484 grandchildren, 1,947 brothers or sisters, 3,912 parents, 97 foster children, 2,668 other relatives, 4,431 non-relatives
- In group quarters: 375
Size of family households: 21,929 2-persons, 11,616 3-persons, 11,394 4-persons, 2,999 5-persons, 1,098 6-persons, 185 7-or-more-persons.
Size of nonfamily households: 17,570 1-person, 2,750 2-persons, 118 3-persons, 104 4-persons, 217 5-persons.
31,256 married couples with children.
5,212 single-parent households (1,736 men, 3,476 women).
74.1% of residents of Cary speak English at home.
4.7% of residents speak Spanish at home (69% speak English very well, 19% speak English well, 7% speak English not well, 4% don't speak English at all).
9.0% of residents speak other Indo-European language at home (74% speak English very well, 20% speak English well, 4% speak English not well, 2% don't speak English at all).
12.6% of residents speak Asian or Pacific Island language at home (76% speak English very well, 18% speak English well, 5% speak English not well, 2% don't speak English at all).
1.6% of residents speak other language at home (84% speak English very well, 13% speak English well, 3% speak English not well).
Foreign born population: 44,669 (24.9%)
(53.0% of them are naturalized citizens)
| Here: | 7.8 |
| State: | 6.4 |
| Here: | 4.0 |
| State: | 4.4 |

- Bedrooms in owner-occupied houses and condos in Cary, North Carolina
- 153no bedroom
- 1361 bedroom
- 2,7592 bedrooms
- 16,1433 bedrooms
- 18,1504 bedrooms
- 9,4835+ bedrooms

- Bedrooms in renter-occupied apartments in Cary, North Carolina
- 639no bedroom
- 6,7591 bedroom
- 8,7342 bedrooms
- 4,8473 bedrooms
- 1,8904 bedrooms
- 2875+ bedrooms

- Cars and other vehicles available in Cary in owner-occupied houses/condos
- 776no vehicle
- 9,9181 vehicle
- 25,8912 vehicles
- 8,0293 vehicles
- 1,8744 vehicles
- 3365+ vehicles

- Cars and other vehicles available in Cary in renter-occupied apartments
- 2,540no vehicle
- 11,9721 vehicle
- 7,1052 vehicles
- 8883 vehicles
- 6014 vehicles
- 505+ vehicles

- Rooms in owner-occupied houses in Cary, North Carolina
- 1531 room
- 02 rooms
- 2693 rooms
- 1,1634 rooms
- 4,9755 rooms
- 6,1156 rooms
- 7,8807 rooms
- 8,3018 rooms
- 17,9689+ rooms

- Rooms in renter-occupied apartments in Cary, North Carolina
- 6391 room
- 2,7072 rooms
- 4,9553 rooms
- 6,2964 rooms
- 3,3675 rooms
- 1,9466 rooms
- 1,8227 rooms
- 4618 rooms
- 9639+ rooms


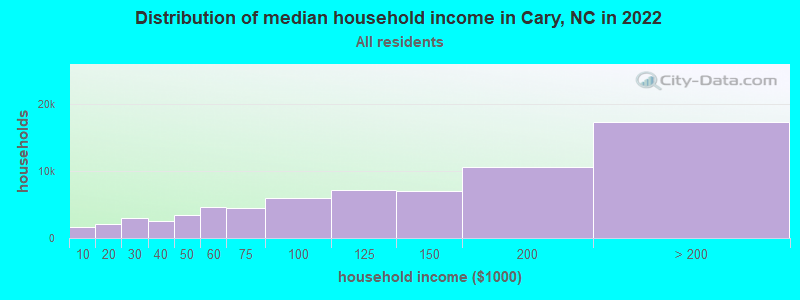
Cary, NC household income distribution

- 1,633Less than $10,000
- 2,050$10,000 to $19,999
- 2,932$20,000 to $29,999
- 2,537$30,000 to $39,999
- 3,396$40,000 to $49,999
- 4,698$50,000 to $59,999
- 4,478$60,000 to $74,999
- 5,969$75,000 to $99,999
- 7,240$100,000 to $124,999
- 7,023$125,000 to $149,999
- 10,653$150,000 to $199,999
- 17,371$200,000 or more
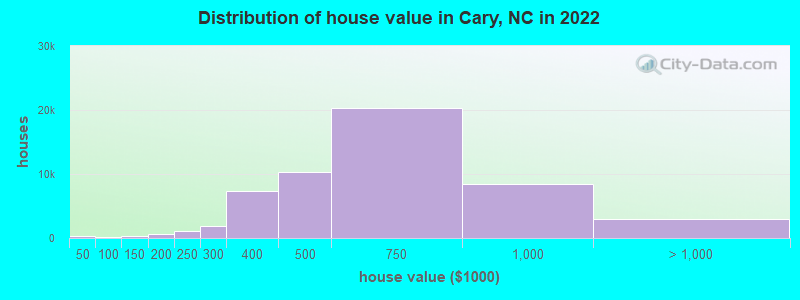
Home value of owner - occupied houses in 2022 in Cary, NC
-
- 86Less than $10,000
- 74$10,000 to $14,999
- 34$15,000 to $19,999
- 38$20,000 to $24,999
- 17$25,000 to $29,999
- 39$30,000 to $34,999
- 17$35,000 to $39,999
- 14$40,000 to $49,999
- 70$50,000 to $59,999
- 82$60,000 to $69,999
- 4$70,000 to $79,999
- 10$80,000 to $89,999
- 51$90,000 to $99,999
- 209$100,000 to $124,999
- 103$125,000 to $149,999
- 299$150,000 to $174,999
- 373$175,000 to $199,999
- 1,043$200,000 to $249,999
- 1,901$250,000 to $299,999
- 7,352$300,000 to $399,999
- 10,353$400,000 to $499,999
- 20,272$500,000 to $749,999
- 8,397$750,000 to $999,999
- 2,254$1,000,000 to $1,499,999
- 242$1,500,000 to $1,999,999
- 468$2,000,000 or more
Rent paid by renters in 2022 in Cary, NC
-
- 74Less than $100
- 30$150 to $199
- 43$250 to $299
- 56$300 to $349
- 28$350 to $399
- 156$400 to $449
- 25$450 to $499
- 116$500 to $549
- 33$550 to $599
- 64$600 to $649
- 165$650 to $699
- 135$700 to $749
- 248$750 to $799
- 553$800 to $899
- 954$900 to $999
- 4,292$1,000 to $1,249
- 5,101$1,250 to $1,499
- 6,804$1,500 to $1,999
- 2,170$2,000 to $2,499
- 1,072$2,500 to $2,999
- 62$3,000 to $3,499
- 922$3,500 or more
- 540No cash rent


Percentage of workers working in this county: 88.3%
Number of people working at home: 35,277 (36.5% of all workers)
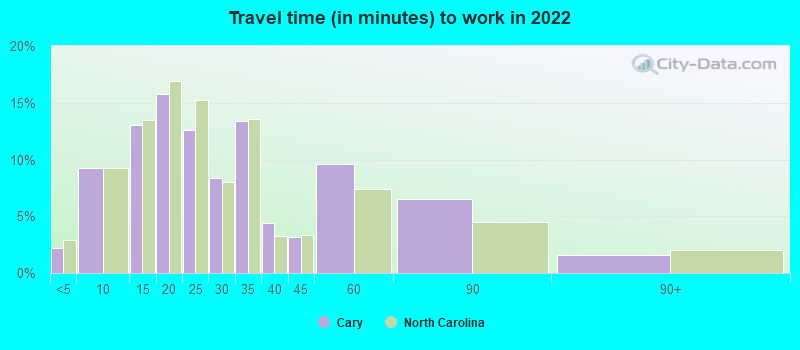
Travel time to work (commute)
- Less than 5 minutes: 1,019
- 5 to 9 minutes: 6,551
- 10 to 14 minutes: 7,648
- 15 to 19 minutes: 12,999
- 20 to 24 minutes: 10,145
- 25 to 29 minutes: 6,054
- 30 to 34 minutes: 5,721
- 35 to 39 minutes: 2,706
- 40 to 44 minutes: 915
- 45 to 59 minutes: 1,819
- 60 to 89 minutes: 1,184
- 90 or more minutes: 1,044
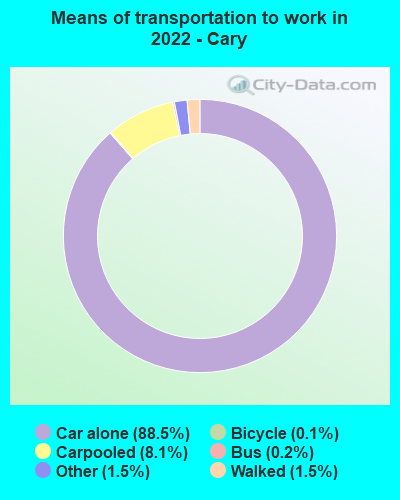
Means of transportation to work:
- Drove a car alone: 69,176 (61.2%)
- Carpooled: 6,774 (6.0%)
- Bus: 135 (0.1%)
- Subway or elevated rail: 9 (0.0%)
- Taxi: 1,697 (1.5%)
- Bicycle: 152 (0.1%)
- Walked: 1,637 (1.4%)
- Worked at home: 35,277 (31.2%)

- Unemployment by race in 2022
- Unemployment rate for White non-Hispanic residents
- 1.4%Males
- 1.8%Females
- Unemployment rate for Black residents
- 3.5%Males
- 2.9%Females
- Unemployment rate for Asian residents
- 0.6%Males
- 3.0%Females
- Unemployment rate for other race residents
- 0.8%Males
- 3.8%Females
- Unemployment rate for two or more race residents
- 1.8%Males
- 5.2%Females
- Unemployment rate for Hispanic or Latino residents
- 4.5%Males
- 6.0%Females

- Year of entry for the foreign-born population in Cary, North Carolina
- 18,0102010 or later
- 10,3442000 to 2009
- 9,2081990 to 1999
- 2,9051980 to 1989
- 1,2881970 to 1979
- 1,101Before 1970
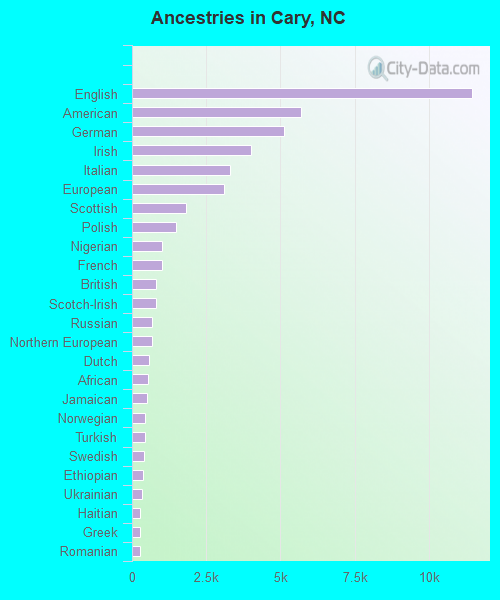
First ancestries reported:
- English: 11,457 (11.4%)
- American: 5,685 (5.7%)
- German: 5,110 (5.1%)
- Irish: 3,999 (4.0%)
- Italian: 3,300 (3.3%)
- European: 3,091 (3.1%)
- Scottish: 1,827 (1.8%)
- Polish: 1,490 (1.5%)
- Nigerian: 1,018 (1.0%)
- French: 1,009 (1.0%)
- British: 821 (0.8%)
- Scotch-Irish: 796 (0.8%)
- Russian: 686 (0.7%)
- Northern European: 661 (0.7%)
- Dutch: 569 (0.6%)
- African: 555 (0.6%)
- Jamaican: 499 (0.5%)
- Norwegian: 453 (0.5%)
- Turkish: 448 (0.4%)
- Swedish: 421 (0.4%)
- Ethiopian: 371 (0.4%)
- Ukrainian: 335 (0.3%)
- Haitian: 285 (0.3%)
- Greek: 283 (0.3%)
- Romanian: 270 (0.3%)
- Canadian: 260 (0.3%)
- Welsh: 252 (0.3%)
- Scandinavian: 248 (0.2%)
- Jordanian: 244 (0.2%)
- Somali: 233 (0.2%)
- Lebanese: 220 (0.2%)
- Eastern European: 220 (0.2%)
- French Canadian: 206 (0.2%)
- Iranian: 197 (0.2%)
- Lithuanian: 188 (0.2%)
- Slovak: 188 (0.2%)
- Palestinian: 186 (0.2%)
- Moroccan: 180 (0.2%)
- Egyptian: 171 (0.2%)
- Hungarian: 166 (0.2%)
- Swiss: 146 (0.1%)
- Finnish: 137 (0.1%)
- Armenian: 131 (0.1%)
- Bulgarian: 129 (0.1%)
- Arab: 128 (0.1%)
- Liberian: 122 (0.1%)
- Danish: 113 (0.1%)
- Afghan: 109 (0.1%)
- Icelander: 98 (0.10%)
- Albanian: 88 (0.09%)
- Portuguese: 86 (0.09%)
- Czech: 80 (0.08%)
- Croatian: 80 (0.08%)
- Trinidadian and Tobagonian: 79 (0.08%)
- Syrian: 71 (0.07%)
- Sudanese: 67 (0.07%)
- British West Indian: 61 (0.06%)
- West Indian: 59 (0.06%)
- Yugoslavian: 56 (0.06%)
- Brazilian: 46 (0.05%)
- Slovene: 44 (0.04%)
- Kenyan: 36 (0.04%)
- Cypriot: 33 (0.03%)
- Luxembourger: 32 (0.03%)
- Cajun: 32 (0.03%)
- Czechoslovakian: 31 (0.03%)
- Senegalese: 28 (0.03%)
- South African: 23 (0.02%)
- Slavic: 17 (0.02%)
- Austrian: 15 (0.01%)
- Belgian: 14 (0.01%)
- Bahamian: 10 (0.01%)
- Barbadian: 10 (0.01%)
- Celtic: 9 (0.01%)
- Serbian: 8 (0.01%)
- Assyrian: 6 (0.01%)
Most common places of birth for foreign-born residents (%):
| Cary: | 39.9% (16,781) |
| North Carolina: | 9.3% (80,594) |
| Cary: | 9.4% (3,942) |
| North Carolina: | 3.2% (27,477) |
| Cary: | 3.7% (1,547) |
| North Carolina: | 24.7% (214,776) |
| Cary: | 3.2% (1,327) |
| North Carolina: | 2.1% (18,105) |
| Cary: | 2.6% (1,110) |
| North Carolina: | 1.8% (15,988) |
| Cary: | 2.4% (991) |
| North Carolina: | 0.9% (8,067) |
| Cary: | 1.8% (775) |
| North Carolina: | 2.9% (24,965) |
| Cary: | 1.7% (717) |
| North Carolina: | 1.2% (9,986) |
| Cary: | 1.6% (687) |
| North Carolina: | 0.4% (3,524) |
| Cary: | 1.6% (669) |
| North Carolina: | 1.1% (9,831) |
Place of birth for U.S.-born residents:
- This state: 48,196
- Other state: 83,362
- Northeast: 27,173
- Midwest: 18,013
- South: 27,310
- West: 10,866
86.6% of Cary residents lived in the same house 1 years ago.
Out of people who lived in different houses, 32.6% lived in this county.
Out of people who lived in different counties, 21.1% lived in North Carolina.
| Cary: | 86.6% |
| State average: | 87.3% |
Education attainment for males 25 years and older:
- No schooling: 660
- Nursery to 4th grade: 64
- 5th and 6th grade: 126
- 7th and 8th grade: 141
- 9th grade: 120
- 10th grade: 128
- 11th grade: 359
- 12th grade, no diploma: 503
- High school graduate (or equivalency): 4,449
- Less than 1 year of college: 1,503
- Some college more than 1 year, no degree: 5,150
- Associate degree: 3,025
- Bachelor's degree: 25,944
- Master's degree: 14,396
- Professional school degree: 2,507
- Doctorate degree: 3,627

Education attainment for females 25 years and older:
- No schooling: 553
- Nursery to 4th grade: 0
- 5th and 6th grade: 304
- 7th and 8th grade: 599
- 9th grade: 0
- 10th grade: 102
- 11th grade: 448
- 12th grade, no diploma: 417
- High school graduate (or equivalency): 5,559
- Less than 1 year of college: 2,336
- Some college more than 1 year, no degree: 4,437
- Associate degree: 4,845
- Bachelor's degree: 24,968
- Master's degree: 15,643
- Professional school degree: 2,096
- Doctorate degree: 2,427


Housing units in structures:
- One, detached: 45,121
- One, attached: 9,036
- Two: 713
- 3 or 4: 479
- 5 to 9: 4,527
- 10 to 19: 6,485
- 20 to 49: 4,387
- 50 or more: 5,232
- Mobile homes: 330
Housing units lacking complete kitchen facilities in 2022: 1.1%
House/condo owner moved in on average 10 years ago
Renter moved in on average 1 years ago

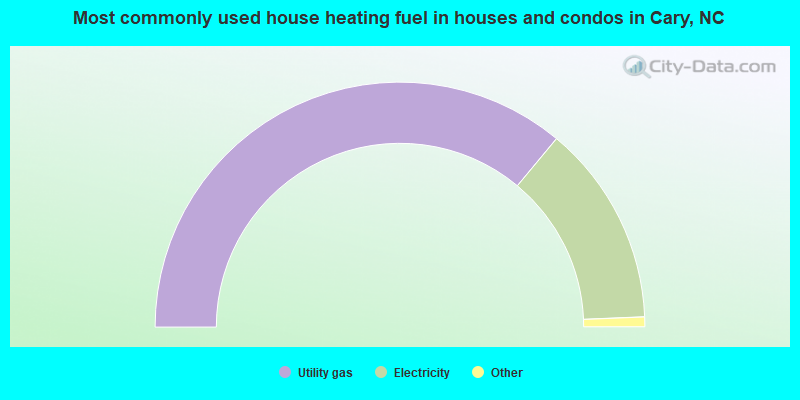
- 72.1%Utility gas
- 26.6%Electricity
- 0.8%Bottled, tank, or LP gas
- 0.2%No fuel used
- 0.1%Solar energy
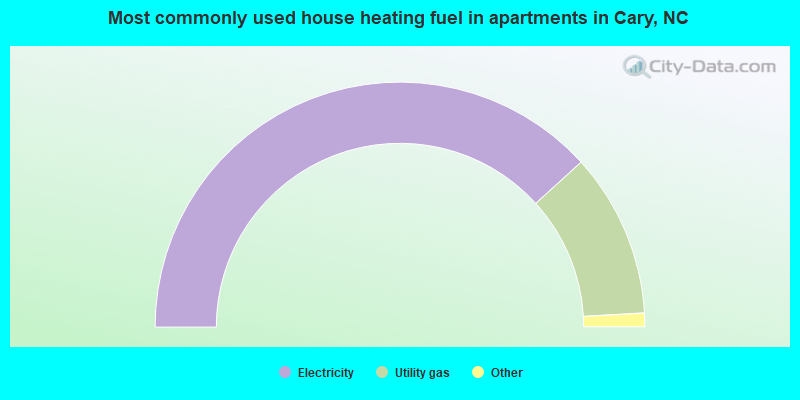
- 76.5%Electricity
- 21.7%Utility gas
- 0.8%No fuel used
- 0.7%Bottled, tank, or LP gas
- 0.2%Other fuel
Private vs. public school enrollment:
| Here: | 12.6% |
| North Carolina: | 13.8% |
| Here: | 11.3% |
| North Carolina: | 11.9% |
| Here: | 10.5% |
| North Carolina: | 19.3% |


