Carrollton, TX (Texas) Houses and Residents
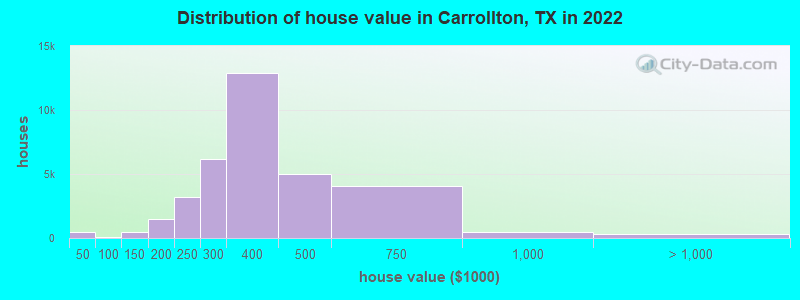
Estimated median house or condo value in 2022: $362,100 (it was $124,000 in 2000 )
Carrollton:
$362,100Texas:
$275,400
Lower value quartile - upper value quartile: $291,900 - $470,200Mean price in 2022: Detached houses: $378,088 Here:
$378,088State:
$369,058
Townhouses or other attached units: $276,336 Here:
$276,336State:
$327,631
In 3-to-4-unit structures: $231,622 Here:
$231,622State:
$209,652
In 5-or-more-unit structures: $220,516 Here:
$220,516State:
$413,944
Mobile homes: $64,641 Here:
$64,641State:
$124,413
Total population: 128,353 (Urban population: 108,375, Rural population: 840 (all nonfarm) )
Houses: 53,442 (52,026 occupied: 30,653 owner occupied, 21,373 renter occupied )
% of renters here:
41%State:
38%
Housing density: 1,465 houses/condos per square mile
Median price asked for vacant for-sale houses and condos in 2022: $386,243.
Median contract rent in 2022: $1,408 (lower quartile is $1,138, upper quartile is $1,765)
Median rent asked for vacant for-rent units in 2022: $908
Median gross rent in Carrollton, TX in 2022: $1,571
Housing units in Carrollton with a mortgage: 19,067 (917 second mortgage, 87 home equity loan, 791 both second mortgage and home equity loan )Houses without a mortgage: 207
Median household income for houses/condos with a mortgage: $136,418
Median household income for apartments without a mortgage: $106,311
Median monthly housing costs: $1,554
Data:
Median house or condo value ($)
Median house or condo value ($ change since 2000)
Median house or condo value ($) - White
Median house or condo value ($) - Black or African American
Median house or condo value ($) - Asian
Median house or condo value ($) - Hispanic or Latino
Median house or condo value ($) - American Indian and Alaska Native
Median house or condo value ($) - Multirace
Median house or condo value ($) - Other Race
Median price asked for mobile homes ($)
Household density (households per square mile)
Mean house or condo value by units in structure - 1, detached ($)
Mean house or condo value by units in structure - 1, attached ($)
Mean house or condo value by units in structure - 2 ($)
Mean house or condo value by units in structure by units in structure - 3 or 4 ($)
Mean house or condo value by units in structure - 5 or more ($)
Mean house or condo value by units in structure - Boat, RV, van, etc. ($)
Mean house or condo value by units in structure - Mobile home ($)
Median contract rent ($)
Median contract rent - Lower quartile ($)
Median contract rent - Upper quartile ($)
Median gross rent ($)
Urban houses (%)
Rural houses (%)
Houses occupied (%)
Houses occupied (% change since 2000)
Houses owner occupied (%)
Houses owner occupied (% change since 2000)
Houses renter occupied (%)
Houses renter occupied (% change since 2000)
Vacant housing units - For rent (%)
Vacant housing units - For rent (% change since 2000)
Vacant housing units - For sale only (%)
Vacant housing units - For sale only (% change since 2000)
Vacant housing units - Rented or sold, not occupied (%)
Vacant housing units - Rented or sold, not occupied (% change since 2000)
Vacant housing units - For seasonal, recreational, or occasional use (%)
Vacant housing units - For seasonal, recreational, or occasional use (% change since 2000)
Vacant housing units - For migrant workers (%)
Vacant housing units - For migrant workers (% change since 2000)
Vacant housing units - Other vacant (%)
Vacant housing units - Other vacant (% change since 2000)
Median monthly housing costs ($)
Median household income for houses/condos with a mortgage ($)
Median household income for houses/condos without a mortgage ($)
Median household income ($)
Median household income ($) - White
Median household income ($) - Black or African American
Median household income ($) - Asian
Median household income ($) - Hispanic or Latino
Median household income ($) - American Indian and Alaska Native
Median household income ($) - Multirace
Median household income ($) - Other Race
Mortgage status - with mortgage (%)
Mortgage status - with second mortgage (%)
Mortgage status - with home equity loan (%)
Mortgage status - with both second mortgage and home equity loan (%)
Mortgage status - without a mortgage (%)
Median year house/condo built
Median year apartment built
Household type by relationship - Male householder living alone (%)
Household type by relationship - Male householder not living alone (%)
Household type by relationship - Female householder living alone (%)
Household type by relationship - Female householder not living alone (%)
Household type by relationship - Opposite-Sex spouse (%)
Household type by relationship - Same-Sex spouse (%)
Household type by relationship - Opposite-Sex unmarried partner (%)
Household type by relationship - Same-Sex unmarried partner (%)
Household type by relationship - In group quarters (%)
Size of family households - 2-person household (%)
Size of family households - 3-person household (%)
Size of family households - 4-person household (%)
Size of family households - 5-person household (%)
Size of family households - 6-person household (%)
Size of family households - 7-or-more-person household (%)
Size of nonfamily households - 1-person household (%)
Size of nonfamily households - 2-person household (%)
Size of nonfamily households - 3-person household (%)
Size of nonfamily households - 4-person household (%)
Size of nonfamily households - 5-person household (%)
Size of nonfamily households - 6-person household (%)
Size of nonfamily households - 7-or-moreperson household (%)
Year house built - Built 2010 or later (%)
Year house built - Built 2000 to 2009 (%)
Year house built - Built 1990 to 1999 (%)
Year house built - Built 1980 to 1989 (%)
Year house built - Built 1970 to 1979 (%)
Year house built - Built 1960 to 1969 (%)
Year house built - Built 1950 to 1959 (%)
Year house built - Built 1940 to 1949 (%)
Year house built - Built 1939 or earlier (%)
Median number of rooms in houses and condos
Median number of rooms in apartments
Median number of bedrooms in owner occupied houses
Mean number of bedrooms in owner occupied houses
Median number of bedrooms in renter occupied houses
Mean number of bedrooms in renter occupied houses
Median number of vehichles in owner occupied houses
Mean number of vehichles in owner occupied houses
Median number of vehichles in renter occupied houses
Mean number of vehichles in renter occupied houses
Rooms in owner-occupied houses - 1 room (%)
Rooms in owner-occupied houses - 2 rooms (%)
Rooms in owner-occupied houses - 3 rooms (%)
Rooms in owner-occupied houses - 4 rooms (%)
Rooms in owner-occupied houses - 5 rooms (%)
Rooms in owner-occupied houses - 6 rooms (%)
Rooms in owner-occupied houses - 7 rooms (%)
Rooms in owner-occupied houses - 8 rooms (%)
Rooms in owner-occupied houses - 9+ rooms (%)
Rooms in renter-occupied houses - 1 room (%)
Rooms in renter-occupied houses - 2 rooms (%)
Rooms in renter-occupied houses - 3 rooms (%)
Rooms in renter-occupied houses - 4 rooms (%)
Rooms in renter-occupied houses - 5 rooms (%)
Rooms in renter-occupied houses - 6 rooms (%)
Rooms in renter-occupied houses - 7 rooms (%)
Rooms in renter-occupied houses - 8 rooms (%)
Rooms in renter-occupied houses - 9+ rooms (%)
Bedrooms in owner-occupied houses - no bedrooms (%)
Bedrooms in owner-occupied houses - 1 bedroom (%)
Bedrooms in owner-occupied houses - 2 bedrooms (%)
Bedrooms in owner-occupied houses - 3 bedrooms (%)
Bedrooms in owner-occupied houses - 4 bedrooms (%)
Bedrooms in owner-occupied houses - 5+ bedrooms (%)
Bedrooms in renter-occupied houses - no bedrooms (%)
Bedrooms in renter-occupied houses - 1 bedroom (%)
Bedrooms in renter-occupied houses - 2 bedrooms (%)
Bedrooms in renter-occupied houses - 3 bedrooms (%)
Bedrooms in renter-occupied houses - 4 bedrooms (%)
Bedrooms in renter-occupied houses - 5+ bedrooms (%)
Vehicles available in owner-occupied houses - no vehicle available (%)
Vehicles available in owner-occupied houses - 1 vehicle available(%)
Vehicles available in owner-occupied houses - 2 Vehicles available (%)
Vehicles available in owner-occupied houses - 3 Vehicles available (%)
Vehicles available in owner-occupied houses - 4 Vehicles available (%)
Vehicles available in owner-occupied houses - 5+ Vehicles available (%)
Vehicles available in renter-occupied houses - no vehicle available (%)
Vehicles available in renter-occupied houses - 1 vehicle available (%)
Vehicles available in renter-occupied houses - 2 Vehicles available (%)
Vehicles available in renter-occupied houses - 3 Vehicles available (%)
Vehicles available in renter-occupied houses - 4 Vehicles available (%)
Vehicles available in renter-occupied houses - 5+ Vehicles available (%)
Housing units in structures - 1, detached (%)
Housing units in structures - 1, attached (%)
Housing units in structures - 2 (%)
Housing units in structures - 3 or 4 (%)
Housing units in structures - 5 to 9 (%)
Housing units in structures - 10 to 19 (%)
Housing units in structures - 20 to 49 (%)
Housing units in structures - 50 or more (%)
Housing units in structures - Mobile home (%)
Housing units in structures - Boat, RV, van, etc. (%)
Housing units in structures - Owners - 1, detached (%)
Housing units in structures - Owners - 1, attached (%)
Housing units in structures - Owners - 2 (%)
Housing units in structures - Owners - 3 or 4 (%)
Housing units in structures - Owners - 5 to 9 (%)
Housing units in structures - Owners - 10 to 19 (%)
Housing units in structures - Owners - 20 to 49 (%)
Housing units in structures - Owners - 50 or more (%)
Housing units in structures - Owners - Mobile home (%)
Housing units in structures - Owners - Boat, RV, van, etc. (%)
Housing units in structures - Renters - 1, detached (%)
Housing units in structures - Renters - 1, attached (%)
Housing units in structures - Renters - 2 (%)
Housing units in structures - Renters - 3 or 4 (%)
Housing units in structures - Renters - 5 to 9 (%)
Housing units in structures - Renters - 10 to 19 (%)
Housing units in structures - Renters - 20 to 49 (%)
Housing units in structures - Renters - 50 or more (%)
Housing units in structures - Renters - Mobile home (%)
Housing units in structures - Renters - Boat, RV, van, etc. (%)
House/condo owner moved in on average (years ago)
Renter moved in on average (years ago)
Year householder moved into unit - Moved in 1999 to March 2000 (%)
Year householder moved into unit - Moved in 1999 to March 2000 (%) - White
Year householder moved into unit - Moved in 1999 to March 2000 (%) - Black or African American
Year householder moved into unit - Moved in 1999 to March 2000 (%) - Asian
Year householder moved into unit - Moved in 1999 to March 2000 (%) - Hispanic or Latino
Year householder moved into unit - Moved in 1999 to March 2000 (%) - American Indian and Alaska Native
Year householder moved into unit - Moved in 1999 to March 2000 (%) - Multirace
Year householder moved into unit - Moved in 1999 to March 2000 (%) - Other Race
Year householder moved into unit - Moved in 1995 to 1998 (%)
Year householder moved into unit - Moved in 1995 to 1998 (%) - White
Year householder moved into unit - Moved in 1995 to 1998 (%) - Black or African American
Year householder moved into unit - Moved in 1995 to 1998 (%) - Asian
Year householder moved into unit - Moved in 1995 to 1998 (%) - Hispanic or Latino
Year householder moved into unit - Moved in 1995 to 1998 (%) - American Indian and Alaska Native
Year householder moved into unit - Moved in 1995 to 1998 (%) - Multirace
Year householder moved into unit - Moved in 1995 to 1998 (%) - Other Race
Year householder moved into unit - Moved in 1990 to 1994 (%)
Year householder moved into unit - Moved in 1990 to 1994 (%) - White
Year householder moved into unit - Moved in 1990 to 1994 (%) - Black or African American
Year householder moved into unit - Moved in 1990 to 1994 (%) - Asian
Year householder moved into unit - Moved in 1990 to 1994 (%) - Hispanic or Latino
Year householder moved into unit - Moved in 1990 to 1994 (%) - American Indian and Alaska Native
Year householder moved into unit - Moved in 1990 to 1994 (%) - Multirace
Year householder moved into unit - Moved in 1990 to 1994 (%) - Other Race
Year householder moved into unit - Moved in 1980 to 1989 (%)
Year householder moved into unit - Moved in 1980 to 1989 (%) - White
Year householder moved into unit - Moved in 1980 to 1989 (%) - Black or African American
Year householder moved into unit - Moved in 1980 to 1989 (%) - Asian
Year householder moved into unit - Moved in 1980 to 1989 (%) - Hispanic or Latino
Year householder moved into unit - Moved in 1980 to 1989 (%) - American Indian and Alaska Native
Year householder moved into unit - Moved in 1980 to 1989 (%) - Multirace
Year householder moved into unit - Moved in 1980 to 1989 (%) - Other Race
Year householder moved into unit - Moved in 1970 to 1979 (%)
Year householder moved into unit - Moved in 1970 to 1979 (%) - White
Year householder moved into unit - Moved in 1970 to 1979 (%) - Black or African American
Year householder moved into unit - Moved in 1970 to 1979 (%) - Asian
Year householder moved into unit - Moved in 1970 to 1979 (%) - Hispanic or Latino
Year householder moved into unit - Moved in 1970 to 1979 (%) - American Indian and Alaska Native
Year householder moved into unit - Moved in 1970 to 1979 (%) - Multirace
Year householder moved into unit - Moved in 1970 to 1979 (%) - Other Race
Year householder moved into unit - Moved in 1969 or earlier (%)
Year householder moved into unit - Moved in 1969 or earlier (%) - White
Year householder moved into unit - Moved in 1969 or earlier (%) - Black or African American
Year householder moved into unit - Moved in 1969 or earlier (%) - Asian
Year householder moved into unit - Moved in 1969 or earlier (%) - Hispanic or Latino
Year householder moved into unit - Moved in 1969 or earlier (%) - American Indian and Alaska Native
Year householder moved into unit - Moved in 1969 or earlier (%) - Multirace
Year householder moved into unit - Moved in 1969 or earlier (%) - Other Race
Housing units lacking complete plumbing facilities (%)
Housing units lacking complete kitchen facilities (%)
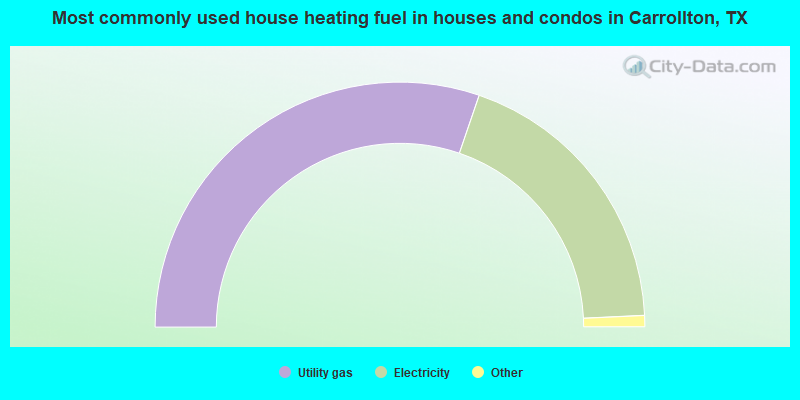
House heating fuel used in houses and condos - Utility gas (%)
House heating fuel used in houses and condos - Bottled, tank, or LP gas (%)
House heating fuel used in houses and condos - Electricity (%)
House heating fuel used in houses and condos - Fuel oil, kerosene, etc. (%)
House heating fuel used in houses and condos - Coal or coke (%)
House heating fuel used in houses and condos - Wood (%)
House heating fuel used in houses and condos - Solar energy (%)
House heating fuel used in houses and condos - Other fuel (%)
House heating fuel used in houses and condos - No fuel used (%)
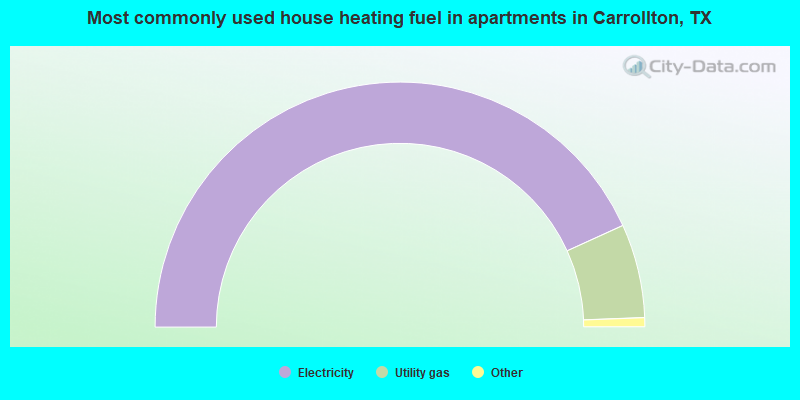
House heating fuel used in apartments - Utility gas (%)
House heating fuel used in apartments - Bottled, tank, or LP gas (%)
House heating fuel used in apartments - Electricity (%)
House heating fuel used in apartments - Fuel oil, kerosene, etc. (%)
House heating fuel used in apartments - Coal or coke (%)
House heating fuel used in apartments - Wood (%)
House heating fuel used in apartments - Solar energy (%)
House heating fuel used in apartments - Other fuel (%)
House heating fuel used in apartments - No fuel used (%)
Latest news about housing in Carrollton, TX collected exclusively by city-data.com from local newspapers, TV, and radio stations
Median year house/condo built: 1987Median year apartment built: 1998Household type by relationship:
Households: 133,240
Male householders: 27,239 (6,791 living alone ), Female householders: 24,787 (7,013 living alone )26,216 spouses (25,699 opposite-sex spouses ), 3,436 unmarried partners , (3,074 opposite-sex unmarried partners ), 36,642 children (33,471 natural , 1,792 adopted , 1,379 stepchildren ), 1,570 grandchildren , 2,608 brothers or sisters , 3,438 parents , 0 foster children , 2,903 other relatives , 3,664 non-relatives In group quarters: 737
Size of family households: 13,890 2-persons , 9,590 3-persons , 4,528 4-persons , 4,012 5-persons , 1,058 6-persons , 751 7-or-more-persons .
Size of nonfamily households: 13,804 1-person , 3,943 2-persons , 450 3-persons .
18,072 married couples with children. single-parent households (946 men , 4,314 women ).
60.0% of residents of Carrollton speak English at home. of residents speak Spanish at home (61% speak English very well , 21% speak English well , 13% speak English not well , 5% don't speak English at all ).of residents speak other Indo-European language at home (82% speak English very well , 12% speak English well , 5% speak English not well , 2% don't speak English at all ).of residents speak Asian or Pacific Island language at home (52% speak English very well , 23% speak English well , 21% speak English not well , 4% don't speak English at all ).of residents speak other language at home (90% speak English very well , 9% speak English well , 1% don't speak English at all ).
Foreign born population: 35,139 (26.4%)of them are naturalized citizens )
Median number of rooms in houses and condos:
Median number of rooms in apartments
Owner-occupied Renter-occupied
Bedrooms in owner-occupied houses and condos in Carrollton, Texas
0 no bedroom 214 1 bedroom 2,461 2 bedrooms 16,567 3 bedrooms 9,237 4 bedrooms 2,174 5+ bedrooms
Bedrooms in renter-occupied apartments in Carrollton, Texas
1,809 no bedroom 8,758 1 bedroom 7,276 2 bedrooms 2,600 3 bedrooms 930 4 bedrooms 0 5+ bedrooms
Owner-occupied Renter-occupied
Rooms in owner-occupied houses in Carrollton, Texas
0 1 room 78 2 rooms 383 3 rooms 1,792 4 rooms 4,744 5 rooms 6,614 6 rooms 5,734 7 rooms 4,949 8 rooms 6,359 9+ rooms
Rooms in renter-occupied apartments in Carrollton, Texas
1,561 1 room 4,206 2 rooms 4,679 3 rooms 4,955 4 rooms 3,237 5 rooms 1,614 6 rooms 544 7 rooms 197 8 rooms 380 9+ rooms
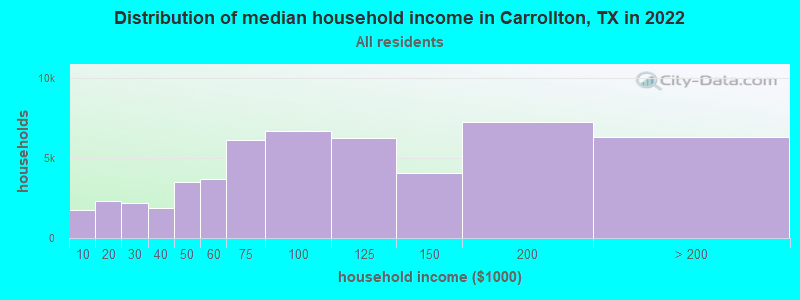
Carrollton, TX household income distribution 1,750 Less than $10,0002,335 $10,000 to $19,9992,181 $20,000 to $29,9991,860 $30,000 to $39,9993,526 $40,000 to $49,9993,694 $50,000 to $59,9996,117 $60,000 to $74,9996,693 $75,000 to $99,9996,247 $100,000 to $124,9994,044 $125,000 to $149,9997,243 $150,000 to $199,9996,336 $200,000 or more
Home value of owner - occupied houses in 2022 in Carrollton, TX 192 Less than $10,00089 $15,000 to $19,99927 $20,000 to $24,99956 $25,000 to $29,99933 $30,000 to $34,9996 $35,000 to $39,99928 $40,000 to $49,9995 $50,000 to $59,9993 $70,000 to $79,99918 $80,000 to $89,9999 $90,000 to $99,999130 $100,000 to $124,999300 $125,000 to $149,999493 $150,000 to $174,999968 $175,000 to $199,9993,228 $200,000 to $249,9996,176 $250,000 to $299,99912,926 $300,000 to $399,9995,012 $400,000 to $499,9994,088 $500,000 to $749,999441 $750,000 to $999,999179 $1,000,000 to $1,499,999136 $2,000,000 or moreRent paid by renters in 2022 in Carrollton, TX 17 $100 to $1499 $200 to $24911 $350 to $39970 $450 to $499105 $500 to $5497 $550 to $59926 $600 to $6494 $650 to $699149 $700 to $74955 $750 to $799397 $800 to $8991,144 $900 to $9995,558 $1,000 to $1,2495,539 $1,250 to $1,4997,098 $1,500 to $1,9991,837 $2,000 to $2,499147 $2,500 to $2,999323 $3,000 to $3,499173 $3,500 or more223 No cash rent
Percentage of workers working in this county: 59.2%Number of people working at home: 18,792 (23.9% of all workers )
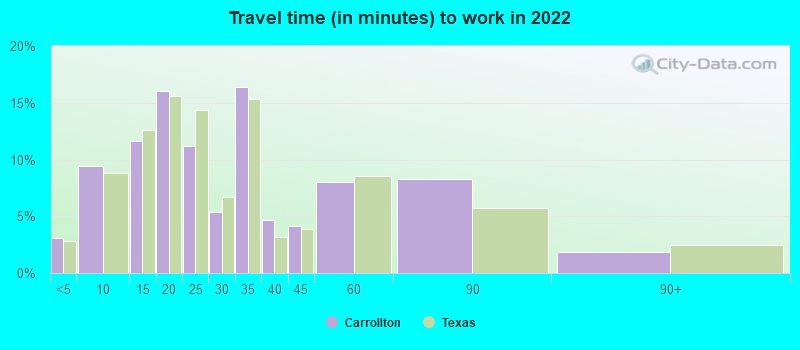
Travel time to work (commute)
Less than 5 minutes: 1,5555 to 9 minutes: 5,66610 to 14 minutes: 6,86815 to 19 minutes: 9,37420 to 24 minutes: 9,96425 to 29 minutes: 4,81630 to 34 minutes: 10,88735 to 39 minutes: 1,24740 to 44 minutes: 1,75545 to 59 minutes: 6,50960 to 89 minutes: 65990 or more minutes: 327
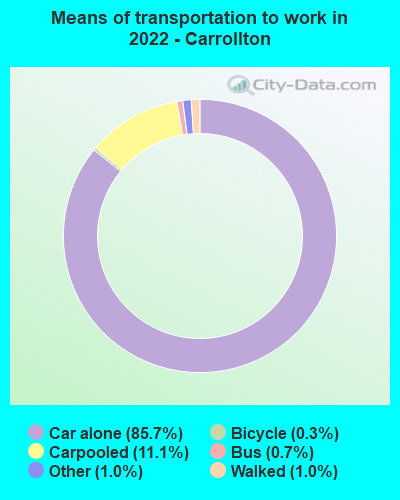
Means of transportation to work:
Drove a car alone: 52,885 (67.7%)Carpooled: 7,051 (9.0%)Bus : 269 (0.3%)Long-distance train or commuter rail : 37 (0.0%)Light rail, streetcar or trolley : 19 (0.0%)Taxi: 790 (1.0%)Bicycle: 286 (0.4%)Walked: 682 (0.9%)Worked at home: 18,792 (24.1%)
Unemployment by race in 2022
Unemployment rate for White non-Hispanic residents 4.4% Males3.7% FemalesUnemployment rate for Black residents 5.8% Males4.3% FemalesUnemployment rate for American Indian and Alaska Native residents 1.8% MalesUnemployment rate for Asian residents 0.7% Males2.1% FemalesUnemployment rate for other race residents 1.6% Males3.8% FemalesUnemployment rate for two or more race residents 1.4% Males2.0% FemalesUnemployment rate for Hispanic or Latino residents 2.1% Males3.6% Females
Year of entry for the foreign-born population in Carrollton, Texas
10,527 2010 or later 7,921 2000 to 2009 7,947 1990 to 1999 7,036 1980 to 1989 3,186 1970 to 1979 937 Before 1970
First ancestries reported:
English: 5,467 (6.9%)
German: 2,955 (3.7%)
American: 2,798 (3.5%)
Irish: 2,643 (3.3%)
Italian: 1,226 (1.5%)
African: 782 (1.0%)
Scottish: 758 (1.0%)
European: 758 (1.0%)
Polish: 683 (0.9%)
British: 593 (0.7%)
Nigerian: 567 (0.7%)
Scotch-Irish: 491 (0.6%)
French: 470 (0.6%)
French Canadian: 326 (0.4%)
Norwegian: 291 (0.4%)
Dutch: 220 (0.3%)
Palestinian: 206 (0.3%)
Northern European: 202 (0.3%)
Liberian: 182 (0.2%)
Czech: 179 (0.2%)
Brazilian: 166 (0.2%)
Swedish: 154 (0.2%)
Belizean: 149 (0.2%)
Russian: 139 (0.2%)
Lithuanian: 138 (0.2%)
Scandinavian: 130 (0.2%)
Serbian: 112 (0.1%)
Armenian: 91 (0.1%)
Ethiopian: 89 (0.1%)
Eastern European: 85 (0.1%)
Arab: 84 (0.1%)
Turkish: 83 (0.1%)
Ukrainian: 83 (0.1%)
Iranian: 81 (0.1%)
Hungarian: 78 (0.10%)
Canadian: 77 (0.10%)
Ghanaian: 76 (0.10%)
Greek: 72 (0.09%)
Slovene: 70 (0.09%)
Afghan: 56 (0.07%)
Welsh: 46 (0.06%)
Czechoslovakian: 45 (0.06%)
Danish: 41 (0.05%)
Romanian: 40 (0.05%)
Celtic: 37 (0.05%)
Slovak: 36 (0.05%)
Lebanese: 33 (0.04%)
Jordanian: 28 (0.04%)
Kenyan: 25 (0.03%)
Latvian: 24 (0.03%)
Bulgarian: 22 (0.03%)
Austrian: 20 (0.03%)
Finnish: 20 (0.03%)
Cajun: 19 (0.02%)
Jamaican: 19 (0.02%)
Zimbabwean: 18 (0.02%)
Sierra Leonean: 16 (0.02%)
Albanian: 16 (0.02%)
Egyptian: 15 (0.02%)
Croatian: 11 (0.01%)
Swiss: 11 (0.01%)
Yugoslavian: 11 (0.01%)
Belgian: 10 (0.01%)
Syrian: 10 (0.01%)
Guyanese: 10 (0.01%)
Most common places of birth for foreign-born residents (%): Mexico Carrollton:
32.1% (12,096)Texas:
48.4% (2,411,723)
India Carrollton:
11.2% (4,207)Texas:
6.1% (306,347)
Korea Carrollton:
10.3% (3,870)Texas:
1.2% (60,172)
Pakistan Carrollton:
5.6% (2,124)Texas:
1.2% (62,159)
El Salvador Carrollton:
5.2% (1,961)Texas:
4.5% (224,455)
Vietnam Carrollton:
4.9% (1,840)Texas:
3.7% (184,770)
Honduras Carrollton:
2.2% (818)Texas:
3.0% (147,182)
Venezuela Carrollton:
2.1% (795)Texas:
1.5% (72,413)
China, excluding Hong Kong and Taiwan Carrollton:
2.1% (773)Texas:
2.3% (115,558)
Cuba Carrollton:
2.0% (755)Texas:
1.3% (62,978)
Cambodia Carrollton:
2.0% (750)Texas:
0.2% (9,997)
Canada Carrollton:
1.7% (654)Texas:
1.1% (55,371)
Place of birth for U.S.-born residents:
This state: 57,169Other state: 38,872Northeast: 5,361Midwest: 10,526South: 14,889West: 8,096 88.9% of Carrollton residents lived in the same house 1 years ago.
Out of people who lived in different houses, 27.9% lived in this county.
Out of people who lived in different counties, 62.3% lived in Texas.
Carrollton:
88.9%State average:
85.7%
Education attainment for males 25 years and older:
No schooling: 1,573Nursery to 4th grade: 05th and 6th grade: 8697th and 8th grade: 1549th grade: 22010th grade: 21211th grade: 24812th grade, no diploma: 501High school graduate (or equivalency): 9,635Less than 1 year of college: 3,977Some college more than 1 year, no degree: 7,219Associate degree: 3,172Bachelor's degree: 13,540Master's degree: 4,610Professional school degree: 1,349Doctorate degree: 1,004
Education attainment for females 25 years and older:
No schooling: 953Nursery to 4th grade: 2765th and 6th grade: 7957th and 8th grade: 4549th grade: 27810th grade: 17411th grade: 35812th grade, no diploma: 1,682High school graduate (or equivalency): 6,686Less than 1 year of college: 3,399Some college more than 1 year, no degree: 6,667Associate degree: 3,870Bachelor's degree: 13,790Master's degree: 5,876Professional school degree: 1,031Doctorate degree: 856
Housing units in structures:
One, detached: 31,005One, attached: 3,349Two: 3153 or 4: 4,2325 to 9: 4,82110 to 19: 3,21820 to 49: 1,94950 or more: 4,397Mobile homes: 49Boats, RVs, vans, etc.: 107Housing units lacking complete kitchen facilities in 2022: 0.6%House/condo owner moved in on average 11 years ago
Renter moved in on average 2 years ago
Private vs. public school enrollment:
Students in private schools in grades 1 to 8 (elementary and middle school): 2,327 Students in private schools in grades 9 to 12 (high school): 1,060 Students in private undergraduate colleges: 475