Carrollton, GA (Georgia) Houses and Residents
| Carrollton: | $345,563 |
| Georgia: | $297,400 |
Total population: 26,690 (Urban population: 19,160 (all inside urban clusters), Rural population: 810 (all nonfarm))
Houses: 10,778 (9,934 occupied: 3,847 owner occupied, 6,191 renter occupied)
| % of renters here: | 62% |
| State: | 34% |
Housing density: 534 houses/condos per square mile
Median price asked for vacant for-sale houses and condos in 2022: $71,498.
Median contract rent in 2022: $842 (lower quartile is $633, upper quartile is $1,125)
Median rent asked for vacant for-rent units in 2022: $721
Median gross rent in Carrollton, GA in 2022: $995
Housing units in Carrollton with a mortgage: 2,290 (96 second mortgage, 0 home equity loan, 59 both second mortgage and home equity loan)
Houses without a mortgage: 27
Median household income for houses/condos with a mortgage: $108,072
Median household income for apartments without a mortgage: $99,417
Median monthly housing costs: $1,040
Compare current foreclosures in Carrollton, GA:
| Photo | Address | Area | Beds / Baths | Price | Details |
|---|---|---|---|---|---|

|
#1
Folds Rd
Carrollton, GA 30116
|
3,148 sq. feet
|
3 baths 3 beds |
show details | |

|
#2
Preston Place Ct
Carrollton, GA 30117
|
1,499 sq. feet
|
2 baths 3 beds |
show details | |

|
#3
Lake Cir
Carrollton, GA 30116
|
3,969 sq. feet
|
5 baths 5 beds |
show details | |

|
#4
Jennifer Ln
Carrollton, GA 30116
|
2,796 sq. feet
|
2 baths 3 beds |
show details | |

|
#5
Camp Ln
Carrollton, GA 30117
|
2,062 sq. feet
|
3 baths 3 beds |
show details | |

|
#6
Yosemite Ct
Carrollton, GA 30117
|
1,500 sq. feet
|
3 baths 4 beds |
show details | |

|
#7
Woodland Way
Carrollton, GA 30116
|
1,400 sq. feet
|
2 baths 3 beds |
show details | |

|
#8
Henson Cir
Carrollton, GA 30117
|
1,405 sq. feet
|
2 baths 3 beds |
show details | |

|
#9
Happy Hill Rd
Carrollton, GA 30116
|
1,216 sq. feet
|
1 baths 3 beds |
show details | |

|
#10
Cross Plains Hulett Rd
Carrollton, GA 30116
|
1,851 sq. feet
|
2 baths 3 beds |
show details |
| Photo | Address | Area | Beds / Baths | Price | Details |
|---|---|---|---|---|---|

|
#11
Providence Dr
Carrollton, GA 30116
|
1,323 sq. feet
|
2 baths 3 beds |
show details | |

|
#12
Clem Lowell Rd
Carrollton, GA 30116
|
2,288 sq. feet
|
2 baths 3 beds |
show details | |

|
#13
Lambert Overlook Cir
Carrollton, GA 30117
|
1,230 sq. feet
|
2 baths 3 beds |
show details | |

|
#14
Clarion Dr
Carrollton, GA 30116
|
1,912 sq. feet
|
3 baths 4 beds |
show details | |

|
#15
Christian Ln
Carrollton, GA 30116
|
1,330 sq. feet
|
2 baths 3 beds |
show details | |

|
#16
Folds Rd
Carrollton, GA 30116
|
1,008 sq. feet
|
1 baths 3 beds |
show details | |

|
#17
Old Airport Rd
Carrollton, GA 30116
|
1,315 sq. feet
|
1 baths 3 beds |
show details | |

|
#18
Harris Rd
Carrollton, GA 30116
|
1,420 sq. feet
|
1 baths 3 beds |
show details | |

|
#19
Lambert Overlook Cir
Carrollton, GA 30117
|
1,240 sq. feet
|
2 baths 3 beds |
show details | |

|
#20
Center Point Rd
Carrollton, GA 30117
|
1,504 sq. feet
|
2 baths 3 beds |
show details |
| Photo | Address | Area | Beds / Baths | Price | Details |
|---|---|---|---|---|---|

|
#21
Tyler Ln
Carrollton, GA 30117
|
1,640 sq. feet
|
2 baths 3 beds |
show details | |

|
#22
Tyus Carrollton Rd
Carrollton, GA 30117
|
1,448 sq. feet
|
1 baths 3 beds |
show details | |

|
#23
Burns Rd
Carrollton, GA 30117
|
1,416 sq. feet
|
2 baths 3 beds |
show details | |

|
#24
Mount Zion Rd
Carrollton, GA 30117
|
1,216 sq. feet
|
1 baths 2 beds |
show details | |

|
#25
Mertis Ln
Carrollton, GA 30116
|
1,604 sq. feet
|
2 baths 3 beds |
show details | |

|
#26
Liberty Church Rd
Carrollton, GA 30116
|
840 sq. feet
|
1 baths 2 beds |
show details | |

|
#27
Charlcie Ct
Carrollton, GA 30117
|
1,280 sq. feet
|
2 baths 3 beds |
show details | |

|
#28
Maple St
Carrollton, GA 30117
|
1,486 sq. feet
|
2 baths 3 beds |
show details | |

|
#29
Cross Plains Hulett Rd
Carrollton, GA 30116
|
1,196 sq. feet
|
2 baths 3 beds |
show details | |

|
#30
Pine Hill Dr
Carrollton, GA 30116
|
1,420 sq. feet
|
1 baths 3 beds |
show details |
| Photo | Address | Area | Beds / Baths | Price | Details |
|---|---|---|---|---|---|

|
#31
Mount Zion Rd
Carrollton, GA 30117
|
720 sq. feet
|
1 baths 2 beds |
show details | |

|
#32
Preston Place Ct
Carrollton, GA 30117
|
1,457 sq. feet
|
2 baths 3 beds |
show details | |

|
#33
Mandeville Rd
Carrollton, GA 30117
|
1,016 sq. feet
|
2 baths 2 beds |
show details | |

|
#34
Staples Dairy Rd
Carrollton, GA 30116
|
1,409 sq. feet
|
2 baths 3 beds |
show details | |

|
#35
Deerfield Ln
Carrollton, GA 30116
|
1,594 sq. feet
|
2 baths 3 beds |
show details | |

|
#36
Silver Pine Ct
Carrollton, GA 30116
|
1,833 sq. feet
|
2 baths 3 beds |
show details | |

|
#37
King Dr
Carrollton, GA 30116
|
1,454 sq. feet
|
2 baths 3 beds |
show details | |

|
#38
Peek Dr
Carrollton, GA 30116
|
3,134 sq. feet
|
2 baths 3 beds |
show details | |

|
#39
Simonton Mill Rd
Carrollton, GA 30117
|
1,352 sq. feet
|
1 baths 3 beds |
show details | |

|
#40
Springflower Dr
Carrollton, GA 30116
|
1,704 sq. feet
|
2 baths 3 beds |
show details |
| Photo | Address | Area | Beds / Baths | Price | Details |
|---|---|---|---|---|---|

|
#41
Oak Grove Rd
Carrollton, GA 30117
|
2,886 sq. feet
|
2 baths 4 beds |
show details | |

|
#42
E Highway 166
Carrollton, GA 30116
|
1,472 sq. feet
|
1 baths 2 beds |
show details | |

|
#43
Cumberland Dr
Carrollton, GA 30117
|
2,712 sq. feet
|
2 baths 3 beds |
show details | |

|
#44
Oak Grove Rd
Carrollton, GA 30117
|
1,874 sq. feet
|
2 baths 3 beds |
show details | |

|
#45
Cross Plains Hulett Rd
Carrollton, GA 30116
|
2,920 sq. feet
|
2 baths 3 beds |
show details | |

|
#46
Davenport Mill Rd
Carrollton, GA 30117
|
1,389 sq. feet
|
1 baths 3 beds |
show details | |

|
#47
Castlegate Cir
Carrollton, GA 30116
|
1,764 sq. feet
|
1 baths 3 beds |
show details | |

|
#48
Rome St
Carrollton, GA 30117
|
1,880 sq. feet
|
2 baths 3 beds |
show details | |

|
#49
W Honeysuckle Ln
Carrollton, GA 30116
|
2,820 sq. feet
|
3 baths 4 beds |
show details | |

|
Check over 1 million property listings on Foreclosure.com!
|
browse all offers | |||

Latest news about housing in Carrollton, GA collected exclusively by city-data.com from local newspapers, TV, and radio stations

 | Median Home Sale Price by High School District in Metro Atlanta - Past 90 Days (28 replies) |
| Home buying in Atlanta discouraging... (101 replies) |
| Moving to Carrollton, Georgia area (10 replies) |
| Hometown Talent - Stars of Atlanta (35 replies) |
| Found a job in Carrollton (15 replies) |
| Moving to Atlanta suburb- where to go?! (35 replies) |

Median year apartment built: 1989
Household type by relationship:
Households: 27,626- Male householders: 3,756 (931 living alone), Female householders: 6,232 (1,827 living alone)
3,635 spouses (3,635 opposite-sex spouses), 547 unmarried partners, (547 opposite-sex unmarried partners), 6,358 children (5,983 natural, 60 adopted, 314 stepchildren), 434 grandchildren, 275 brothers or sisters, 122 parents, 4 foster children, 617 other relatives, 2,626 non-relatives
- In group quarters: 3,015
Size of family households: 3,096 2-persons, 1,524 3-persons, 833 4-persons, 402 5-persons, 215 6-persons, 67 7-or-more-persons.
Size of nonfamily households: 2,785 1-person, 604 2-persons, 137 3-persons, 303 4-persons.
2,686 married couples with children.
1,997 single-parent households (195 men, 1,802 women).
88.1% of residents of Carrollton speak English at home.
8.4% of residents speak Spanish at home (41% speak English very well, 21% speak English well, 16% speak English not well, 22% don't speak English at all).
2.0% of residents speak other Indo-European language at home (49% speak English very well, 29% speak English well, 22% speak English not well).
0.5% of residents speak Asian or Pacific Island language at home (100% speak English very well).
0.8% of residents speak other language at home (100% speak English very well).
Foreign born population: 2,081 (7.5%)
(27.3% of them are naturalized citizens)
| Here: | 7.6 |
| State: | 6.8 |
| Here: | 4.5 |
| State: | 4.6 |

- Bedrooms in owner-occupied houses and condos in Carrollton, Georgia
- 0no bedroom
- 271 bedroom
- 4632 bedrooms
- 1,4603 bedrooms
- 1,3304 bedrooms
- 5675+ bedrooms

- Bedrooms in renter-occupied apartments in Carrollton, Georgia
- 183no bedroom
- 1,2231 bedroom
- 2,6572 bedrooms
- 1,5783 bedrooms
- 5374 bedrooms
- 145+ bedrooms

- Cars and other vehicles available in Carrollton in owner-occupied houses/condos
- 129no vehicle
- 6691 vehicle
- 1,6852 vehicles
- 8803 vehicles
- 3884 vehicles
- 965+ vehicles

- Cars and other vehicles available in Carrollton in renter-occupied apartments
- 651no vehicle
- 3,0821 vehicle
- 1,5042 vehicles
- 5933 vehicles
- 3394 vehicles
- 235+ vehicles

- Rooms in owner-occupied houses in Carrollton, Georgia
- 01 room
- 02 rooms
- 73 rooms
- 2504 rooms
- 4975 rooms
- 7306 rooms
- 2837 rooms
- 7508 rooms
- 1,3309+ rooms

- Rooms in renter-occupied apartments in Carrollton, Georgia
- 1451 room
- 3742 rooms
- 1,1103 rooms
- 1,7904 rooms
- 1,2635 rooms
- 1,0246 rooms
- 2307 rooms
- 2048 rooms
- 519+ rooms


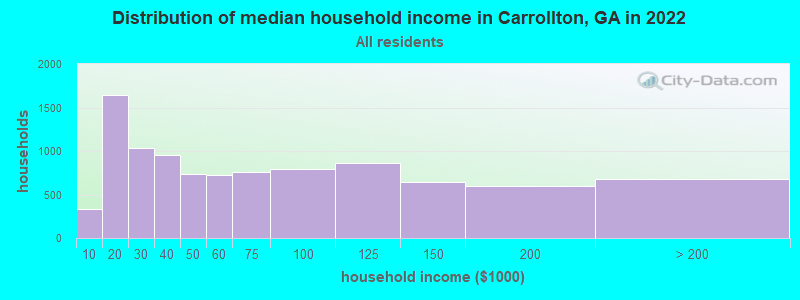
Carrollton, GA household income distribution

- 331Less than $10,000
- 1,640$10,000 to $19,999
- 1,031$20,000 to $29,999
- 955$30,000 to $39,999
- 730$40,000 to $49,999
- 727$50,000 to $59,999
- 757$60,000 to $74,999
- 794$75,000 to $99,999
- 863$100,000 to $124,999
- 645$125,000 to $149,999
- 592$150,000 to $199,999
- 680$200,000 or more
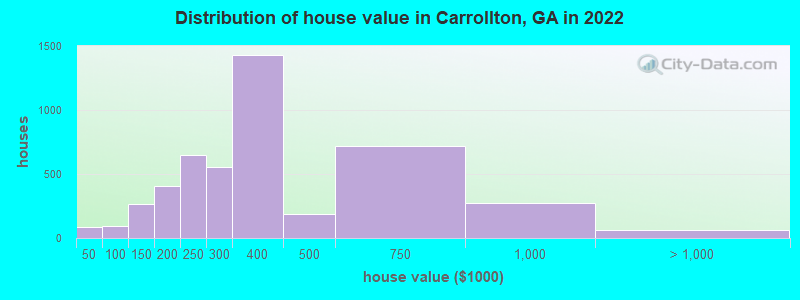
Home value of owner - occupied houses in 2022 in Carrollton, GA
-
- 15Less than $10,000
- 47$15,000 to $19,999
- 17$20,000 to $24,999
- 7$35,000 to $39,999
- 4$50,000 to $59,999
- 61$60,000 to $69,999
- 6$80,000 to $89,999
- 18$90,000 to $99,999
- 118$100,000 to $124,999
- 144$125,000 to $149,999
- 265$150,000 to $174,999
- 142$175,000 to $199,999
- 647$200,000 to $249,999
- 556$250,000 to $299,999
- 1,427$300,000 to $399,999
- 188$400,000 to $499,999
- 721$500,000 to $749,999
- 276$750,000 to $999,999
- 62$1,000,000 to $1,499,999
Rent paid by renters in 2022 in Carrollton, GA
-
- 133Less than $100
- 65$150 to $199
- 53$200 to $249
- 53$250 to $299
- 76$300 to $349
- 223$350 to $399
- 37$400 to $449
- 140$450 to $499
- 624$500 to $549
- 151$550 to $599
- 427$600 to $649
- 379$650 to $699
- 223$700 to $749
- 304$750 to $799
- 681$800 to $899
- 620$900 to $999
- 772$1,000 to $1,249
- 565$1,250 to $1,499
- 404$1,500 to $1,999
- 224$2,000 to $2,499
- 34$3,000 to $3,499
- 207No cash rent


Percentage of workers working in this county: 80.9%
Number of people working at home: 1,425 (11.2% of all workers)
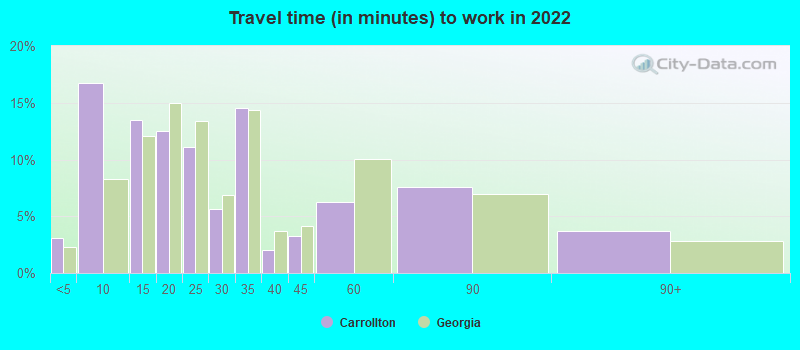
Travel time to work (commute)
- Less than 5 minutes: 818
- 5 to 9 minutes: 3,938
- 10 to 14 minutes: 1,985
- 15 to 19 minutes: 1,284
- 20 to 24 minutes: 675
- 25 to 29 minutes: 195
- 30 to 34 minutes: 676
- 35 to 39 minutes: 224
- 40 to 44 minutes: 167
- 45 to 59 minutes: 739
- 60 to 89 minutes: 777
- 90 or more minutes: 214
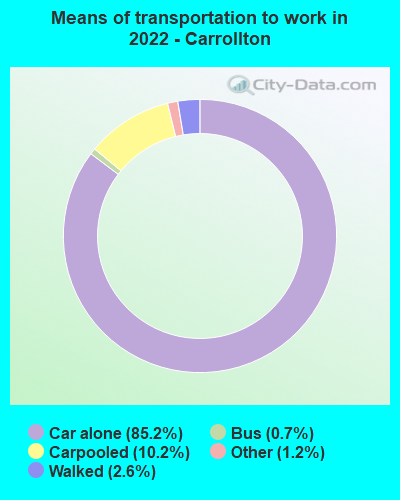
Means of transportation to work:
- Drove a car alone: 22,275 (78.3%)
- Carpooled: 2,777 (9.8%)
- Bus: 150 (0.5%)
- Taxi: 319 (1.1%)
- Bicycle: 24 (0.1%)
- Walked: 724 (2.5%)
- Worked at home: 1,318 (4.6%)

- Unemployment by race in 2022
- Unemployment rate for White non-Hispanic residents
- 2.1%Males
- 2.1%Females
- Unemployment rate for Black residents
- 8.5%Males
- 8.7%Females
- Unemployment rate for American Indian and Alaska Native residents
- 5.0%Males
- Unemployment rate for Asian residents
- 46.4%Males
- Unemployment rate for other race residents
- 6.1%Males
- Unemployment rate for two or more race residents
- 5.6%Males
- Unemployment rate for Hispanic or Latino residents
- 5.4%Males

- Year of entry for the foreign-born population in Carrollton, Georgia
- 7842010 or later
- 7572000 to 2009
- 1791990 to 1999
- 2151980 to 1989
- 251970 to 1979
- 68Before 1970
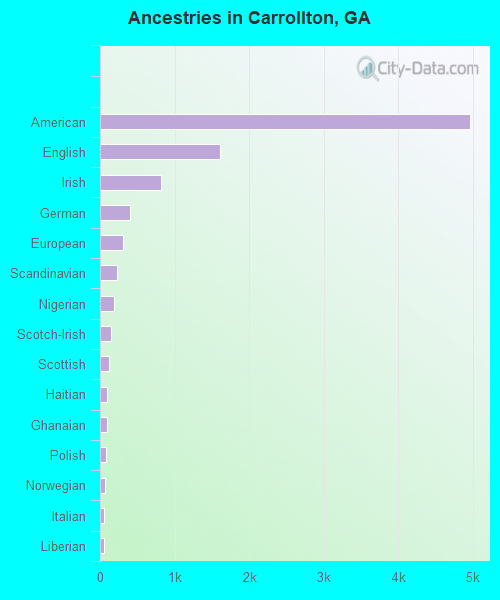
First ancestries reported:
- American: 4,972 (27.6%)
- English: 1,607 (8.9%)
- Irish: 823 (4.6%)
- German: 396 (2.2%)
- European: 315 (1.8%)
- Scandinavian: 222 (1.2%)
- Nigerian: 193 (1.1%)
- Scotch-Irish: 147 (0.8%)
- Scottish: 124 (0.7%)
- Haitian: 94 (0.5%)
- Ghanaian: 91 (0.5%)
- Polish: 76 (0.4%)
- Norwegian: 65 (0.4%)
- Italian: 58 (0.3%)
- Liberian: 55 (0.3%)
- Slovak: 45 (0.3%)
- Swedish: 44 (0.2%)
- West Indian: 42 (0.2%)
- Kenyan: 23 (0.1%)
- British: 21 (0.1%)
- Ethiopian: 19 (0.1%)
- Eastern European: 16 (0.09%)
- Jamaican: 9 (0.05%)
- French Canadian: 8 (0.04%)
- French: 6 (0.03%)
- Russian: 6 (0.03%)
- Brazilian: 4 (0.02%)
- Celtic: 4 (0.02%)
- Cape Verdean: 4 (0.02%)
- Bahamian: 4 (0.02%)
- African: 2 (0.01%)
Most common places of birth for foreign-born residents (%):
| Carrollton: | 25.4% (453) |
| Georgia: | 2.1% (23,500) |
| Carrollton: | 16.3% (290) |
| Georgia: | 3.6% (39,974) |
| Carrollton: | 12.6% (225) |
| Georgia: | 20.0% (223,400) |
| Carrollton: | 9.4% (167) |
| Georgia: | 1.6% (17,476) |
| Carrollton: | 8.5% (152) |
| Georgia: | 1.7% (19,012) |
| Carrollton: | 8.0% (142) |
| Georgia: | 0.3% (3,839) |
| Carrollton: | 4.6% (82) |
| Georgia: | 0.2% (2,184) |
| Carrollton: | 3.3% (59) |
| Georgia: | 9.2% (103,325) |
| Carrollton: | 3.0% (53) |
| Georgia: | 0.3% (3,559) |
| Carrollton: | 2.7% (48) |
| Georgia: | 4.1% (45,797) |
| Carrollton: | 2.5% (44) |
| Georgia: | 1.0% (11,747) |
Place of birth for U.S.-born residents:
- This state: 17,220
- Other state: 8,063
- Northeast: 910
- Midwest: 1,664
- South: 4,848
- West: 694
68.5% of Carrollton residents lived in the same house 1 years ago.
Out of people who lived in different houses, 32.5% lived in this county.
Out of people who lived in different counties, 83.3% lived in Georgia.
| Carrollton: | 68.5% |
| State average: | 86.6% |
Education attainment for males 25 years and older:
- No schooling: 112
- Nursery to 4th grade: 41
- 5th and 6th grade: 35
- 7th and 8th grade: 103
- 9th grade: 41
- 10th grade: 212
- 11th grade: 289
- 12th grade, no diploma: 29
- High school graduate (or equivalency): 1,924
- Less than 1 year of college: 194
- Some college more than 1 year, no degree: 809
- Associate degree: 673
- Bachelor's degree: 1,798
- Master's degree: 738
- Professional school degree: 224
- Doctorate degree: 70

Education attainment for females 25 years and older:
- No schooling: 181
- Nursery to 4th grade: 0
- 5th and 6th grade: 45
- 7th and 8th grade: 134
- 9th grade: 202
- 10th grade: 154
- 11th grade: 177
- 12th grade, no diploma: 54
- High school graduate (or equivalency): 2,420
- Less than 1 year of college: 531
- Some college more than 1 year, no degree: 1,310
- Associate degree: 515
- Bachelor's degree: 1,770
- Master's degree: 477
- Professional school degree: 81
- Doctorate degree: 66


Housing units in structures:
- One, detached: 5,224
- One, attached: 355
- Two: 950
- 3 or 4: 1,100
- 5 to 9: 1,162
- 10 to 19: 855
- 20 to 49: 761
- 50 or more: 260
- Mobile homes: 104
- Boats, RVs, vans, etc.: 4
Housing units lacking complete kitchen facilities in 2022: 4.1%
House/condo owner moved in on average 6 years ago
Renter moved in on average 1 years ago

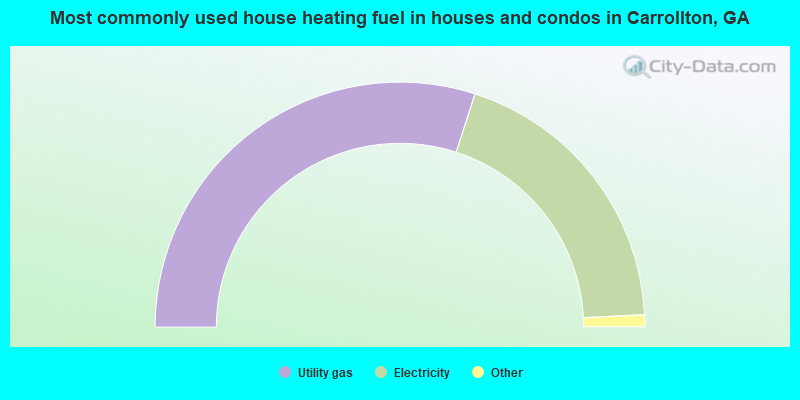
- 60.0%Utility gas
- 38.5%Electricity
- 1.1%Fuel oil, kerosene, etc.
- 0.4%Bottled, tank, or LP gas
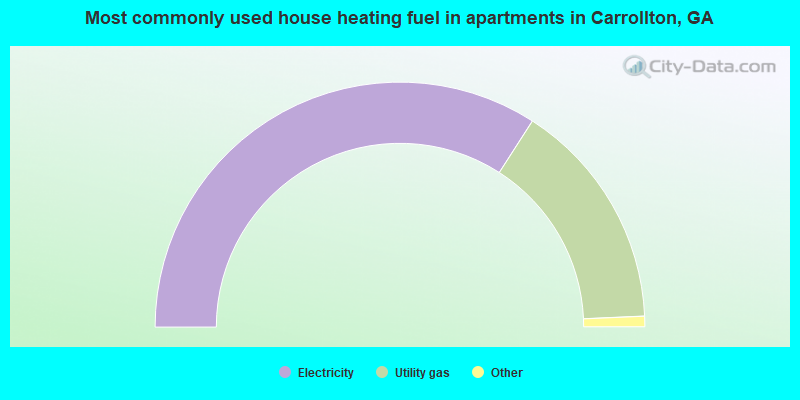
- 68.2%Electricity
- 30.4%Utility gas
- 1.2%Bottled, tank, or LP gas
- 0.2%No fuel used
Private vs. public school enrollment:
| Here: | 3.8% |
| Georgia: | 12.1% |
| Here: | 8.0% |
| Georgia: | 10.8% |
| Here: | 7.7% |
| Georgia: | 17.1% |


