Calumet City, IL (Illinois) Houses and Residents
| Calumet City: | $128,893 |
| Illinois: | $251,600 |
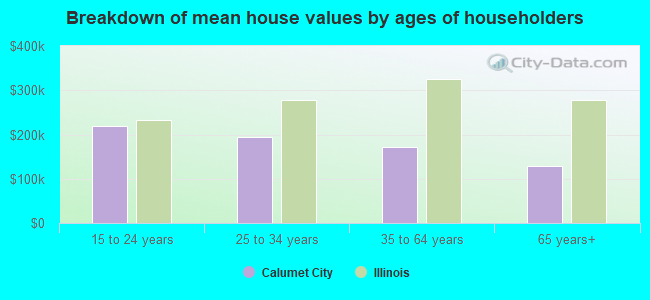
Mean price in 2022:
Detached houses: $162,623
Here: $162,623 State: $310,164 Townhouses or other attached units: $320,428
Here: $320,428 State: $286,230 In 2-unit structures: $146,035
Here: $146,035 State: $299,638 In 3-to-4-unit structures: $60,660
Here: $60,660 State: $330,907 In 5-or-more-unit structures: $130,606
Here: $130,606 State: $318,887 Mobile homes: $10,377
Here: $10,377 State: $78,855
Total population: 37,213 (All urban)
Houses: 16,755 (14,473 occupied: 8,702 owner occupied, 6,018 renter occupied)
| % of renters here: | 41% |
| State: | 33% |
Housing density: 2,306 houses/condos per square mile
Median price asked for vacant for-sale houses and condos in 2022: $101,081.
Median contract rent in 2022: $916 (lower quartile is $705, upper quartile is $1,190)
Median rent asked for vacant for-rent units in 2022: $993
Median gross rent in Calumet City, IL in 2022: $1,078
Housing units in Calumet City with a mortgage: 5,133 (261 second mortgage, 0 home equity loan, 174 both second mortgage and home equity loan)
Houses without a mortgage: 0
Median household income for houses/condos with a mortgage: $73,802
Median household income for apartments without a mortgage: $60,779
Median monthly housing costs: $1,088
Compare current foreclosures in Calumet City, IL:
| Photo | Address | Area | Beds / Baths | Price | Details |
|---|---|---|---|---|---|

|
#1
Marquette Ave
Calumet City, IL 60409
|
1,316 sq. feet
|
1 baths 3 beds |
$144,000
|
show details |

|
#2
Michigan City Rd Apt 3c
Calumet City, IL 60409
|
- sq. feet
|
1 baths 1 beds |
$17,900
|
show details |

|
#3
Cleveland Ave
Calumet City, IL 60409
|
1,525 sq. feet
|
1 baths 3 beds |
show details | |

|
#4
Calhoun Ave
Calumet City, IL 60409
|
1,260 sq. feet
|
1 baths 3 beds |
show details | |

|
#5
Yates Ave
Calumet City, IL 60409
|
3,480 sq. feet
|
4 baths 8 beds |
show details | |

|
#6
Greenbay Ave
Calumet City, IL 60409
|
1,296 sq. feet
|
1 baths 3 beds |
show details | |

|
#7
Elizabeth St
Calumet City, IL 60409
|
1,548 sq. feet
|
1 baths 3 beds |
show details | |

|
#8
Hirsch Ave
Calumet City, IL 60409
|
1,166 sq. feet
|
1 baths 3 beds |
show details | |

|
#9
Forest Ave
Calumet City, IL 60409
|
1,000 sq. feet
|
1 baths 3 beds |
show details | |

|
#10
Bensley Ave
Calumet City, IL 60409
|
2,382 sq. feet
|
1 baths 3 beds |
show details |
| Photo | Address | Area | Beds / Baths | Price | Details |
|---|---|---|---|---|---|

|
#11
Saginaw Ave
Calumet City, IL 60409
|
1,314 sq. feet
|
1 baths 3 beds |
show details | |

|
#12
Bensley Ave
Calumet City, IL 60409
|
1,260 sq. feet
|
1 baths 3 beds |
show details | |

|
#13
164th Pl
Calumet City, IL 60409
|
1,122 sq. feet
|
1 baths 3 beds |
show details | |

|
#14
Forest Ave
Calumet City, IL 60409
|
980 sq. feet
|
1 baths 2 beds |
show details | |

|
#15
Greenbay Ave
Calumet City, IL 60409
|
648 sq. feet
|
1 baths 1 beds |
show details | |

|
#16
Chappel Ave
Calumet City, IL 60409
|
979 sq. feet
|
2 baths 3 beds |
show details | |

|
#17
166th St
Calumet City, IL 60409
|
2,106 sq. feet
|
- baths 6 beds |
show details | |

|
#18
State St
Calumet City, IL 60409
|
5,119 sq. feet
|
4 baths - beds |
show details | |

|
#19
Memorial Dr
Calumet City, IL 60409
|
1,125 sq. feet
|
1 baths - beds |
show details | |

|
#20
Waltham St
Calumet City, IL 60409
|
1,032 sq. feet
|
1 baths - beds |
show details |
| Photo | Address | Area | Beds / Baths | Price | Details |
|---|---|---|---|---|---|

|
#21
Kenilworth Dr
Calumet City, IL 60409
|
732 sq. feet
|
1 baths - beds |
show details | |

|
#22
Exchange Ave
Calumet City, IL 60409
|
1,442 sq. feet
|
1 baths - beds |
show details | |

|
#23
Muskegon Ave
Calumet City, IL 60409
|
1,250 sq. feet
|
1 baths - beds |
show details | |

|
#24
Mackinaw Ave
Calumet City, IL 60409
|
1,200 sq. feet
|
1 baths - beds |
show details | |

|
#25
Gordon Ave
Calumet City, IL 60409
|
876 sq. feet
|
1 baths - beds |
show details | |

|
#26
Memorial Dr
Calumet City, IL 60409
|
1,131 sq. feet
|
1 baths - beds |
show details | |

|
#27
Saginaw Ave
Calumet City, IL 60409
|
1,340 sq. feet
|
1 baths - beds |
show details | |

|
#28
Pulaski Rd
Calumet City, IL 60409
|
924 sq. feet
|
1 baths - beds |
show details | |

|
#29
Highland St
Calumet City, IL 60409
|
860 sq. feet
|
1 baths - beds |
show details | |

|
#30
Chappel Ave
Calumet City, IL 60409
|
984 sq. feet
|
1 baths - beds |
show details |
| Photo | Address | Area | Beds / Baths | Price | Details |
|---|---|---|---|---|---|

|
#31
Price Ave
Calumet City, IL 60409
|
1,512 sq. feet
|
2 baths - beds |
show details | |

|
#32
Memorial Dr
Calumet City, IL 60409
|
1,252 sq. feet
|
1 baths - beds |
show details | |

|
#33
Exchange Ave
Calumet City, IL 60409
|
1,572 sq. feet
|
2 baths - beds |
show details | |

|
#34
Marquette Ave
Calumet City, IL 60409
|
1,298 sq. feet
|
1 baths - beds |
show details | |

|
#35
159th St
Calumet City, IL 60409
|
1,285 sq. feet
|
1 baths - beds |
show details | |

|
#36
Madison Ave
Calumet City, IL 60409
|
1,200 sq. feet
|
1 baths - beds |
show details | |

|
#37
Stoney Island Ave
Calumet City, IL 60409
|
1,275 sq. feet
|
1 baths - beds |
show details | |

|
#38
Memorial Dr
Calumet City, IL 60409
|
1,286 sq. feet
|
1 baths - beds |
show details | |

|
#39
Bensley Ave
Calumet City, IL 60409
|
1,243 sq. feet
|
1 baths - beds |
show details | |

|
#40
Wentworth Ave
Calumet City, IL 60409
|
962 sq. feet
|
1 baths - beds |
show details |
| Photo | Address | Area | Beds / Baths | Price | Details |
|---|---|---|---|---|---|

|
#41
Arthur St
Calumet City, IL 60409
|
1,177 sq. feet
|
1 baths - beds |
show details | |

|
#42
Wentworth Ave
Calumet City, IL 60409
|
1,347 sq. feet
|
1 baths - beds |
show details | |

|
#43
Manistee Ave
Calumet City, IL 60409
|
1,326 sq. feet
|
1 baths - beds |
show details | |

|
#44
Calhoun Ave
Calumet City, IL 60409
|
1,252 sq. feet
|
1 baths - beds |
show details | |

|
#45
1/2 Wentworth Ave
Calumet City, IL 60409
|
969 sq. feet
|
4 baths - beds |
show details | |

|
#46
Paxton Ave
Calumet City, IL 60409
|
1,378 sq. feet
|
1 baths - beds |
show details | |

|
#47
163rd St
Calumet City, IL 60409
|
999 sq. feet
|
1 baths - beds |
show details | |

|
#48
Manistee Ave
Calumet City, IL 60409
|
1,316 sq. feet
|
1 baths - beds |
show details | |

|
#49
163rd St
Calumet City, IL 60409
|
1,419 sq. feet
|
1 baths - beds |
show details | |

|
Check over 1 million property listings on Foreclosure.com!
|
browse all offers | |||


 | Adjacent suburbs that are vastly different from each other. (53 replies) |
| North suburbs vs West suburbs vs South suburbs (107 replies) |
| Manhattan: 98% White? (39 replies) |
| Future of River Oaks and Calumet City area retail (61 replies) |
| Most affordable suburbs for a single family home (single person) (13 replies) |
| Chicago suburbs vs. New Jersey suburbs (19 replies) |

Median year apartment built: 1974
Household type by relationship:
Households: 34,914- Male householders: 5,019 (1,791 living alone), Female householders: 9,071 (3,652 living alone)
3,880 spouses (3,806 opposite-sex spouses), 619 unmarried partners, (526 opposite-sex unmarried partners), 12,834 children (12,233 natural, 343 adopted, 258 stepchildren), 1,266 grandchildren, 511 brothers or sisters, 407 parents, 0 foster children, 330 other relatives, 941 non-relatives
- In group quarters: 30
Size of family households: 3,499 2-persons, 1,930 3-persons, 1,534 4-persons, 1,079 5-persons, 174 6-persons, 183 7-or-more-persons.
Size of nonfamily households: 5,847 1-person, 364 2-persons, 50 3-persons, 15 5-persons.
2,976 married couples with children.
4,336 single-parent households (599 men, 3,737 women).
81.0% of residents of Calumet City speak English at home.
15.4% of residents speak Spanish at home (55% speak English very well, 17% speak English well, 15% speak English not well, 13% don't speak English at all).
0.4% of residents speak other Indo-European language at home (77% speak English very well, 9% speak English well, 13% speak English not well).
0.5% of residents speak Asian or Pacific Island language at home (47% speak English very well, 28% speak English well, 26% speak English not well).
2.2% of residents speak other language at home (88% speak English very well, 12% speak English well).
Foreign born population: 3,448 (9.9%)
(43.7% of them are naturalized citizens)
| Here: | 5.7 |
| State: | 6.4 |
| Here: | 4.4 |
| State: | 4.1 |
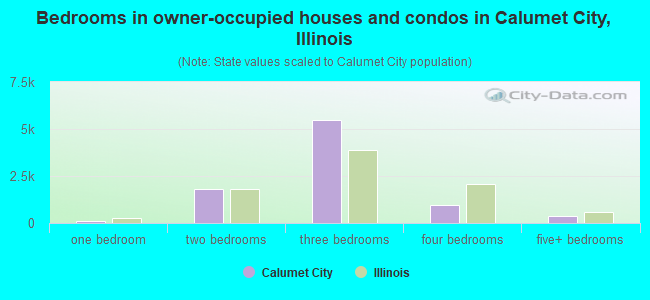
- Bedrooms in owner-occupied houses and condos in Calumet City, Illinois
- 12no bedroom
- 841 bedroom
- 1,8252 bedrooms
- 5,4723 bedrooms
- 9374 bedrooms
- 3735+ bedrooms
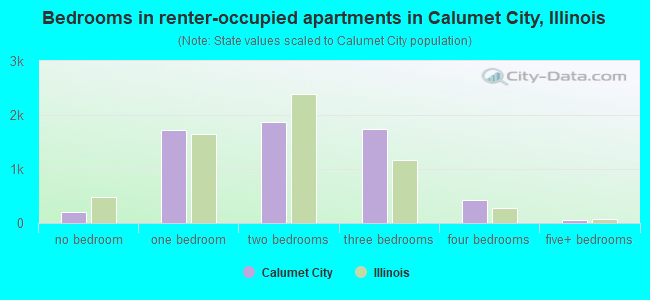
- Bedrooms in renter-occupied apartments in Calumet City, Illinois
- 198no bedroom
- 1,7241 bedroom
- 1,8712 bedrooms
- 1,7383 bedrooms
- 4284 bedrooms
- 585+ bedrooms
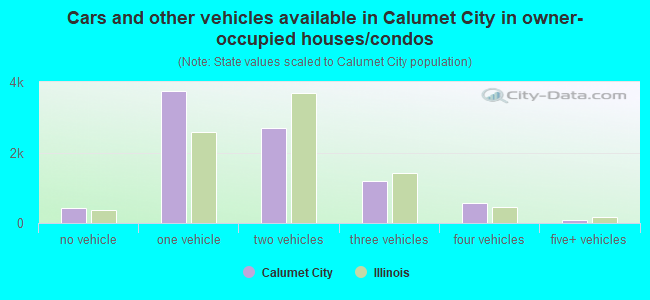
- Cars and other vehicles available in Calumet City in owner-occupied houses/condos
- 427no vehicle
- 3,7331 vehicle
- 2,6872 vehicles
- 1,1913 vehicles
- 5704 vehicles
- 945+ vehicles
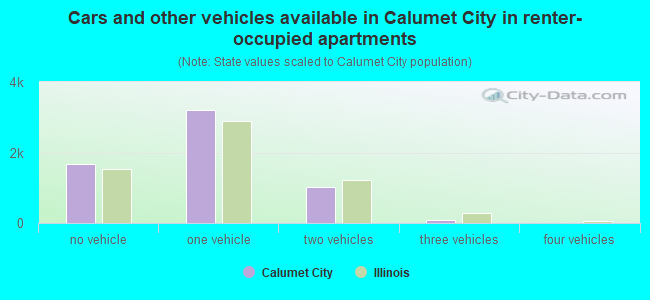
- Cars and other vehicles available in Calumet City in renter-occupied apartments
- 1,675no vehicle
- 3,1991 vehicle
- 1,0202 vehicles
- 933 vehicles
- 124 vehicles
- 185+ vehicles
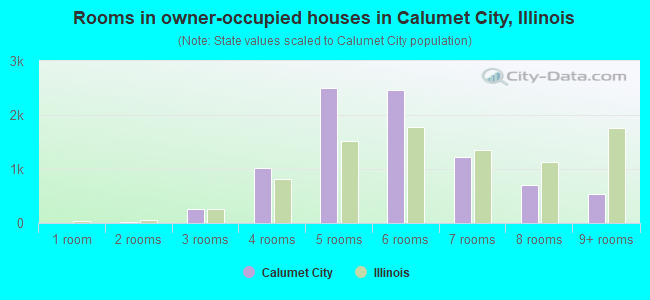
- Rooms in owner-occupied houses in Calumet City, Illinois
- 01 room
- 122 rooms
- 2563 rooms
- 1,0124 rooms
- 2,5095 rooms
- 2,4716 rooms
- 1,2157 rooms
- 6988 rooms
- 5299+ rooms
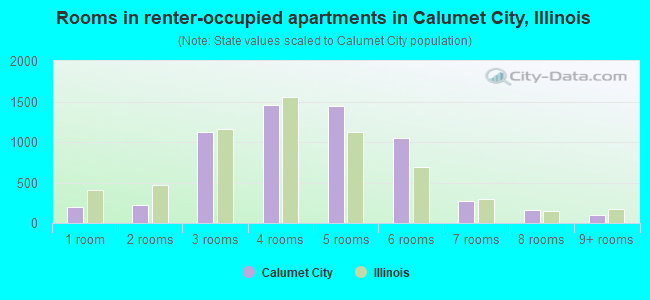
- Rooms in renter-occupied apartments in Calumet City, Illinois
- 1981 room
- 2252 rooms
- 1,1223 rooms
- 1,4614 rooms
- 1,4485 rooms
- 1,0446 rooms
- 2697 rooms
- 1568 rooms
- 969+ rooms
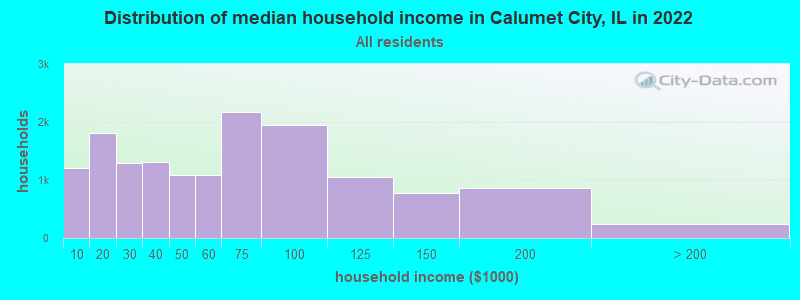
Calumet City, IL household income distribution

- 1,206Less than $10,000
- 1,803$10,000 to $19,999
- 1,285$20,000 to $29,999
- 1,314$30,000 to $39,999
- 1,088$40,000 to $49,999
- 1,087$50,000 to $59,999
- 2,176$60,000 to $74,999
- 1,955$75,000 to $99,999
- 1,046$100,000 to $124,999
- 779$125,000 to $149,999
- 865$150,000 to $199,999
- 244$200,000 or more
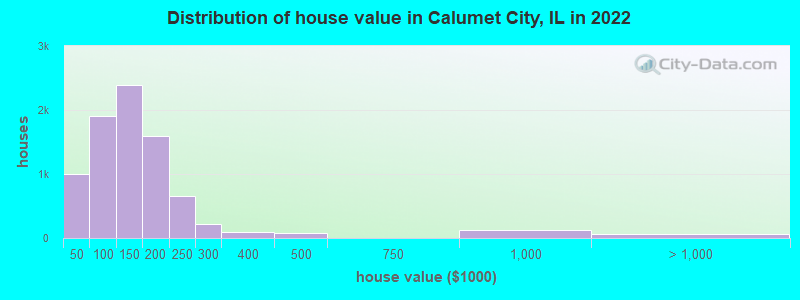
Home value of owner - occupied houses in 2022 in Calumet City, IL
-
- 363Less than $10,000
- 108$10,000 to $14,999
- 33$15,000 to $19,999
- 79$20,000 to $24,999
- 59$25,000 to $29,999
- 102$30,000 to $34,999
- 112$35,000 to $39,999
- 138$40,000 to $49,999
- 225$50,000 to $59,999
- 395$60,000 to $69,999
- 374$70,000 to $79,999
- 282$80,000 to $89,999
- 485$90,000 to $99,999
- 1,220$100,000 to $124,999
- 1,173$125,000 to $149,999
- 1,179$150,000 to $174,999
- 417$175,000 to $199,999
- 662$200,000 to $249,999
- 221$250,000 to $299,999
- 92$300,000 to $399,999
- 79$400,000 to $499,999
- 119$750,000 to $999,999
- 63$2,000,000 or more
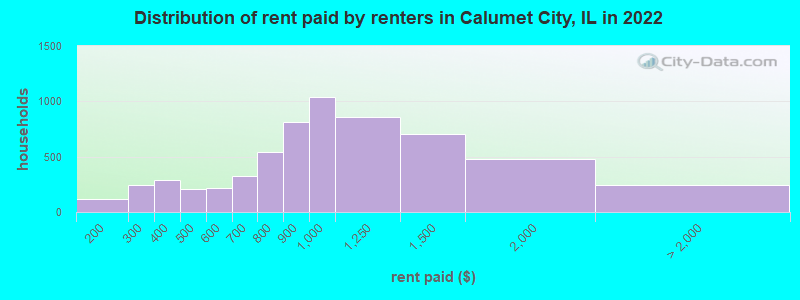
Rent paid by renters in 2022 in Calumet City, IL
-
- 19$100 to $149
- 99$150 to $199
- 84$200 to $249
- 156$250 to $299
- 203$300 to $349
- 83$350 to $399
- 110$400 to $449
- 98$450 to $499
- 151$500 to $549
- 63$550 to $599
- 220$600 to $649
- 104$650 to $699
- 203$700 to $749
- 338$750 to $799
- 811$800 to $899
- 1,042$900 to $999
- 862$1,000 to $1,249
- 708$1,250 to $1,499
- 481$1,500 to $1,999
- 21$3,000 to $3,499
- 14$3,500 or more
- 210No cash rent
Percentage of workers working in this county: 89.2%
Number of people working at home: 1,696 (10.5% of all workers)
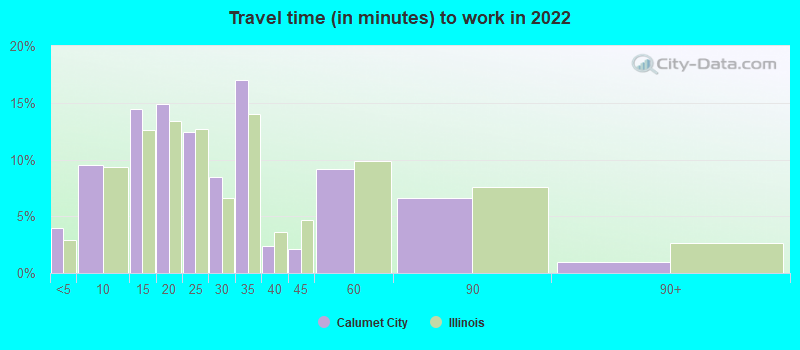
Travel time to work (commute)
- Less than 5 minutes: 262
- 5 to 9 minutes: 847
- 10 to 14 minutes: 1,171
- 15 to 19 minutes: 1,507
- 20 to 24 minutes: 1,830
- 25 to 29 minutes: 916
- 30 to 34 minutes: 2,450
- 35 to 39 minutes: 645
- 40 to 44 minutes: 660
- 45 to 59 minutes: 1,359
- 60 to 89 minutes: 1,516
- 90 or more minutes: 925
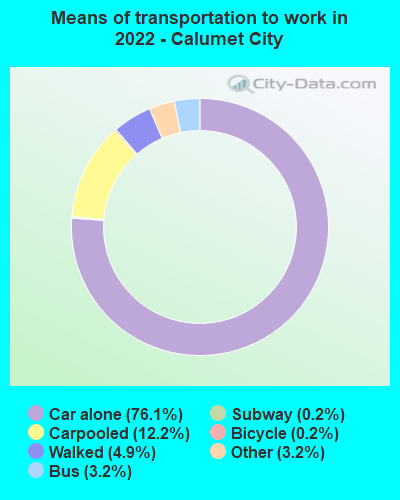
Means of transportation to work:
- Drove a car alone: 4,662 (61.6%)
- Carpooled: 803 (10.6%)
- Bus: 182 (2.4%)
- Long-distance train or commuter rail: 7 (0.1%)
- Taxi: 197 (2.6%)
- Bicycle: 11 (0.1%)
- Walked: 309 (4.1%)
- Worked at home: 1,696 (22.4%)
- Unemployment by race in 2022
- Unemployment rate for White non-Hispanic residents
- 5.4%Males
- 9.9%Females
- Unemployment rate for Black residents
- 8.9%Males
- 7.4%Females
- Unemployment rate for two or more race residents
- 35.7%Males
- Unemployment rate for Hispanic or Latino residents
- 5.7%Males
- 2.9%Females
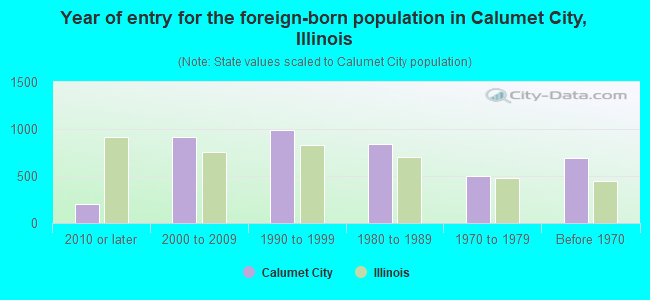
- Year of entry for the foreign-born population in Calumet City, Illinois
- 1972010 or later
- 9152000 to 2009
- 9851990 to 1999
- 8441980 to 1989
- 5041970 to 1979
- 692Before 1970
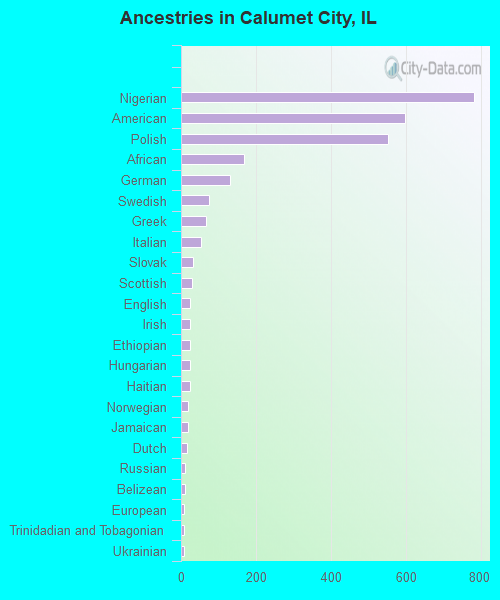
First ancestries reported:
- Nigerian: 783 (3.1%)
- American: 597 (2.4%)
- Polish: 552 (2.2%)
- African: 167 (0.7%)
- German: 131 (0.5%)
- Swedish: 75 (0.3%)
- Greek: 68 (0.3%)
- Italian: 54 (0.2%)
- Slovak: 33 (0.1%)
- Scottish: 30 (0.1%)
- English: 25 (0.1%)
- Irish: 25 (0.1%)
- Ethiopian: 24 (0.10%)
- Hungarian: 23 (0.09%)
- Haitian: 23 (0.09%)
- Norwegian: 19 (0.08%)
- Jamaican: 19 (0.08%)
- Dutch: 15 (0.06%)
- Russian: 12 (0.05%)
- Belizean: 10 (0.04%)
- European: 9 (0.04%)
- Trinidadian and Tobagonian: 9 (0.04%)
- Ukrainian: 8 (0.03%)
- Israeli: 6 (0.02%)
- Senegalese: 4 (0.02%)
Most common places of birth for foreign-born residents (%):
| Calumet City: | 72.0% (2,482) |
| Illinois: | 34.7% (626,958) |
| Calumet City: | 16.0% (552) |
| Illinois: | 1.2% (21,186) |
| Calumet City: | 2.0% (69) |
| Illinois: | 1.0% (18,753) |
| Calumet City: | 1.7% (58) |
| Illinois: | 0.3% (4,533) |
Place of birth for U.S.-born residents:
- This state: 25,298
- Other state: 5,158
- Northeast: 334
- Midwest: 1,999
- South: 2,506
- West: 273
86.9% of Calumet City residents lived in the same house 1 years ago.
Out of people who lived in different houses, 46.2% lived in this county.
Out of people who lived in different counties, 24.5% lived in Illinois.
| Calumet City: | 86.9% |
| State average: | 88.3% |
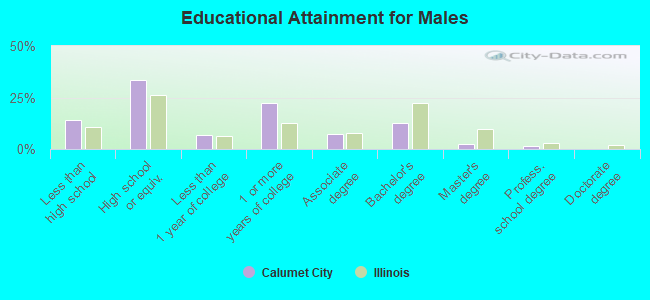
Education attainment for males 25 years and older:
- No schooling: 195
- Nursery to 4th grade: 65
- 5th and 6th grade: 391
- 7th and 8th grade: 35
- 9th grade: 64
- 10th grade: 299
- 11th grade: 211
- 12th grade, no diploma: 166
- High school graduate (or equivalency): 3,368
- Less than 1 year of college: 691
- Some college more than 1 year, no degree: 2,229
- Associate degree: 720
- Bachelor's degree: 1,247
- Master's degree: 220
- Professional school degree: 159
- Doctorate degree: 0
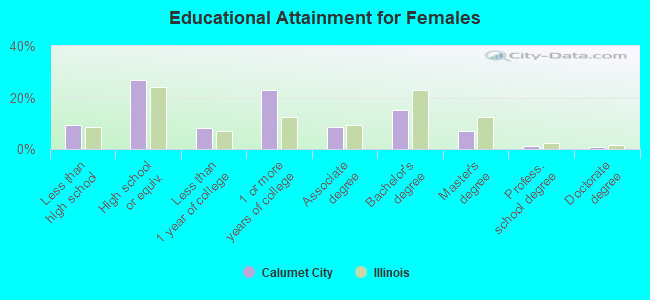
Education attainment for females 25 years and older:
- No schooling: 174
- Nursery to 4th grade: 19
- 5th and 6th grade: 239
- 7th and 8th grade: 259
- 9th grade: 10
- 10th grade: 167
- 11th grade: 108
- 12th grade, no diploma: 254
- High school graduate (or equivalency): 3,569
- Less than 1 year of college: 1,093
- Some college more than 1 year, no degree: 3,051
- Associate degree: 1,114
- Bachelor's degree: 2,028
- Master's degree: 917
- Professional school degree: 135
- Doctorate degree: 105


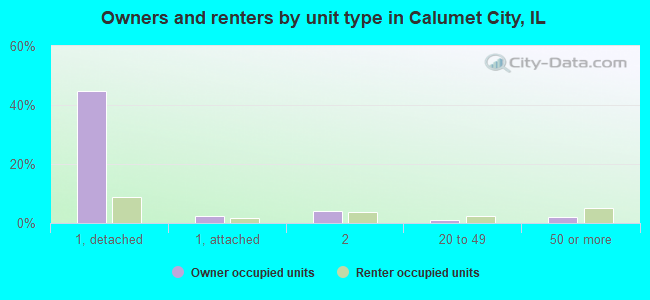
Housing units in structures:
- One, detached: 9,357
- One, attached: 637
- Two: 1,379
- 3 or 4: 1,210
- 5 to 9: 1,320
- 10 to 19: 684
- 20 to 49: 494
- 50 or more: 1,052
- Mobile homes: 564
- Boats, RVs, vans, etc.: 53
Median worth of mobile homes: $10,110
Housing units lacking complete kitchen facilities in 2022: 4.7%
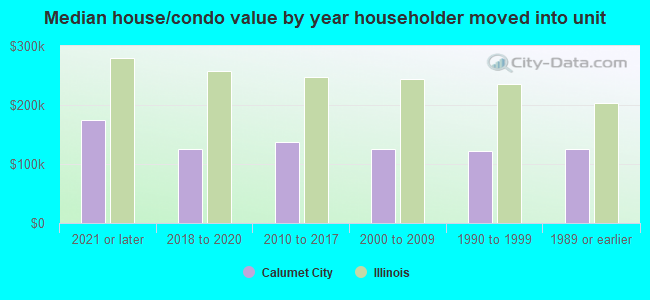
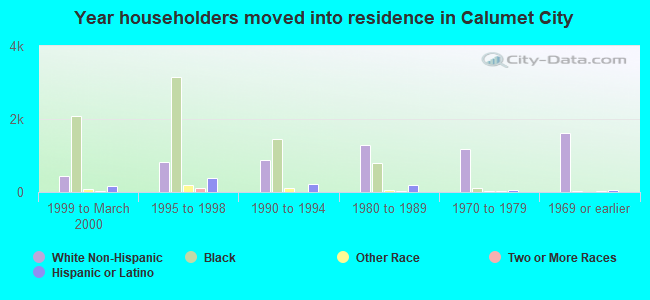
House/condo owner moved in on average 16 years ago
Renter moved in on average 5 years ago
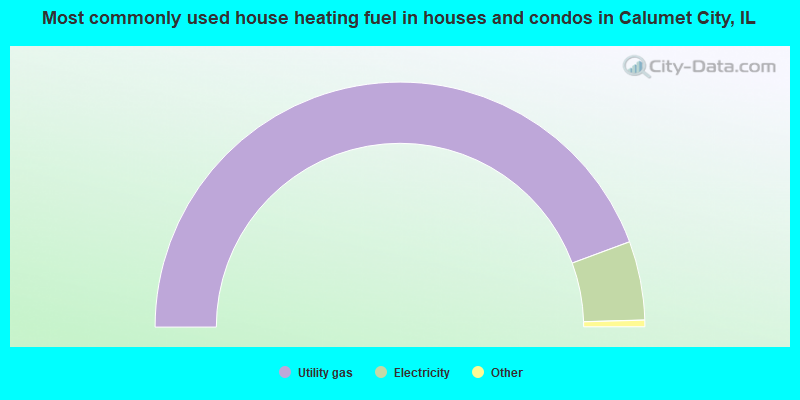
- 88.7%Utility gas
- 10.4%Electricity
- 0.7%Bottled, tank, or LP gas
- 0.2%No fuel used
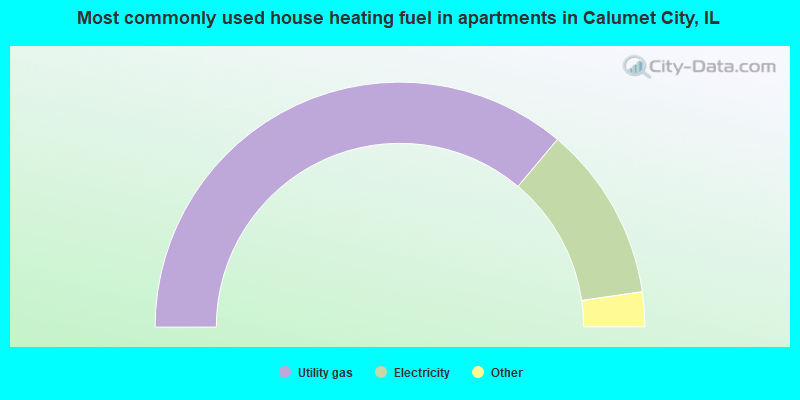
- 72.3%Utility gas
- 23.2%Electricity
- 3.4%No fuel used
- 0.6%Other fuel
- 0.6%Bottled, tank, or LP gas
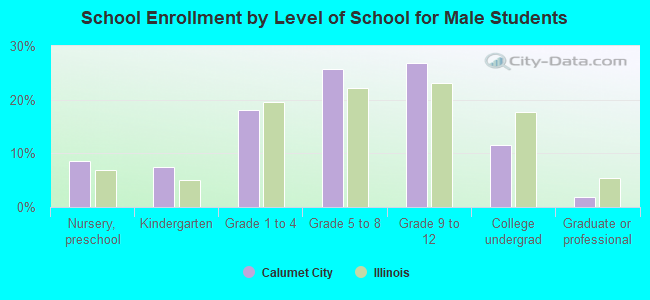
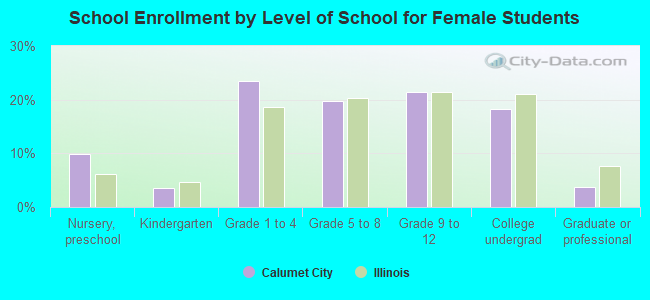
Private vs. public school enrollment:
| Here: | 6.1% |
| Illinois: | 13.3% |
| Here: | 4.9% |
| Illinois: | 9.9% |
| Here: | 31.8% |
| Illinois: | 27.4% |