Calexico, CA (California) Houses and Residents
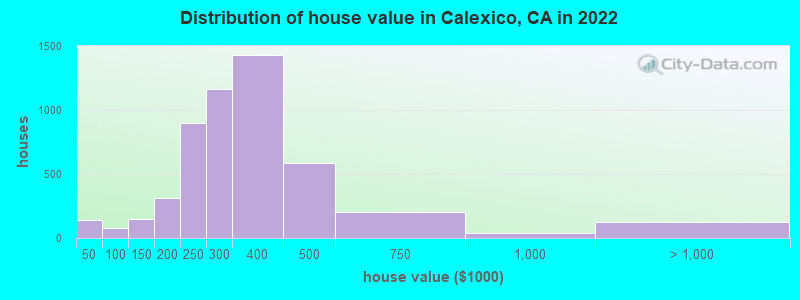
Estimated median house or condo value in 2022: $301,332 (it was $106,300 in 2000 )
Calexico:
$301,332California:
$715,900
Lower value quartile - upper value quartile: $256,290 - $389,417Mean price in 2022: Detached houses: $347,436 Here:
$347,436State:
$988,808
Townhouses or other attached units: $186,764 Here:
$186,764State:
$838,546
In 2-unit structures: $93,571 Here:
$93,571State:
$1,138,100
In 3-to-4-unit structures: $103,767 Here:
$103,767State:
$824,253
Mobile homes: $50,109 Here:
$50,109State:
$184,506
Total population: 39,799 (Urban population: 27,033 (all inside urban clusters), Rural population: 9 (all nonfarm) )
Houses: 11,519 (9,523 occupied: 5,147 owner occupied, 5,022 renter occupied )
% of renters here:
49%State:
44%
Housing density: 1,850 houses/condos per square mile
Median price asked for vacant for-sale houses and condos in 2022 in this county: $232,391.
Median contract rent in 2022: $897 (lower quartile is $530, upper quartile is $1,184)
Median rent asked for vacant for-rent units in 2022: $689
Median gross rent in Calexico, CA in 2022: $1,079
Housing units in Calexico with a mortgage: 3,647 (122 second mortgage, 0 home equity loan, 119 both second mortgage and home equity loan )Houses without a mortgage: 32
Median household income for houses/condos with a mortgage: $87,553
Median household income for apartments without a mortgage: $84,587
Median monthly housing costs: $1,125
Data:
Median house or condo value ($)
Median house or condo value ($ change since 2000)
Median house or condo value ($) - White
Median house or condo value ($) - Black or African American
Median house or condo value ($) - Asian
Median house or condo value ($) - Hispanic or Latino
Median house or condo value ($) - American Indian and Alaska Native
Median house or condo value ($) - Multirace
Median house or condo value ($) - Other Race
Median price asked for mobile homes ($)
Household density (households per square mile)
Mean house or condo value by units in structure - 1, detached ($)
Mean house or condo value by units in structure - 1, attached ($)
Mean house or condo value by units in structure - 2 ($)
Mean house or condo value by units in structure by units in structure - 3 or 4 ($)
Mean house or condo value by units in structure - 5 or more ($)
Mean house or condo value by units in structure - Boat, RV, van, etc. ($)
Mean house or condo value by units in structure - Mobile home ($)
Median contract rent ($)
Median contract rent - Lower quartile ($)
Median contract rent - Upper quartile ($)
Median gross rent ($)
Urban houses (%)
Rural houses (%)
Houses occupied (%)
Houses occupied (% change since 2000)
Houses owner occupied (%)
Houses owner occupied (% change since 2000)
Houses renter occupied (%)
Houses renter occupied (% change since 2000)
Vacant housing units - For rent (%)
Vacant housing units - For rent (% change since 2000)
Vacant housing units - For sale only (%)
Vacant housing units - For sale only (% change since 2000)
Vacant housing units - Rented or sold, not occupied (%)
Vacant housing units - Rented or sold, not occupied (% change since 2000)
Vacant housing units - For seasonal, recreational, or occasional use (%)
Vacant housing units - For seasonal, recreational, or occasional use (% change since 2000)
Vacant housing units - For migrant workers (%)
Vacant housing units - For migrant workers (% change since 2000)
Vacant housing units - Other vacant (%)
Vacant housing units - Other vacant (% change since 2000)
Median monthly housing costs ($)
Median household income for houses/condos with a mortgage ($)
Median household income for houses/condos without a mortgage ($)
Median household income ($)
Median household income ($) - White
Median household income ($) - Black or African American
Median household income ($) - Asian
Median household income ($) - Hispanic or Latino
Median household income ($) - American Indian and Alaska Native
Median household income ($) - Multirace
Median household income ($) - Other Race
Mortgage status - with mortgage (%)
Mortgage status - with second mortgage (%)
Mortgage status - with home equity loan (%)
Mortgage status - with both second mortgage and home equity loan (%)
Mortgage status - without a mortgage (%)
Median year house/condo built
Median year apartment built
Household type by relationship - Male householder living alone (%)
Household type by relationship - Male householder not living alone (%)
Household type by relationship - Female householder living alone (%)
Household type by relationship - Female householder not living alone (%)
Household type by relationship - Opposite-Sex spouse (%)
Household type by relationship - Same-Sex spouse (%)
Household type by relationship - Opposite-Sex unmarried partner (%)
Household type by relationship - Same-Sex unmarried partner (%)
Household type by relationship - In group quarters (%)
Size of family households - 2-person household (%)
Size of family households - 3-person household (%)
Size of family households - 4-person household (%)
Size of family households - 5-person household (%)
Size of family households - 6-person household (%)
Size of family households - 7-or-more-person household (%)
Size of nonfamily households - 1-person household (%)
Size of nonfamily households - 2-person household (%)
Size of nonfamily households - 3-person household (%)
Size of nonfamily households - 4-person household (%)
Size of nonfamily households - 5-person household (%)
Size of nonfamily households - 6-person household (%)
Size of nonfamily households - 7-or-moreperson household (%)
Year house built - Built 2010 or later (%)
Year house built - Built 2000 to 2009 (%)
Year house built - Built 1990 to 1999 (%)
Year house built - Built 1980 to 1989 (%)
Year house built - Built 1970 to 1979 (%)
Year house built - Built 1960 to 1969 (%)
Year house built - Built 1950 to 1959 (%)
Year house built - Built 1940 to 1949 (%)
Year house built - Built 1939 or earlier (%)
Median number of rooms in houses and condos
Median number of rooms in apartments
Median number of bedrooms in owner occupied houses
Mean number of bedrooms in owner occupied houses
Median number of bedrooms in renter occupied houses
Mean number of bedrooms in renter occupied houses
Median number of vehichles in owner occupied houses
Mean number of vehichles in owner occupied houses
Median number of vehichles in renter occupied houses
Mean number of vehichles in renter occupied houses
Rooms in owner-occupied houses - 1 room (%)
Rooms in owner-occupied houses - 2 rooms (%)
Rooms in owner-occupied houses - 3 rooms (%)
Rooms in owner-occupied houses - 4 rooms (%)
Rooms in owner-occupied houses - 5 rooms (%)
Rooms in owner-occupied houses - 6 rooms (%)
Rooms in owner-occupied houses - 7 rooms (%)
Rooms in owner-occupied houses - 8 rooms (%)
Rooms in owner-occupied houses - 9+ rooms (%)
Rooms in renter-occupied houses - 1 room (%)
Rooms in renter-occupied houses - 2 rooms (%)
Rooms in renter-occupied houses - 3 rooms (%)
Rooms in renter-occupied houses - 4 rooms (%)
Rooms in renter-occupied houses - 5 rooms (%)
Rooms in renter-occupied houses - 6 rooms (%)
Rooms in renter-occupied houses - 7 rooms (%)
Rooms in renter-occupied houses - 8 rooms (%)
Rooms in renter-occupied houses - 9+ rooms (%)
Bedrooms in owner-occupied houses - no bedrooms (%)
Bedrooms in owner-occupied houses - 1 bedroom (%)
Bedrooms in owner-occupied houses - 2 bedrooms (%)
Bedrooms in owner-occupied houses - 3 bedrooms (%)
Bedrooms in owner-occupied houses - 4 bedrooms (%)
Bedrooms in owner-occupied houses - 5+ bedrooms (%)
Bedrooms in renter-occupied houses - no bedrooms (%)
Bedrooms in renter-occupied houses - 1 bedroom (%)
Bedrooms in renter-occupied houses - 2 bedrooms (%)
Bedrooms in renter-occupied houses - 3 bedrooms (%)
Bedrooms in renter-occupied houses - 4 bedrooms (%)
Bedrooms in renter-occupied houses - 5+ bedrooms (%)
Vehicles available in owner-occupied houses - no vehicle available (%)
Vehicles available in owner-occupied houses - 1 vehicle available(%)
Vehicles available in owner-occupied houses - 2 Vehicles available (%)
Vehicles available in owner-occupied houses - 3 Vehicles available (%)
Vehicles available in owner-occupied houses - 4 Vehicles available (%)
Vehicles available in owner-occupied houses - 5+ Vehicles available (%)
Vehicles available in renter-occupied houses - no vehicle available (%)
Vehicles available in renter-occupied houses - 1 vehicle available (%)
Vehicles available in renter-occupied houses - 2 Vehicles available (%)
Vehicles available in renter-occupied houses - 3 Vehicles available (%)
Vehicles available in renter-occupied houses - 4 Vehicles available (%)
Vehicles available in renter-occupied houses - 5+ Vehicles available (%)
Housing units in structures - 1, detached (%)
Housing units in structures - 1, attached (%)
Housing units in structures - 2 (%)
Housing units in structures - 3 or 4 (%)
Housing units in structures - 5 to 9 (%)
Housing units in structures - 10 to 19 (%)
Housing units in structures - 20 to 49 (%)
Housing units in structures - 50 or more (%)
Housing units in structures - Mobile home (%)
Housing units in structures - Boat, RV, van, etc. (%)
Housing units in structures - Owners - 1, detached (%)
Housing units in structures - Owners - 1, attached (%)
Housing units in structures - Owners - 2 (%)
Housing units in structures - Owners - 3 or 4 (%)
Housing units in structures - Owners - 5 to 9 (%)
Housing units in structures - Owners - 10 to 19 (%)
Housing units in structures - Owners - 20 to 49 (%)
Housing units in structures - Owners - 50 or more (%)
Housing units in structures - Owners - Mobile home (%)
Housing units in structures - Owners - Boat, RV, van, etc. (%)
Housing units in structures - Renters - 1, detached (%)
Housing units in structures - Renters - 1, attached (%)
Housing units in structures - Renters - 2 (%)
Housing units in structures - Renters - 3 or 4 (%)
Housing units in structures - Renters - 5 to 9 (%)
Housing units in structures - Renters - 10 to 19 (%)
Housing units in structures - Renters - 20 to 49 (%)
Housing units in structures - Renters - 50 or more (%)
Housing units in structures - Renters - Mobile home (%)
Housing units in structures - Renters - Boat, RV, van, etc. (%)
House/condo owner moved in on average (years ago)
Renter moved in on average (years ago)
Year householder moved into unit - Moved in 1999 to March 2000 (%)
Year householder moved into unit - Moved in 1999 to March 2000 (%) - White
Year householder moved into unit - Moved in 1999 to March 2000 (%) - Black or African American
Year householder moved into unit - Moved in 1999 to March 2000 (%) - Asian
Year householder moved into unit - Moved in 1999 to March 2000 (%) - Hispanic or Latino
Year householder moved into unit - Moved in 1999 to March 2000 (%) - American Indian and Alaska Native
Year householder moved into unit - Moved in 1999 to March 2000 (%) - Multirace
Year householder moved into unit - Moved in 1999 to March 2000 (%) - Other Race
Year householder moved into unit - Moved in 1995 to 1998 (%)
Year householder moved into unit - Moved in 1995 to 1998 (%) - White
Year householder moved into unit - Moved in 1995 to 1998 (%) - Black or African American
Year householder moved into unit - Moved in 1995 to 1998 (%) - Asian
Year householder moved into unit - Moved in 1995 to 1998 (%) - Hispanic or Latino
Year householder moved into unit - Moved in 1995 to 1998 (%) - American Indian and Alaska Native
Year householder moved into unit - Moved in 1995 to 1998 (%) - Multirace
Year householder moved into unit - Moved in 1995 to 1998 (%) - Other Race
Year householder moved into unit - Moved in 1990 to 1994 (%)
Year householder moved into unit - Moved in 1990 to 1994 (%) - White
Year householder moved into unit - Moved in 1990 to 1994 (%) - Black or African American
Year householder moved into unit - Moved in 1990 to 1994 (%) - Asian
Year householder moved into unit - Moved in 1990 to 1994 (%) - Hispanic or Latino
Year householder moved into unit - Moved in 1990 to 1994 (%) - American Indian and Alaska Native
Year householder moved into unit - Moved in 1990 to 1994 (%) - Multirace
Year householder moved into unit - Moved in 1990 to 1994 (%) - Other Race
Year householder moved into unit - Moved in 1980 to 1989 (%)
Year householder moved into unit - Moved in 1980 to 1989 (%) - White
Year householder moved into unit - Moved in 1980 to 1989 (%) - Black or African American
Year householder moved into unit - Moved in 1980 to 1989 (%) - Asian
Year householder moved into unit - Moved in 1980 to 1989 (%) - Hispanic or Latino
Year householder moved into unit - Moved in 1980 to 1989 (%) - American Indian and Alaska Native
Year householder moved into unit - Moved in 1980 to 1989 (%) - Multirace
Year householder moved into unit - Moved in 1980 to 1989 (%) - Other Race
Year householder moved into unit - Moved in 1970 to 1979 (%)
Year householder moved into unit - Moved in 1970 to 1979 (%) - White
Year householder moved into unit - Moved in 1970 to 1979 (%) - Black or African American
Year householder moved into unit - Moved in 1970 to 1979 (%) - Asian
Year householder moved into unit - Moved in 1970 to 1979 (%) - Hispanic or Latino
Year householder moved into unit - Moved in 1970 to 1979 (%) - American Indian and Alaska Native
Year householder moved into unit - Moved in 1970 to 1979 (%) - Multirace
Year householder moved into unit - Moved in 1970 to 1979 (%) - Other Race
Year householder moved into unit - Moved in 1969 or earlier (%)
Year householder moved into unit - Moved in 1969 or earlier (%) - White
Year householder moved into unit - Moved in 1969 or earlier (%) - Black or African American
Year householder moved into unit - Moved in 1969 or earlier (%) - Asian
Year householder moved into unit - Moved in 1969 or earlier (%) - Hispanic or Latino
Year householder moved into unit - Moved in 1969 or earlier (%) - American Indian and Alaska Native
Year householder moved into unit - Moved in 1969 or earlier (%) - Multirace
Year householder moved into unit - Moved in 1969 or earlier (%) - Other Race
Housing units lacking complete plumbing facilities (%)
Housing units lacking complete kitchen facilities (%)
House heating fuel used in houses and condos - Utility gas (%)
House heating fuel used in houses and condos - Bottled, tank, or LP gas (%)
House heating fuel used in houses and condos - Electricity (%)
House heating fuel used in houses and condos - Fuel oil, kerosene, etc. (%)
House heating fuel used in houses and condos - Coal or coke (%)
House heating fuel used in houses and condos - Wood (%)
House heating fuel used in houses and condos - Solar energy (%)
House heating fuel used in houses and condos - Other fuel (%)
House heating fuel used in houses and condos - No fuel used (%)
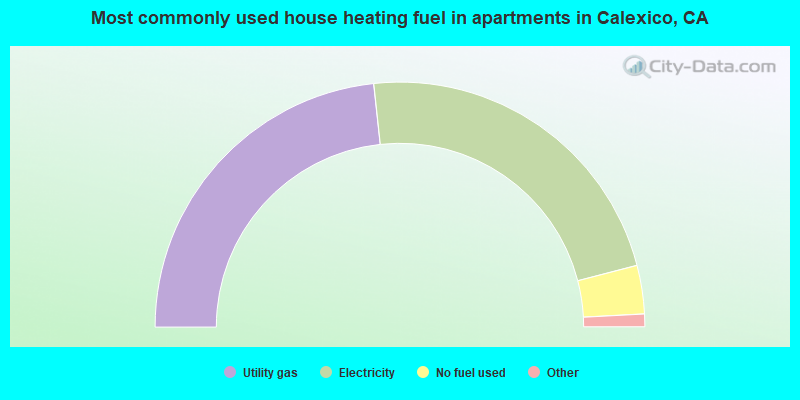
House heating fuel used in apartments - Utility gas (%)
House heating fuel used in apartments - Bottled, tank, or LP gas (%)
House heating fuel used in apartments - Electricity (%)
House heating fuel used in apartments - Fuel oil, kerosene, etc. (%)
House heating fuel used in apartments - Coal or coke (%)
House heating fuel used in apartments - Wood (%)
House heating fuel used in apartments - Solar energy (%)
House heating fuel used in apartments - Other fuel (%)
House heating fuel used in apartments - No fuel used (%)
Latest news about housing in Calexico, CA collected exclusively by city-data.com from local newspapers, TV, and radio stations
Median year house/condo built: 1995Median year apartment built: 1981Household type by relationship:
Households: 38,413
Male householders: 4,246 (764 living alone ), Female householders: 5,108 (1,243 living alone )4,374 spouses (4,192 opposite-sex spouses ), 210 unmarried partners , (198 opposite-sex unmarried partners ), 15,444 children (15,083 natural , 306 adopted , 53 stepchildren ), 2,763 grandchildren , 857 brothers or sisters , 2,354 parents , 0 foster children , 1,706 other relatives , 1,254 non-relatives In group quarters: 90
Size of family households: 1,529 2-persons , 1,858 3-persons , 1,982 4-persons , 1,349 5-persons , 864 6-persons , 691 7-or-more-persons .
Size of nonfamily households: 1,781 1-person , 91 2-persons , 29 3-persons , 21 4-persons , 39 6-persons .
4,706 married couples with children. single-parent households (502 men , 2,749 women ).
5.8% of residents of Calexico speak English at home. of residents speak Spanish at home (39% speak English very well , 28% speak English well , 15% speak English not well , 18% don't speak English at all ).of residents speak other Indo-European language at home (63% speak English very well , 37% speak English well ).of residents speak Asian or Pacific Island language at home (48% speak English very well , 1% speak English well , 24% speak English not well , 27% don't speak English at all ).
Foreign born population: 17,334 (45.1%)of them are naturalized citizens )
Median number of rooms in houses and condos:
Median number of rooms in apartments
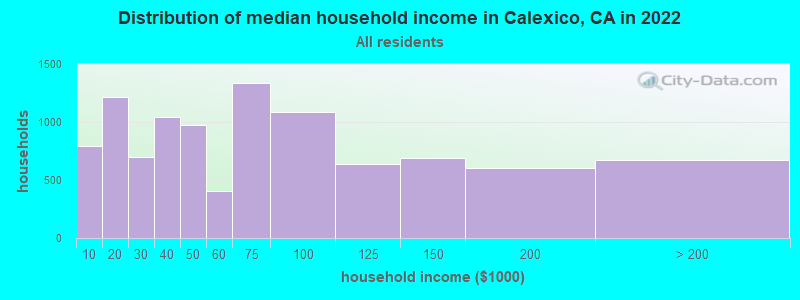
Calexico, CA household income distribution 797 Less than $10,0001,215 $10,000 to $19,999700 $20,000 to $29,9991,041 $30,000 to $39,999977 $40,000 to $49,999407 $50,000 to $59,9991,337 $60,000 to $74,9991,087 $75,000 to $99,999639 $100,000 to $124,999686 $125,000 to $149,999607 $150,000 to $199,999676 $200,000 or more
Home value of owner - occupied houses in 2022 in Calexico, CA 53 Less than $10,00035 $10,000 to $14,99911 $15,000 to $19,99916 $25,000 to $29,99911 $30,000 to $34,99913 $40,000 to $49,99922 $50,000 to $59,9995 $70,000 to $79,99938 $90,000 to $99,99983 $100,000 to $124,99967 $125,000 to $149,99992 $150,000 to $174,999222 $175,000 to $199,999894 $200,000 to $249,9991,164 $250,000 to $299,9991,426 $300,000 to $399,999584 $400,000 to $499,999206 $500,000 to $749,99940 $750,000 to $999,99943 $1,000,000 to $1,499,99980 $2,000,000 or moreRent paid by renters in 2022 in Calexico, CA 142 Less than $10052 $100 to $149133 $150 to $199105 $200 to $24944 $250 to $29956 $300 to $34987 $350 to $399262 $400 to $449129 $450 to $499452 $500 to $54935 $550 to $599150 $600 to $64972 $650 to $69984 $700 to $749167 $750 to $799589 $800 to $899446 $900 to $9991,052 $1,000 to $1,249367 $1,250 to $1,499238 $1,500 to $1,99946 $2,000 to $2,499242 No cash rent
Percentage of workers working in this county: 91.3%Number of people working at home: 759 (5.8% of all workers )
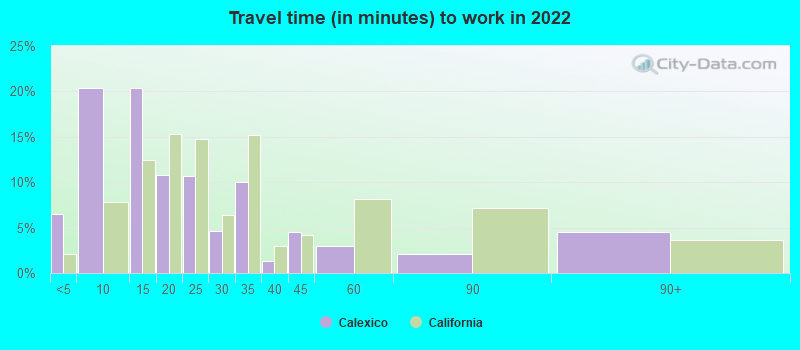
Travel time to work (commute)
Less than 5 minutes: 4375 to 9 minutes: 1,66410 to 14 minutes: 1,41515 to 19 minutes: 1,13220 to 24 minutes: 2,18625 to 29 minutes: 57630 to 34 minutes: 2,32635 to 39 minutes: 16240 to 44 minutes: 49945 to 59 minutes: 25360 to 89 minutes: 1,00990 or more minutes: 692
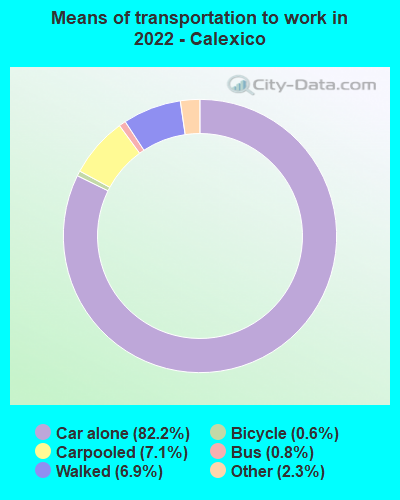
Means of transportation to work:
Drove a car alone: 5,305 (68.9%)Carpooled: 493 (6.4%)Bus : 45 (0.6%)Taxi: 157 (2.0%)Bicycle: 42 (0.5%)Walked: 473 (6.1%)Worked at home: 1,203 (15.6%)
Unemployment by race in 2022
Unemployment rate for White non-Hispanic residents 78.9% FemalesUnemployment rate for American Indian and Alaska Native residents 43.6% FemalesUnemployment rate for other race residents 13.3% Males20.6% FemalesUnemployment rate for two or more race residents 19.8% Males15.7% FemalesUnemployment rate for Hispanic or Latino residents 14.9% Males18.0% Females
Year of entry for the foreign-born population in Calexico, California
4,074 2010 or later 3,292 2000 to 2009 2,737 1990 to 1999 4,213 1980 to 1989 2,509 1970 to 1979 2,668 Before 1970
First ancestries reported:
American: 408 (1.2%)
Armenian: 18 (0.05%)
Italian: 13 (0.04%)
German: 3 (0.01%) Most common places of birth for foreign-born residents (%): Mexico Calexico:
93.5% (15,695)California:
37.2% (3,881,193)
Place of birth for U.S.-born residents:
This state: 19,899Other state: 761Northeast: 57Midwest: 53South: 96West: 549 92.0% of Calexico residents lived in the same house 1 years ago.
Out of people who lived in different houses, 43.7% lived in this county.
Out of people who lived in different counties, 72.0% lived in California.
Calexico:
92.0%State average:
88.9%
Education attainment for males 25 years and older:
No schooling: 577Nursery to 4th grade: 5685th and 6th grade: 4397th and 8th grade: 2689th grade: 65610th grade: 13211th grade: 23312th grade, no diploma: 487High school graduate (or equivalency): 2,309Less than 1 year of college: 557Some college more than 1 year, no degree: 1,187Associate degree: 1,341Bachelor's degree: 1,785Master's degree: 310Professional school degree: 131Doctorate degree: 0
Education attainment for females 25 years and older:
No schooling: 599Nursery to 4th grade: 3075th and 6th grade: 7637th and 8th grade: 6249th grade: 96210th grade: 19111th grade: 36112th grade, no diploma: 556High school graduate (or equivalency): 2,558Less than 1 year of college: 552Some college more than 1 year, no degree: 1,689Associate degree: 1,028Bachelor's degree: 2,309Master's degree: 423Professional school degree: 171Doctorate degree: 0
Housing units in structures:
One, detached: 7,460One, attached: 290Two: 5913 or 4: 1,2135 to 9: 84410 to 19: 40020 to 49: 18650 or more: 189Mobile homes: 269Boats, RVs, vans, etc.: 71Housing units lacking complete plumbing facilities in 2022: 0.1%Housing units lacking complete kitchen facilities in 2022: 0.7%House/condo owner moved in on average 14 years ago
Renter moved in on average 6 years ago
Private vs. public school enrollment:
Students in private schools in grades 1 to 8 (elementary and middle school): 57 Here:
1.2%California:
10.5%
Students in private schools in grades 9 to 12 (high school): 29 Students in private undergraduate colleges: 41 Here:
1.5%California:
15.9%