Burlington, VT (Vermont) Houses and Residents
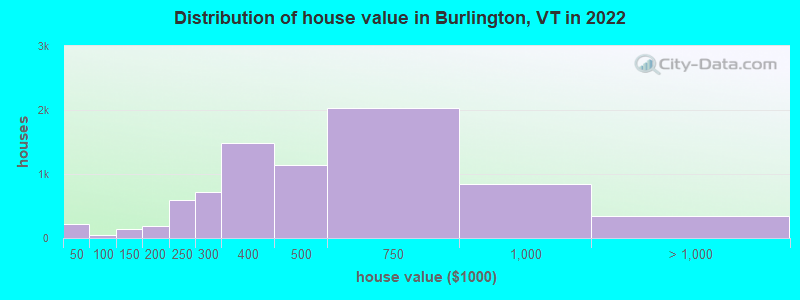
Estimated median house or condo value in 2022: $428,388 (it was $127,600 in 2000 )
Burlington:
$428,388Vermont:
$304,700
Lower value quartile - upper value quartile: $300,157 - $684,553Mean price in 2022: Detached houses: $540,237 Here:
$540,237State:
$378,260
Townhouses or other attached units: $359,939 Here:
$359,939State:
$360,670
In 2-unit structures: $410,317 Here:
$410,317State:
$304,383
In 3-to-4-unit structures: $3,547,093 Here:
$3,547,093State:
$746,315
In 5-or-more-unit structures: $317,798 Here:
$317,798State:
$259,595
Mobile homes: $34,154 Here:
$34,154State:
$98,266
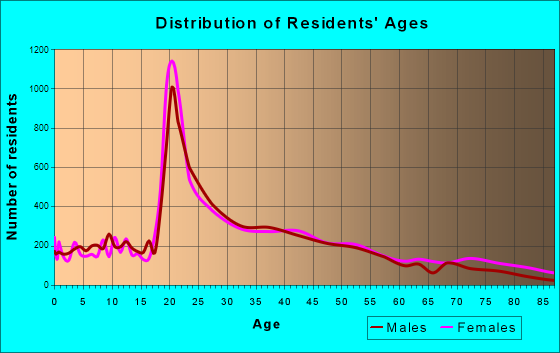
Total population: 42,211 (Urban population: 38,839, Rural population: 50 (all nonfarm) )
Houses: 18,626 (17,854 occupied: 7,247 owner occupied, 10,902 renter occupied )
% of renters here:
60%State:
26%
Housing density: 1,764 houses/condos per square mile
Median price asked for vacant for-sale houses and condos in 2022: $835,371.
Median contract rent in 2022: $1,421 (lower quartile is $1,007, upper quartile is $1,858)
Median rent asked for vacant for-rent units in 2022: $852
Median gross rent in Burlington, VT in 2022: $1,518
Housing units in Burlington with a mortgage: 4,996 (617 second mortgage, 29 home equity loan, 545 both second mortgage and home equity loan )Houses without a mortgage: 289
Median household income for houses/condos with a mortgage: $124,871
Median household income for apartments without a mortgage: $73,765
Median monthly housing costs: $1,553
Data:
Median house or condo value ($)
Median house or condo value ($ change since 2000)
Median house or condo value ($) - White
Median house or condo value ($) - Black or African American
Median house or condo value ($) - Asian
Median house or condo value ($) - Hispanic or Latino
Median house or condo value ($) - American Indian and Alaska Native
Median house or condo value ($) - Multirace
Median house or condo value ($) - Other Race
Median price asked for mobile homes ($)
Household density (households per square mile)
Mean house or condo value by units in structure - 1, detached ($)
Mean house or condo value by units in structure - 1, attached ($)
Mean house or condo value by units in structure - 2 ($)
Mean house or condo value by units in structure by units in structure - 3 or 4 ($)
Mean house or condo value by units in structure - 5 or more ($)
Mean house or condo value by units in structure - Boat, RV, van, etc. ($)
Mean house or condo value by units in structure - Mobile home ($)
Median contract rent ($)
Median contract rent - Lower quartile ($)
Median contract rent - Upper quartile ($)
Median gross rent ($)
Urban houses (%)
Rural houses (%)
Houses occupied (%)
Houses occupied (% change since 2000)
Houses owner occupied (%)
Houses owner occupied (% change since 2000)
Houses renter occupied (%)
Houses renter occupied (% change since 2000)
Vacant housing units - For rent (%)
Vacant housing units - For rent (% change since 2000)
Vacant housing units - For sale only (%)
Vacant housing units - For sale only (% change since 2000)
Vacant housing units - Rented or sold, not occupied (%)
Vacant housing units - Rented or sold, not occupied (% change since 2000)
Vacant housing units - For seasonal, recreational, or occasional use (%)
Vacant housing units - For seasonal, recreational, or occasional use (% change since 2000)
Vacant housing units - For migrant workers (%)
Vacant housing units - For migrant workers (% change since 2000)
Vacant housing units - Other vacant (%)
Vacant housing units - Other vacant (% change since 2000)
Median monthly housing costs ($)
Median household income for houses/condos with a mortgage ($)
Median household income for houses/condos without a mortgage ($)
Median household income ($)
Median household income ($) - White
Median household income ($) - Black or African American
Median household income ($) - Asian
Median household income ($) - Hispanic or Latino
Median household income ($) - American Indian and Alaska Native
Median household income ($) - Multirace
Median household income ($) - Other Race
Mortgage status - with mortgage (%)
Mortgage status - with second mortgage (%)
Mortgage status - with home equity loan (%)
Mortgage status - with both second mortgage and home equity loan (%)
Mortgage status - without a mortgage (%)
Median year house/condo built
Median year apartment built
Household type by relationship - Male householder living alone (%)
Household type by relationship - Male householder not living alone (%)
Household type by relationship - Female householder living alone (%)
Household type by relationship - Female householder not living alone (%)
Household type by relationship - Opposite-Sex spouse (%)
Household type by relationship - Same-Sex spouse (%)
Household type by relationship - Opposite-Sex unmarried partner (%)
Household type by relationship - Same-Sex unmarried partner (%)
Household type by relationship - In group quarters (%)
Size of family households - 2-person household (%)
Size of family households - 3-person household (%)
Size of family households - 4-person household (%)
Size of family households - 5-person household (%)
Size of family households - 6-person household (%)
Size of family households - 7-or-more-person household (%)
Size of nonfamily households - 1-person household (%)
Size of nonfamily households - 2-person household (%)
Size of nonfamily households - 3-person household (%)
Size of nonfamily households - 4-person household (%)
Size of nonfamily households - 5-person household (%)
Size of nonfamily households - 6-person household (%)
Size of nonfamily households - 7-or-moreperson household (%)
Year house built - Built 2010 or later (%)
Year house built - Built 2000 to 2009 (%)
Year house built - Built 1990 to 1999 (%)
Year house built - Built 1980 to 1989 (%)
Year house built - Built 1970 to 1979 (%)
Year house built - Built 1960 to 1969 (%)
Year house built - Built 1950 to 1959 (%)
Year house built - Built 1940 to 1949 (%)
Year house built - Built 1939 or earlier (%)
Median number of rooms in houses and condos
Median number of rooms in apartments
Median number of bedrooms in owner occupied houses
Mean number of bedrooms in owner occupied houses
Median number of bedrooms in renter occupied houses
Mean number of bedrooms in renter occupied houses
Median number of vehichles in owner occupied houses
Mean number of vehichles in owner occupied houses
Median number of vehichles in renter occupied houses
Mean number of vehichles in renter occupied houses
Rooms in owner-occupied houses - 1 room (%)
Rooms in owner-occupied houses - 2 rooms (%)
Rooms in owner-occupied houses - 3 rooms (%)
Rooms in owner-occupied houses - 4 rooms (%)
Rooms in owner-occupied houses - 5 rooms (%)
Rooms in owner-occupied houses - 6 rooms (%)
Rooms in owner-occupied houses - 7 rooms (%)
Rooms in owner-occupied houses - 8 rooms (%)
Rooms in owner-occupied houses - 9+ rooms (%)
Rooms in renter-occupied houses - 1 room (%)
Rooms in renter-occupied houses - 2 rooms (%)
Rooms in renter-occupied houses - 3 rooms (%)
Rooms in renter-occupied houses - 4 rooms (%)
Rooms in renter-occupied houses - 5 rooms (%)
Rooms in renter-occupied houses - 6 rooms (%)
Rooms in renter-occupied houses - 7 rooms (%)
Rooms in renter-occupied houses - 8 rooms (%)
Rooms in renter-occupied houses - 9+ rooms (%)
Bedrooms in owner-occupied houses - no bedrooms (%)
Bedrooms in owner-occupied houses - 1 bedroom (%)
Bedrooms in owner-occupied houses - 2 bedrooms (%)
Bedrooms in owner-occupied houses - 3 bedrooms (%)
Bedrooms in owner-occupied houses - 4 bedrooms (%)
Bedrooms in owner-occupied houses - 5+ bedrooms (%)
Bedrooms in renter-occupied houses - no bedrooms (%)
Bedrooms in renter-occupied houses - 1 bedroom (%)
Bedrooms in renter-occupied houses - 2 bedrooms (%)
Bedrooms in renter-occupied houses - 3 bedrooms (%)
Bedrooms in renter-occupied houses - 4 bedrooms (%)
Bedrooms in renter-occupied houses - 5+ bedrooms (%)
Vehicles available in owner-occupied houses - no vehicle available (%)
Vehicles available in owner-occupied houses - 1 vehicle available(%)
Vehicles available in owner-occupied houses - 2 Vehicles available (%)
Vehicles available in owner-occupied houses - 3 Vehicles available (%)
Vehicles available in owner-occupied houses - 4 Vehicles available (%)
Vehicles available in owner-occupied houses - 5+ Vehicles available (%)
Vehicles available in renter-occupied houses - no vehicle available (%)
Vehicles available in renter-occupied houses - 1 vehicle available (%)
Vehicles available in renter-occupied houses - 2 Vehicles available (%)
Vehicles available in renter-occupied houses - 3 Vehicles available (%)
Vehicles available in renter-occupied houses - 4 Vehicles available (%)
Vehicles available in renter-occupied houses - 5+ Vehicles available (%)
Housing units in structures - 1, detached (%)
Housing units in structures - 1, attached (%)
Housing units in structures - 2 (%)
Housing units in structures - 3 or 4 (%)
Housing units in structures - 5 to 9 (%)
Housing units in structures - 10 to 19 (%)
Housing units in structures - 20 to 49 (%)
Housing units in structures - 50 or more (%)
Housing units in structures - Mobile home (%)
Housing units in structures - Boat, RV, van, etc. (%)
Housing units in structures - Owners - 1, detached (%)
Housing units in structures - Owners - 1, attached (%)
Housing units in structures - Owners - 2 (%)
Housing units in structures - Owners - 3 or 4 (%)
Housing units in structures - Owners - 5 to 9 (%)
Housing units in structures - Owners - 10 to 19 (%)
Housing units in structures - Owners - 20 to 49 (%)
Housing units in structures - Owners - 50 or more (%)
Housing units in structures - Owners - Mobile home (%)
Housing units in structures - Owners - Boat, RV, van, etc. (%)
Housing units in structures - Renters - 1, detached (%)
Housing units in structures - Renters - 1, attached (%)
Housing units in structures - Renters - 2 (%)
Housing units in structures - Renters - 3 or 4 (%)
Housing units in structures - Renters - 5 to 9 (%)
Housing units in structures - Renters - 10 to 19 (%)
Housing units in structures - Renters - 20 to 49 (%)
Housing units in structures - Renters - 50 or more (%)
Housing units in structures - Renters - Mobile home (%)
Housing units in structures - Renters - Boat, RV, van, etc. (%)
House/condo owner moved in on average (years ago)
Renter moved in on average (years ago)
Year householder moved into unit - Moved in 1999 to March 2000 (%)
Year householder moved into unit - Moved in 1999 to March 2000 (%) - White
Year householder moved into unit - Moved in 1999 to March 2000 (%) - Black or African American
Year householder moved into unit - Moved in 1999 to March 2000 (%) - Asian
Year householder moved into unit - Moved in 1999 to March 2000 (%) - Hispanic or Latino
Year householder moved into unit - Moved in 1999 to March 2000 (%) - American Indian and Alaska Native
Year householder moved into unit - Moved in 1999 to March 2000 (%) - Multirace
Year householder moved into unit - Moved in 1999 to March 2000 (%) - Other Race
Year householder moved into unit - Moved in 1995 to 1998 (%)
Year householder moved into unit - Moved in 1995 to 1998 (%) - White
Year householder moved into unit - Moved in 1995 to 1998 (%) - Black or African American
Year householder moved into unit - Moved in 1995 to 1998 (%) - Asian
Year householder moved into unit - Moved in 1995 to 1998 (%) - Hispanic or Latino
Year householder moved into unit - Moved in 1995 to 1998 (%) - American Indian and Alaska Native
Year householder moved into unit - Moved in 1995 to 1998 (%) - Multirace
Year householder moved into unit - Moved in 1995 to 1998 (%) - Other Race
Year householder moved into unit - Moved in 1990 to 1994 (%)
Year householder moved into unit - Moved in 1990 to 1994 (%) - White
Year householder moved into unit - Moved in 1990 to 1994 (%) - Black or African American
Year householder moved into unit - Moved in 1990 to 1994 (%) - Asian
Year householder moved into unit - Moved in 1990 to 1994 (%) - Hispanic or Latino
Year householder moved into unit - Moved in 1990 to 1994 (%) - American Indian and Alaska Native
Year householder moved into unit - Moved in 1990 to 1994 (%) - Multirace
Year householder moved into unit - Moved in 1990 to 1994 (%) - Other Race
Year householder moved into unit - Moved in 1980 to 1989 (%)
Year householder moved into unit - Moved in 1980 to 1989 (%) - White
Year householder moved into unit - Moved in 1980 to 1989 (%) - Black or African American
Year householder moved into unit - Moved in 1980 to 1989 (%) - Asian
Year householder moved into unit - Moved in 1980 to 1989 (%) - Hispanic or Latino
Year householder moved into unit - Moved in 1980 to 1989 (%) - American Indian and Alaska Native
Year householder moved into unit - Moved in 1980 to 1989 (%) - Multirace
Year householder moved into unit - Moved in 1980 to 1989 (%) - Other Race
Year householder moved into unit - Moved in 1970 to 1979 (%)
Year householder moved into unit - Moved in 1970 to 1979 (%) - White
Year householder moved into unit - Moved in 1970 to 1979 (%) - Black or African American
Year householder moved into unit - Moved in 1970 to 1979 (%) - Asian
Year householder moved into unit - Moved in 1970 to 1979 (%) - Hispanic or Latino
Year householder moved into unit - Moved in 1970 to 1979 (%) - American Indian and Alaska Native
Year householder moved into unit - Moved in 1970 to 1979 (%) - Multirace
Year householder moved into unit - Moved in 1970 to 1979 (%) - Other Race
Year householder moved into unit - Moved in 1969 or earlier (%)
Year householder moved into unit - Moved in 1969 or earlier (%) - White
Year householder moved into unit - Moved in 1969 or earlier (%) - Black or African American
Year householder moved into unit - Moved in 1969 or earlier (%) - Asian
Year householder moved into unit - Moved in 1969 or earlier (%) - Hispanic or Latino
Year householder moved into unit - Moved in 1969 or earlier (%) - American Indian and Alaska Native
Year householder moved into unit - Moved in 1969 or earlier (%) - Multirace
Year householder moved into unit - Moved in 1969 or earlier (%) - Other Race
Housing units lacking complete plumbing facilities (%)
Housing units lacking complete kitchen facilities (%)
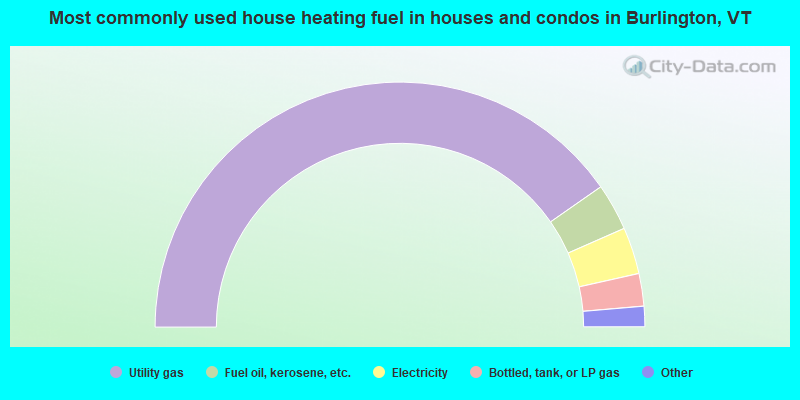
House heating fuel used in houses and condos - Utility gas (%)
House heating fuel used in houses and condos - Bottled, tank, or LP gas (%)
House heating fuel used in houses and condos - Electricity (%)
House heating fuel used in houses and condos - Fuel oil, kerosene, etc. (%)
House heating fuel used in houses and condos - Coal or coke (%)
House heating fuel used in houses and condos - Wood (%)
House heating fuel used in houses and condos - Solar energy (%)
House heating fuel used in houses and condos - Other fuel (%)
House heating fuel used in houses and condos - No fuel used (%)
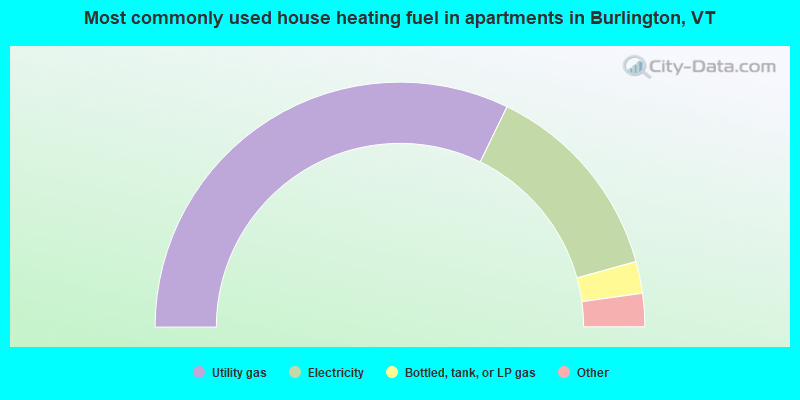
House heating fuel used in apartments - Utility gas (%)
House heating fuel used in apartments - Bottled, tank, or LP gas (%)
House heating fuel used in apartments - Electricity (%)
House heating fuel used in apartments - Fuel oil, kerosene, etc. (%)
House heating fuel used in apartments - Coal or coke (%)
House heating fuel used in apartments - Wood (%)
House heating fuel used in apartments - Solar energy (%)
House heating fuel used in apartments - Other fuel (%)
House heating fuel used in apartments - No fuel used (%)
Latest news about housing in Burlington, VT collected exclusively by city-data.com from local newspapers, TV, and radio stations
Median year house/condo built: 1957Median year apartment built: 1958Household type by relationship:
Households: 44,909
Male householders: 8,274 (2,909 living alone ), Female householders: 9,276 (3,352 living alone )4,540 spouses (4,433 opposite-sex spouses ), 2,184 unmarried partners , (1,885 opposite-sex unmarried partners ), 5,938 children (5,632 natural , 166 adopted , 139 stepchildren ), 364 grandchildren , 447 brothers or sisters , 243 parents , 2 foster children , 180 other relatives , 5,892 non-relatives In group quarters: 7,564
Size of family households: 3,235 2-persons , 1,748 3-persons , 1,096 4-persons , 230 5-persons , 91 6-persons , 43 7-or-more-persons .
Size of nonfamily households: 6,550 1-person , 3,765 2-persons , 629 3-persons , 677 4-persons , 321 5-persons , 22 6-persons .
2,858 married couples with children. single-parent households (401 men , 992 women ).
89.7% of residents of Burlington speak English at home. of residents speak Spanish at home (84% speak English very well , 11% speak English well , 5% speak English not well ).of residents speak other Indo-European language at home (69% speak English very well , 19% speak English well , 11% speak English not well , 1% don't speak English at all ).of residents speak Asian or Pacific Island language at home (44% speak English very well , 42% speak English well , 11% speak English not well , 3% don't speak English at all ).of residents speak other language at home (44% speak English very well , 6% speak English well , 50% speak English not well ).
Foreign born population: 3,223 (7.2%)of them are naturalized citizens )
Median number of rooms in houses and condos:
Median number of rooms in apartments
Owner-occupied Renter-occupied
Rooms in owner-occupied houses in Burlington, Vermont
24 1 room 123 2 rooms 408 3 rooms 770 4 rooms 1,299 5 rooms 1,476 6 rooms 1,295 7 rooms 836 8 rooms 1,016 9+ rooms
Rooms in renter-occupied apartments in Burlington, Vermont
854 1 room 1,307 2 rooms 2,448 3 rooms 2,655 4 rooms 1,576 5 rooms 1,005 6 rooms 547 7 rooms 317 8 rooms 195 9+ rooms
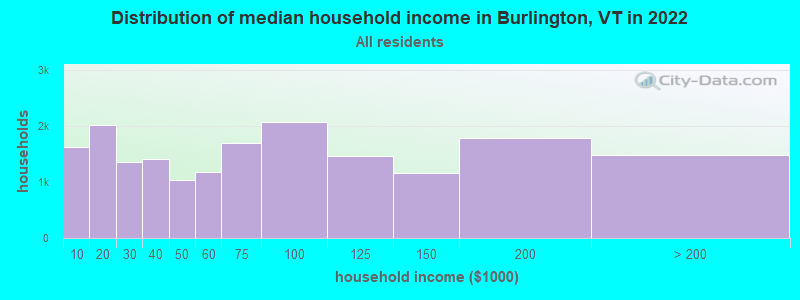
Burlington, VT household income distribution 1,620 Less than $10,0002,010 $10,000 to $19,9991,360 $20,000 to $29,9991,404 $30,000 to $39,9991,043 $40,000 to $49,9991,170 $50,000 to $59,9991,700 $60,000 to $74,9992,069 $75,000 to $99,9991,460 $100,000 to $124,9991,164 $125,000 to $149,9991,781 $150,000 to $199,9991,478 $200,000 or more
Home value of owner - occupied houses in 2022 in Burlington, VT 72 Less than $10,00017 $10,000 to $14,99911 $20,000 to $24,99985 $25,000 to $29,9996 $35,000 to $39,99924 $40,000 to $49,99915 $50,000 to $59,99910 $70,000 to $79,9994 $80,000 to $89,99997 $100,000 to $124,99939 $125,000 to $149,99969 $150,000 to $174,999114 $175,000 to $199,999590 $200,000 to $249,999714 $250,000 to $299,9991,484 $300,000 to $399,9991,136 $400,000 to $499,9992,036 $500,000 to $749,999838 $750,000 to $999,999206 $1,000,000 to $1,499,99926 $1,500,000 to $1,999,999106 $2,000,000 or moreRent paid by renters in 2022 in Burlington, VT 37 Less than $100123 $100 to $14921 $150 to $19971 $200 to $249317 $250 to $29989 $300 to $349130 $350 to $399123 $400 to $44944 $450 to $49971 $500 to $549157 $550 to $599128 $600 to $649105 $650 to $699205 $700 to $74949 $750 to $799329 $800 to $899759 $900 to $9991,357 $1,000 to $1,2491,743 $1,250 to $1,4992,777 $1,500 to $1,9991,154 $2,000 to $2,499145 $2,500 to $2,999253 $3,000 to $3,49960 $3,500 or more238 No cash rent
Percentage of workers working in this county: 93.2%Number of people working at home: 3,964 (15.7% of all workers )
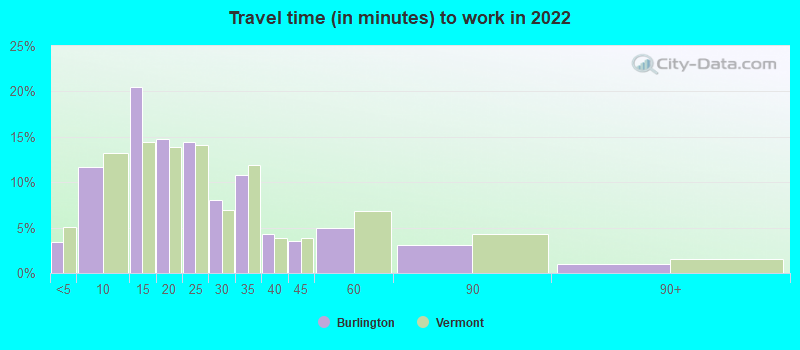
Travel time to work (commute)
Less than 5 minutes: 9635 to 9 minutes: 3,41910 to 14 minutes: 5,47515 to 19 minutes: 3,73620 to 24 minutes: 2,48325 to 29 minutes: 1,60930 to 34 minutes: 1,77935 to 39 minutes: 25840 to 44 minutes: 45245 to 59 minutes: 63460 to 89 minutes: 37090 or more minutes: 168
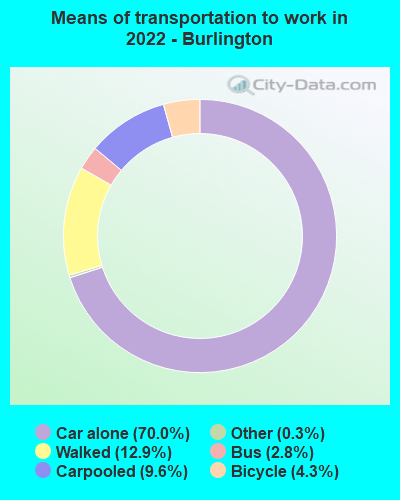
Means of transportation to work:
Drove a car alone: 22,821 (63.0%)Carpooled: 3,039 (8.4%)Bus : 485 (1.3%)Subway or elevated rail : 47 (0.1%)Ferryboat: 10 (0.0%)Taxi: 57 (0.2%)Bicycle: 1,146 (3.2%)Walked: 4,572 (12.6%)Worked at home: 3,964 (10.9%)
Unemployment by race in 2022
Unemployment rate for White non-Hispanic residents 4.4% Males3.4% FemalesUnemployment rate for Black residents 16.6% MalesUnemployment rate for Asian residents 3.9% FemalesUnemployment rate for other race residents 13.5% FemalesUnemployment rate for two or more race residents 1.8% MalesUnemployment rate for Hispanic or Latino residents 2.1% Males7.9% Females
Year of entry for the foreign-born population in Burlington, Vermont
1,352 2010 or later 547 2000 to 2009 816 1990 to 1999 499 1980 to 1989 200 1970 to 1979 516 Before 1970
First ancestries reported:
Irish: 1,962 (12.9%)
English: 1,810 (11.9%)
American: 1,058 (7.0%)
French Canadian: 1,028 (6.8%)
Italian: 845 (5.6%)
German: 775 (5.1%)
French: 622 (4.1%)
European: 580 (3.8%)
Scottish: 405 (2.7%)
Polish: 329 (2.2%)
Somali: 297 (2.0%)
Yugoslavian: 224 (1.5%)
Eastern European: 173 (1.1%)
British: 131 (0.9%)
Scandinavian: 127 (0.8%)
Dutch: 115 (0.8%)
Canadian: 113 (0.7%)
Scotch-Irish: 103 (0.7%)
Armenian: 102 (0.7%)
Northern European: 86 (0.6%)
Greek: 81 (0.5%)
Russian: 79 (0.5%)
Ukrainian: 79 (0.5%)
Jamaican: 70 (0.5%)
Swedish: 69 (0.5%)
Portuguese: 55 (0.4%)
Norwegian: 51 (0.3%)
Hungarian: 45 (0.3%)
Arab: 45 (0.3%)
Haitian: 45 (0.3%)
Nigerian: 44 (0.3%)
Welsh: 44 (0.3%)
Albanian: 42 (0.3%)
Iranian: 37 (0.2%)
Lebanese: 37 (0.2%)
Turkish: 31 (0.2%)
Czech: 28 (0.2%)
Ghanaian: 27 (0.2%)
South African: 23 (0.2%)
Serbian: 22 (0.1%)
Slovak: 21 (0.1%)
Sudanese: 18 (0.1%)
British West Indian: 18 (0.1%)
Cajun: 17 (0.1%)
Romanian: 13 (0.09%)
Lithuanian: 12 (0.08%)
Barbadian: 9 (0.06%)
Czechoslovakian: 7 (0.05%)
Croatian: 5 (0.03%)
Palestinian: 5 (0.03%)
Iraqi: 5 (0.03%)
Finnish: 5 (0.03%)
Austrian: 5 (0.03%)
Celtic: 4 (0.03%)
New Zealander: 4 (0.03%)
Danish: 4 (0.03%)
Slovene: 1 (0.01%)
Swiss: 1 (0.01%)
Most common places of birth for foreign-born residents (%): China, excluding Hong Kong and Taiwan Burlington:
13.3% (465)Vermont:
6.0% (1,706)
Canada Burlington:
10.5% (366)Vermont:
18.5% (5,219)
Bosnia and Herzegovina Burlington:
6.3% (221)Vermont:
3.1% (866)
Vietnam Burlington:
5.4% (190)Vermont:
1.8% (504)
Turkey Burlington:
4.8% (168)Vermont:
0.7% (197)
Sudan Burlington:
4.6% (162)Vermont:
0.6% (159)
Democratic Republic of Congo (Zaire) Burlington:
4.6% (160)Vermont:
1.2% (333)
Jamaica Burlington:
4.2% (147)Vermont:
1.8% (520)
Somalia Burlington:
4.0% (141)Vermont:
0.8% (235)
India Burlington:
3.5% (124)Vermont:
3.9% (1,087)
South Africa Burlington:
3.3% (115)Vermont:
0.7% (189)
Nepal Burlington:
3.2% (112)Vermont:
3.2% (902)
Uruguay Burlington:
2.6% (90)Vermont:
0.5% (131)
Venezuela Burlington:
1.7% (59)Vermont:
0.7% (188)
Iraq Burlington:
1.5% (54)Vermont:
0.5% (132)
Place of birth for U.S.-born residents:
This state: 13,588Other state: 28,426Northeast: 17,792Midwest: 4,212South: 4,602West: 1,888 66.7% of Burlington residents lived in the same house 1 years ago.
Out of people who lived in different houses, 32.8% lived in this county.
Out of people who lived in different counties, 15.9% lived in Vermont.
Burlington:
66.7%State average:
88.2%
Education attainment for males 25 years and older:
No schooling: 105Nursery to 4th grade: 65th and 6th grade: 217th and 8th grade: 919th grade: 10510th grade: 511th grade: 10312th grade, no diploma: 160High school graduate (or equivalency): 1,578Less than 1 year of college: 215Some college more than 1 year, no degree: 1,532Associate degree: 756Bachelor's degree: 4,810Master's degree: 1,545Professional school degree: 631Doctorate degree: 695
Education attainment for females 25 years and older:
No schooling: 21Nursery to 4th grade: 45th and 6th grade: 137th and 8th grade: 639th grade: 13310th grade: 1911th grade: 13712th grade, no diploma: 245High school graduate (or equivalency): 1,388Less than 1 year of college: 476Some college more than 1 year, no degree: 1,023Associate degree: 608Bachelor's degree: 4,263Master's degree: 3,282Professional school degree: 756Doctorate degree: 424
Housing units in structures:
One, detached: 6,169One, attached: 1,335Two: 1,9583 or 4: 2,6605 to 9: 2,64310 to 19: 1,38620 to 49: 1,29850 or more: 936Mobile homes: 238Housing units lacking complete plumbing facilities in 2022: 0.7%Housing units lacking complete kitchen facilities in 2022: 1.8%House/condo owner moved in on average 11 years ago
Renter moved in on average 1 years ago
Private vs. public school enrollment:
Students in private schools in grades 1 to 8 (elementary and middle school): 157 Students in private schools in grades 9 to 12 (high school): 165 Students in private undergraduate colleges: 1,314