Jump to a detailed profile or search site with Google Custom Search

Broomfield, CO (Colorado) Houses and Residents

Estimated median house or condo value in 2022: $644,200 (it was $182,200 in 2000)
Broomfield:

$644,200
Colorado:

$531,100
Lower value quartile - upper value quartile: $513,100 - $811,600

Mean price in 2022:

Detached houses: $700,522
Here:

$700,522
State:

$676,667

Townhouses or other attached units: $450,760
Here:

$450,760
State:

$526,340

In 5-or-more-unit structures: $331,639
Here:

$331,639
State:

$417,586

Mobile homes: $76,082
Here:

$76,082
State:

$115,510

Total population: 62,138 (Urban population: 38,226, Rural population: 71 (11 farm, 60 nonfarm))

Houses: 32,822 (31,244 occupied: 19,754 owner occupied, 11,490 renter occupied)

% of renters here:

37%
State:

34%

Housing density: 1,211 houses/condos per square mile

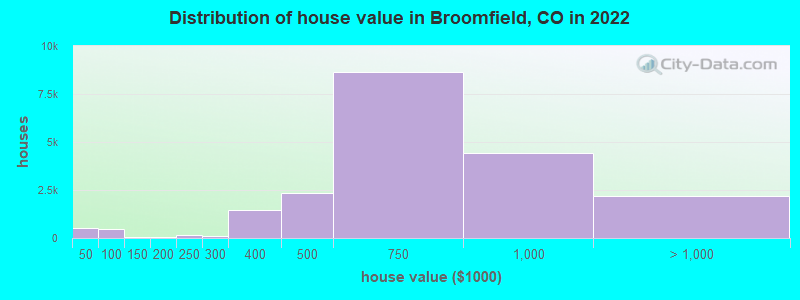
Median price asked for vacant for-sale houses and condos in 2022: $633,099.

Median contract rent in 2022: $1,846 (lower quartile is $1,513, upper quartile is over $2,000)


Median rent asked for vacant for-rent units in 2022: $2,820


Median gross rent in Broomfield, CO in 2022: $1,951

Housing units in Broomfield with a mortgage: 13,103 (1,161 second mortgage, 0 home equity loan, 1,055 both second mortgage and home equity loan)
Houses without a mortgage: 576

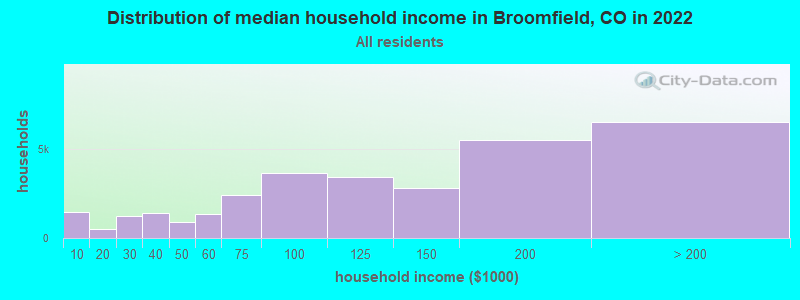
Median household income for houses/condos with a mortgage: $168,472

Median household income for apartments without a mortgage: $105,979

Median monthly housing costs: $1,909

Compare current foreclosures in Broomfield, CO:

Check out more offers in Broomfield, CO.
Powered by Foreclosure.com

Settings
X
Data:
Loading data...
Based on 2000-2022 data
Loading data...

123
Hide US histogram

Latest news about housing in Broomfield, CO collected exclusively by city-data.com from local newspapers, TV, and radio stations

Broomfield, Colorado Age and Sex of Residents
Median year house/condo built: 1998

Median year apartment built: 2010

Household type by relationship:

Households: 76,121
  • Male householders: 16,455 (4,823 living alone), Female householders: 14,789 (4,843 living alone)
  • 16,444 spouses (16,375 opposite-sex spouses), 2,120 unmarried partners, (1,917 opposite-sex unmarried partners), 20,015 children (19,113 natural, 421 adopted, 481 stepchildren), 779 grandchildren, 640 brothers or sisters, 1,057 parents, 0 foster children, 390 other relatives, 3,023 non-relatives
  • In group quarters: 409

Size of family households: 8,728 2-persons, 3,981 3-persons, 4,095 4-persons, 1,609 5-persons, 185 6-persons, 650 7-or-more-persons.

Size of nonfamily households: 9,666 1-person, 2,139 2-persons, 132 3-persons, 59 4-persons.

11,790 married couples with children.
2,596 single-parent households (657 men, 1,939 women).

86.3% of residents of Broomfield speak English at home.
5.5% of residents speak Spanish at home (77% speak English very well, 11% speak English well, 12% speak English not well, 1% don't speak English at all).
4.1% of residents speak other Indo-European language at home (83% speak English very well, 14% speak English well, 2% speak English not well).
3.6% of residents speak Asian or Pacific Island language at home (75% speak English very well, 15% speak English well, 8% speak English not well, 2% don't speak English at all).
0.7% of residents speak other language at home (68% speak English very well, 8% speak English well, 24% speak English not well).

Foreign born population: 9,284 (12.2%)
(51.2% of them are naturalized citizens)

Median number of rooms in houses and condos:
Here:

7.2
State:

6.8

Median number of rooms in apartments
Here:

3.4
State:

4.0

Owner-occupied Renter-occupied
Bedrooms in owner-occupied houses and condos in Broomfield, Colorado
  • Bedrooms in owner-occupied houses and condos in Broomfield, Colorado
  • 40no bedroom
  • 6121 bedroom
  • 2,4312 bedrooms
  • 7,2973 bedrooms
  • 6,5704 bedrooms
  • 2,8045+ bedrooms
Bedrooms in renter-occupied apartments in Broomfield, Colorado
  • Bedrooms in renter-occupied apartments in Broomfield, Colorado
  • 586no bedroom
  • 3,8991 bedroom
  • 4,6192 bedrooms
  • 1,3473 bedrooms
  • 6164 bedrooms
  • 4235+ bedrooms
Owner-occupied Renter-occupied
Cars and other vehicles available in Broomfield in owner-occupied houses/condos
  • Cars and other vehicles available in Broomfield in owner-occupied houses/condos
  • 319no vehicle
  • 4,7181 vehicle
  • 9,4262 vehicles
  • 3,5533 vehicles
  • 9554 vehicles
  • 7835+ vehicles
Cars and other vehicles available in Broomfield in renter-occupied apartments
  • Cars and other vehicles available in Broomfield in renter-occupied apartments
  • 975no vehicle
  • 5,8501 vehicle
  • 3,3662 vehicles
  • 1,0493 vehicles
  • 2114 vehicles
  • 395+ vehicles
Owner-occupied Renter-occupied
Rooms in owner-occupied houses in Broomfield, Colorado
  • Rooms in owner-occupied houses in Broomfield, Colorado
  • 401 room
  • 742 rooms
  • 6433 rooms
  • 1,3704 rooms
  • 2,0915 rooms
  • 3,5676 rooms
  • 3,1417 rooms
  • 2,7018 rooms
  • 6,1279+ rooms
Rooms in renter-occupied apartments in Broomfield, Colorado
  • Rooms in renter-occupied apartments in Broomfield, Colorado
  • 5861 room
  • 2,1982 rooms
  • 3,2713 rooms
  • 2,0584 rooms
  • 1,5625 rooms
  • 9456 rooms
  • 1307 rooms
  • 3658 rooms
  • 3759+ rooms
Year house built
Median 2022 house/condo value by year built
Median house/condo value by year householder moved into unit
Breakdown of mean house values by ages of householders
Owners and renters by unit type in Broomfield, CO
  • Broomfield, CO household income distribution

  • Distribution of median household income in Broomfield, CO in 2022
  • 1,447Less than $10,000
  • 516$10,000 to $19,999
  • 1,245$20,000 to $29,999
  • 1,421$30,000 to $39,999
  • 903$40,000 to $49,999
  • 1,362$50,000 to $59,999
  • 2,411$60,000 to $74,999
  • 3,644$75,000 to $99,999
  • 3,445$100,000 to $124,999
  • 2,797$125,000 to $149,999
  • 5,513$150,000 to $199,999
  • 6,540$200,000 or more
  • Home value of owner - occupied houses in 2022 in Broomfield, CO

  • Distribution of house value in Broomfield, CO in 2022
  • 214Less than $10,000
  • 38$10,000 to $14,999
  • 4$15,000 to $19,999
  • 93$25,000 to $29,999
  • 45$30,000 to $34,999
  • 32$35,000 to $39,999
  • 73$40,000 to $49,999
  • 107$50,000 to $59,999
  • 149$60,000 to $69,999
  • 58$70,000 to $79,999
  • 40$80,000 to $89,999
  • 52$90,000 to $99,999
  • 29$100,000 to $124,999
  • 6$125,000 to $149,999
  • 33$150,000 to $174,999
  • 15$175,000 to $199,999
  • 153$200,000 to $249,999
  • 93$250,000 to $299,999
  • 1,460$300,000 to $399,999
  • 2,318$400,000 to $499,999
  • 8,626$500,000 to $749,999
  • 4,434$750,000 to $999,999
  • 1,671$1,000,000 to $1,499,999
  • 471$1,500,000 to $1,999,999
  • 67$2,000,000 or more
  • Rent paid by renters in 2022 in Broomfield, CO

  • Distribution of rent paid by renters in Broomfield, CO in 2022
  • 16Less than $100
  • 34$200 to $249
  • 52$250 to $299
  • 8$300 to $349
  • 4$350 to $399
  • 8$400 to $449
  • 5$450 to $499
  • 14$500 to $549
  • 27$550 to $599
  • 24$600 to $649
  • 22$650 to $699
  • 16$700 to $749
  • 6$750 to $799
  • 104$800 to $899
  • 183$900 to $999
  • 557$1,000 to $1,249
  • 914$1,250 to $1,499
  • 4,690$1,500 to $1,999
  • 2,970$2,000 to $2,499
  • 837$2,500 to $2,999
  • 147$3,000 to $3,499
  • 439$3,500 or more
  • 176No cash rent
Time Leaving Home To Go To Work in 2022

Percentage of workers working in this county: 46.3%
Number of people working at home: 12,410 (29.3% of all workers)

Travel time (in minutes) to work in 2022

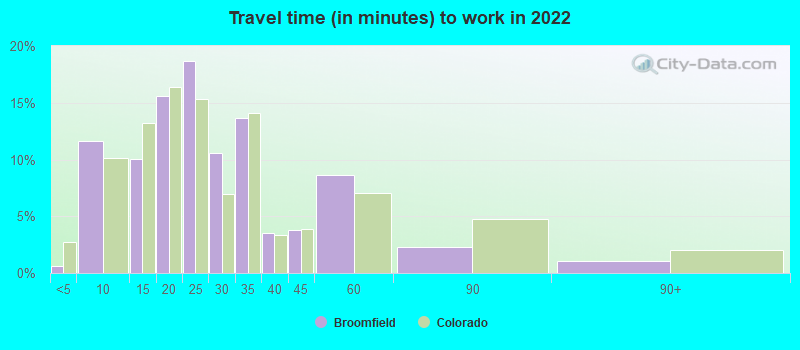
Travel time to work (commute)

  • Less than 5 minutes: 188
  • 5 to 9 minutes: 3,397
  • 10 to 14 minutes: 3,254
  • 15 to 19 minutes: 4,138
  • 20 to 24 minutes: 5,740
  • 25 to 29 minutes: 2,142
  • 30 to 34 minutes: 5,007
  • 35 to 39 minutes: 1,323
  • 40 to 44 minutes: 1,308
  • 45 to 59 minutes: 2,690
  • 60 to 89 minutes: 828
  • 90 or more minutes: 319
Means of transportation to work in 2022 - Broomfield

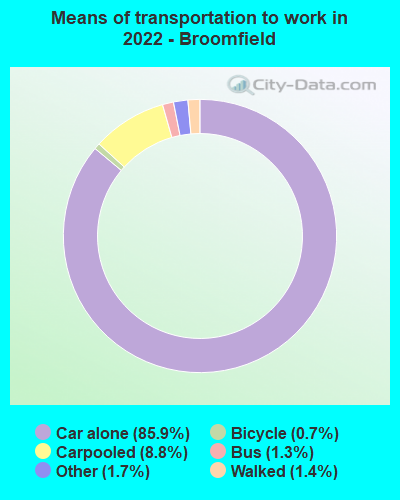
Means of transportation to work:

  • Drove a car alone: 30,366 (63.4%)
  • Carpooled: 3,040 (6.3%)
  • Bus: 501 (1.0%)
  • Long-distance train or commuter rail: 6 (0.0%)
  • Light rail, streetcar or trolley: 21 (0.0%)
  • Ferryboat: 41 (0.1%)
  • Taxi: 685 (1.4%)
  • Bicycle: 154 (0.3%)
  • Walked: 504 (1.1%)
  • Worked at home: 12,410 (25.9%)
Class of Workers in 2022
  • Unemployment by race in 2022
  • Unemployment rate for White non-Hispanic residents
  • 2.1%Males
  • 1.6%Females
  • Unemployment rate for Black residents
  • 2.8%Males
  • Unemployment rate for American Indian and Alaska Native residents
  • 14.2%Males
  • 17.0%Females
  • Unemployment rate for Asian residents
  • 0.6%Males
  • 1.1%Females
  • Unemployment rate for other race residents
  • 0.8%Females
  • Unemployment rate for two or more race residents
  • 2.4%Males
  • 1.6%Females
  • Unemployment rate for Hispanic or Latino residents
  • 3.0%Males
  • 2.6%Females
Year of entry for the foreign-born population in Broomfield, Colorado
  • Year of entry for the foreign-born population in Broomfield, Colorado
  • 1,7332010 or later
  • 2,2882000 to 2009
  • 1,7311990 to 1999
  • 5921980 to 1989
  • 4211970 to 1979
  • 343Before 1970
Ancestries in Broomfield, CO

First ancestries reported:

  • German: 4,243 (12.4%)
  • English: 3,546 (10.4%)
  • American: 2,383 (7.0%)
  • Irish: 2,247 (6.6%)
  • European: 2,137 (6.2%)
  • Italian: 1,340 (3.9%)
  • Polish: 776 (2.3%)
  • Norwegian: 495 (1.4%)
  • Scottish: 443 (1.3%)
  • Dutch: 399 (1.2%)
  • French Canadian: 379 (1.1%)
  • Swedish: 346 (1.0%)
  • Eastern European: 293 (0.9%)
  • French: 287 (0.8%)
  • British: 217 (0.6%)
  • Czech: 204 (0.6%)
  • Scotch-Irish: 201 (0.6%)
  • Scandinavian: 183 (0.5%)
  • Danish: 161 (0.5%)
  • Russian: 149 (0.4%)
  • Northern European: 145 (0.4%)
  • Hungarian: 137 (0.4%)
  • Greek: 120 (0.4%)
  • African: 118 (0.3%)
  • Iranian: 103 (0.3%)
  • Welsh: 96 (0.3%)
  • Syrian: 92 (0.3%)
  • Lebanese: 78 (0.2%)
  • Finnish: 73 (0.2%)
  • Lithuanian: 72 (0.2%)
  • Bulgarian: 70 (0.2%)
  • Swiss: 57 (0.2%)
  • Palestinian: 57 (0.2%)
  • Canadian: 54 (0.2%)
  • Ukrainian: 53 (0.2%)
  • Romanian: 52 (0.2%)
  • Iraqi: 51 (0.1%)
  • Egyptian: 51 (0.1%)
  • Jamaican: 50 (0.1%)
  • Slovak: 48 (0.1%)
  • Sudanese: 36 (0.1%)
  • Croatian: 35 (0.1%)
  • Australian: 33 (0.10%)
  • Yugoslavian: 30 (0.09%)
  • New Zealander: 28 (0.08%)
  • Brazilian: 27 (0.08%)
  • Slavic: 27 (0.08%)
  • Portuguese: 23 (0.07%)
  • Austrian: 22 (0.06%)
  • Arab: 21 (0.06%)
  • Slovene: 18 (0.05%)
  • Luxembourger: 16 (0.05%)
  • Jordanian: 14 (0.04%)
  • Assyrian: 14 (0.04%)
  • Armenian: 13 (0.04%)
  • Czechoslovakian: 12 (0.04%)
  • Belgian: 11 (0.03%)
  • Albanian: 6 (0.02%)
  • Moroccan: 4 (0.01%)

Most common places of birth for foreign-born residents (%):

Mexico
Broomfield:

21.1% (1,691)
Colorado:

38.3% (209,491)

India
Broomfield:

13.2% (1,063)
Colorado:

4.0% (21,689)

China, excluding Hong Kong and Taiwan
Broomfield:

7.6% (612)
Colorado:

3.3% (17,998)

Vietnam
Broomfield:

4.3% (348)
Colorado:

3.0% (16,616)

Canada
Broomfield:

3.9% (313)
Colorado:

2.7% (15,026)

Philippines
Broomfield:

3.8% (304)
Colorado:

2.3% (12,342)

Germany
Broomfield:

3.5% (284)
Colorado:

2.5% (13,706)

Korea
Broomfield:

2.8% (221)
Colorado:

2.9% (15,981)

Poland
Broomfield:

2.5% (200)
Colorado:

0.9% (4,772)

Nepal
Broomfield:

2.5% (197)
Colorado:

1.0% (5,214)

Iran
Broomfield:

2.1% (170)
Colorado:

0.7% (3,568)

Guatemala
Broomfield:

1.7% (133)
Colorado:

1.4% (7,898)

Place of birth for U.S.-born residents:

  • This state: 26,646
  • Other state: 39,768
  • Northeast: 7,289
  • Midwest: 13,330
  • South: 7,881
  • West: 11,268

85.4% of Broomfield residents lived in the same house 1 years ago.
   Out of people who lived in different houses, 11.7% lived in this county.
   Out of people who lived in different counties, 64.1% lived in Colorado.


Broomfield:

85.4%
State average:

83.6%

Education attainment for males 25 years and older:

  • No schooling: 0
  • Nursery to 4th grade: 189
  • 5th and 6th grade: 0
  • 7th and 8th grade: 0
  • 9th grade: 786
  • 10th grade: 43
  • 11th grade: 564
  • 12th grade, no diploma: 372
  • High school graduate (or equivalency): 2,814
  • Less than 1 year of college: 1,042
  • Some college more than 1 year, no degree: 2,692
  • Associate degree: 3,005
  • Bachelor's degree: 9,175
  • Master's degree: 4,172
  • Professional school degree: 693
  • Doctorate degree: 1,551
Educational Attainment for Males

Education attainment for females 25 years and older:

  • No schooling: 200
  • Nursery to 4th grade: 165
  • 5th and 6th grade: 0
  • 7th and 8th grade: 0
  • 9th grade: 0
  • 10th grade: 72
  • 11th grade: 263
  • 12th grade, no diploma: 492
  • High school graduate (or equivalency): 3,764
  • Less than 1 year of college: 561
  • Some college more than 1 year, no degree: 2,963
  • Associate degree: 2,923
  • Bachelor's degree: 8,870
  • Master's degree: 5,578
  • Professional school degree: 497
  • Doctorate degree: 901
Educational Attainment for Females
Broomfield marital status for males
Broomfield marital status for females

Housing units in structures:

  • One, detached: 18,602
  • One, attached: 3,396
  • 3 or 4: 415
  • 5 to 9: 1,397
  • 10 to 19: 1,783
  • 20 to 49: 2,239
  • 50 or more: 4,468
  • Mobile homes: 522

Median worth of mobile homes: $90,500

Housing units lacking complete plumbing facilities in 2022: 0.3%

Housing units lacking complete kitchen facilities in 2022: 0.8%

House/condo owner moved in on average 9 years ago

Renter moved in on average 0 years ago

Year householders moved into residence in Broomfield
Houses and condos Apartments
Most commonly used house heating fuel in houses and condos in Broomfield, CO
  • 83.4%Utility gas
  • 14.7%Electricity
  • 0.9%Bottled, tank, or LP gas
  • 0.4%Solar energy
  • 0.4%Wood
  • 0.2%No fuel used
Most commonly used house heating fuel in apartments in Broomfield, CO
  • 50.4%Utility gas
  • 46.3%Electricity
  • 2.0%Bottled, tank, or LP gas
  • 1.0%No fuel used
  • 0.3%Other fuel

Private vs. public school enrollment:

Students in private schools in grades 1 to 8 (elementary and middle school): 968
Here:

13.2%
Colorado:

11.4%

Students in private schools in grades 9 to 12 (high school): 675
Here:

15.4%
Colorado:

8.5%

Students in private undergraduate colleges: 276
Here:

12.4%
Colorado:

14.0%
School Enrollment by Level of School for Male Students
School Enrollment by Level of School for Female Students
Age and Sex of Sensory-Disabled Noninstitutionalized Residents
Age and Sex of Physically-Disabled Noninstitutionalized Residents
Age and Sex of Mentally-Disabled Noninstitutionalized Residents
Age and Sex of Self-Care Disabled Noninstitutionalized Residents
Age and Sex of Go-Outside-Home Disabled Noninstitutionalized Residents
Age and Sex of Noninstitutionalized Residents with Employment Disability