Brighton, CO (Colorado) Houses and Residents
| Brighton: | $488,430 |
| Colorado: | $531,100 |
Total population: 36,765 (Urban population: 20,342 (all inside urban clusters), Rural population: 540 (35 farm, 505 nonfarm))
Houses: 14,179 (13,839 occupied: 9,601 owner occupied, 4,308 renter occupied)
| % of renters here: | 31% |
| State: | 34% |
Housing density: 830 houses/condos per square mile
Median price asked for vacant for-sale houses and condos in 2022: $1,221,427.
Median contract rent in 2022: $1,465 (lower quartile is $1,070, upper quartile is $1,830)
Median rent asked for vacant for-rent units in 2022: $696
Median gross rent in Brighton, CO in 2022: $1,655
Housing units in Brighton with a mortgage: 7,658 (732 second mortgage, 0 home equity loan, 524 both second mortgage and home equity loan)
Houses without a mortgage: 5
Median household income for houses/condos with a mortgage: $118,954
Median household income for apartments without a mortgage: $82,722
Median monthly housing costs: $1,776
Compare current foreclosures in Brighton, CO:
| Photo | Address | Area | Beds / Baths | Price | Details |
|---|---|---|---|---|---|

|
#1
S 2nd Ave
Brighton, CO 80601
|
783 sq. feet
|
1 baths 2 beds |
show details | |

|
#2
Comanche Creek Dr
Brighton, CO 80601
|
1,879 sq. feet
|
3 baths 4 beds |
show details | |

|
#3
Mesa St
Brighton, CO 80601
|
2,373 sq. feet
|
3 baths 4 beds |
show details | |

|
#4
Lafayette St
Brighton, CO 80602
|
2,640 sq. feet
|
3 baths 6 beds |
show details | |

|
#5
Lanewood St
Brighton, CO 80603
|
1,518 sq. feet
|
2 baths 3 beds |
show details | |

|
#6
Hunter Ave
Brighton, CO 80603
|
2,863 sq. feet
|
3 baths 5 beds |
show details | |

|
#7
Windmill Dr
Brighton, CO 80601
|
1,506 sq. feet
|
2 baths 3 beds |
show details | |

|
#8
Whimsical Avenue
Brighton, CO 80603
|
2,265 sq. feet
|
2 baths 4 beds |
show details | |

|
#9
Straw Ct
Brighton, CO 80601
|
1,325 sq. feet
|
2 baths 3 beds |
show details | |

|
#10
Detroit Way
Brighton, CO 80602
|
2,638 sq. feet
|
3 baths 4 beds |
show details |
| Photo | Address | Area | Beds / Baths | Price | Details |
|---|---|---|---|---|---|

|
#11
Cedar Ave
Brighton, CO 80601
|
1,608 sq. feet
|
2 baths 3 beds |
show details | |

|
#12
Apache Plume St
Brighton, CO 80601
|
2,058 sq. feet
|
2 baths 4 beds |
show details | |

|
#13
S 3rd Ave
Brighton, CO 80601
|
1,306 sq. feet
|
2 baths 3 beds |
show details | |

|
#14
Valdai St
Brighton, CO 80603
|
1,316 sq. feet
|
2 baths 4 beds |
show details | |

|
#15
Ute Way
Brighton, CO 80603
|
1,747 sq. feet
|
2 baths 3 beds |
show details | |

|
#16
Hayloft Way
Brighton, CO 80601
|
1,620 sq. feet
|
2 baths 3 beds |
show details | |

|
#17
Mockingbird St
Brighton, CO 80601
|
1,240 sq. feet
|
2 baths 2 beds |
show details | |

|
#18
Jasmine St
Brighton, CO 80602
|
2,422 sq. feet
|
3 baths 3 beds |
show details | |

|
#19
Hematite Ln
Brighton, CO 80603
|
1,316 sq. feet
|
2 baths 3 beds |
show details | |

|
#20
Mather St
Brighton, CO 80601
|
910 sq. feet
|
1 baths 2 beds |
show details |
| Photo | Address | Area | Beds / Baths | Price | Details |
|---|---|---|---|---|---|

|
#21
Monaco St
Brighton, CO 80602
|
1,299 sq. feet
|
2 baths 3 beds |
show details | |

|
#22
Willow Ct
Brighton, CO 80603
|
1,040 sq. feet
|
2 baths 3 beds |
show details | |

|
#23
Shenandoah Way
Brighton, CO 80603
|
1,540 sq. feet
|
2 baths 4 beds |
show details | |

|
#24
Cherokee Pl
Brighton, CO 80603
|
1,440 sq. feet
|
2 baths 3 beds |
show details | |

|
#25
N 8th Ave
Brighton, CO 80601
|
950 sq. feet
|
1 baths 3 beds |
show details | |

|
#26
Locust Ave
Brighton, CO 80603
|
- sq. feet
|
2 baths 3 beds |
show details | |

|
#27
N 4th Ave
Brighton, CO 80601
|
1,040 sq. feet
|
1 baths 3 beds |
show details | |

|
#28
E 121st Dr
Brighton, CO 80602
|
1,476 sq. feet
|
2 baths 3 beds |
show details | |

|
#29
E 140th Pl
Brighton, CO 80602
|
1,711 sq. feet
|
2 baths 3 beds |
show details | |

|
#30
Eudora St
Brighton, CO 80602
|
2,146 sq. feet
|
3 baths 4 beds |
show details |
| Photo | Address | Area | Beds / Baths | Price | Details |
|---|---|---|---|---|---|

|
#31
Montezuma St
Brighton, CO 80601
|
1,575 sq. feet
|
2 baths 3 beds |
show details | |

|
#32
Killdeer St
Brighton, CO 80601
|
1,421 sq. feet
|
3 baths 3 beds |
show details | |

|
#33
S 12th Ave
Brighton, CO 80601
|
2,141 sq. feet
|
3 baths 4 beds |
show details | |

|
#34
Purcell St
Brighton, CO 80601
|
3,508 sq. feet
|
3 baths 4 beds |
show details | |

|
#35
S 3rd Ave
Brighton, CO 80601
|
3,140 sq. feet
|
2 baths 5 beds |
show details | |

|
#36
Locust St
Brighton, CO 80602
|
1,192 sq. feet
|
3 baths 2 beds |
show details | |

|
#37
S 12th Ave
Brighton, CO 80601
|
672 sq. feet
|
1 baths 2 beds |
show details | |

|
#38
Voiles Dr
Brighton, CO 80601
|
2,024 sq. feet
|
2 baths 3 beds |
show details | |

|
#39
Midland Pl
Brighton, CO 80601
|
3,936 sq. feet
|
6 baths 9 beds |
show details | |

|
#40
County Road 2
Brighton, CO 80603
|
3,054 sq. feet
|
3 baths 6 beds |
show details |
| Photo | Address | Area | Beds / Baths | Price | Details |
|---|---|---|---|---|---|

|
#41
Bently St
Brighton, CO 80603
|
2,543 sq. feet
|
3 baths 4 beds |
show details | |

|
#42
Lafayette St
Brighton, CO 80602
|
2,185 sq. feet
|
3 baths 4 beds |
show details | |

|
#43
E 123rd Ave
Brighton, CO 80602
|
1,356 sq. feet
|
3 baths 3 beds |
show details | |

|
#44
Elm Ave
Brighton, CO 80601
|
1,296 sq. feet
|
1 baths 3 beds |
show details | |

|
#45
Skeel St
Brighton, CO 80601
|
2,055 sq. feet
|
3 baths 4 beds |
show details | |

|
#46
Electra St
Brighton, CO 80603
|
2,310 sq. feet
|
3 baths 4 beds |
show details | |

|
#47
N 8th Ct
Brighton, CO 80601
|
1,828 sq. feet
|
2 baths 3 beds |
show details | |

|
#48
N 10th Ave
Brighton, CO 80601
|
1,120 sq. feet
|
1 baths 2 beds |
show details | |

|
#49
E 145th Pl
Brighton, CO 80602
|
2,271 sq. feet
|
3 baths 4 beds |
show details | |

|
Check over 1 million property listings on Foreclosure.com!
|
browse all offers | |||

Latest news about housing in Brighton, CO collected exclusively by city-data.com from local newspapers, TV, and radio stations

 | Houses in Thornton, Brighton, and maybe Erie? (7 replies) |
| Buy a House in Greeley or Condo in Westminster (16 replies) |
| Aurora - good areas to buy home -- and areas to avoid (20 replies) |
| Commuting Brighton to Boulder (2 replies) |
| Potential Suburbs to move to (36 replies) |
| New home construction and square footage (51 replies) |

Median year apartment built: 1996
Household type by relationship:
Households: 41,148- Male householders: 6,396 (1,311 living alone), Female householders: 7,013 (1,639 living alone)
7,561 spouses (7,514 opposite-sex spouses), 789 unmarried partners, (754 opposite-sex unmarried partners), 13,832 children (12,740 natural, 433 adopted, 659 stepchildren), 1,077 grandchildren, 409 brothers or sisters, 821 parents, 0 foster children, 878 other relatives, 1,158 non-relatives
- In group quarters: 1,210
Size of family households: 3,350 2-persons, 2,348 3-persons, 2,277 4-persons, 1,202 5-persons, 503 6-persons, 304 7-or-more-persons.
Size of nonfamily households: 3,060 1-person, 493 2-persons, 182 3-persons, 43 4-persons, 72 5-persons.
6,948 married couples with children.
2,406 single-parent households (390 men, 2,016 women).
78.2% of residents of Brighton speak English at home.
20.1% of residents speak Spanish at home (73% speak English very well, 15% speak English well, 7% speak English not well, 4% don't speak English at all).
0.8% of residents speak other Indo-European language at home (63% speak English very well, 31% speak English well, 6% speak English not well).
1.0% of residents speak Asian or Pacific Island language at home (66% speak English very well, 29% speak English well, 5% speak English not well).
0.3% of residents speak other language at home (79% speak English very well, 15% speak English well, 6% speak English not well).
Foreign born population: 3,393 (8.2%)
(49.9% of them are naturalized citizens)
| Here: | 6.7 |
| State: | 6.8 |
| Here: | 4.3 |
| State: | 4.0 |

- Bedrooms in owner-occupied houses and condos in Brighton, Colorado
- 38no bedroom
- 851 bedroom
- 1,4302 bedrooms
- 4,3233 bedrooms
- 2,6954 bedrooms
- 1,0305+ bedrooms

- Bedrooms in renter-occupied apartments in Brighton, Colorado
- 97no bedroom
- 9991 bedroom
- 1,5502 bedrooms
- 1,2493 bedrooms
- 3724 bedrooms
- 415+ bedrooms

- Cars and other vehicles available in Brighton in owner-occupied houses/condos
- 96no vehicle
- 1,7991 vehicle
- 3,5782 vehicles
- 2,4843 vehicles
- 1,2094 vehicles
- 4365+ vehicles

- Cars and other vehicles available in Brighton in renter-occupied apartments
- 264no vehicle
- 1,8051 vehicle
- 1,4592 vehicles
- 6393 vehicles
- 1034 vehicles
- 385+ vehicles

- Rooms in owner-occupied houses in Brighton, Colorado
- 201 room
- 02 rooms
- 1353 rooms
- 9054 rooms
- 1,8375 rooms
- 1,8846 rooms
- 1,0797 rooms
- 1,6178 rooms
- 2,1249+ rooms

- Rooms in renter-occupied apartments in Brighton, Colorado
- 971 room
- 2792 rooms
- 6543 rooms
- 1,3454 rooms
- 7895 rooms
- 7276 rooms
- 1567 rooms
- 1368 rooms
- 1269+ rooms


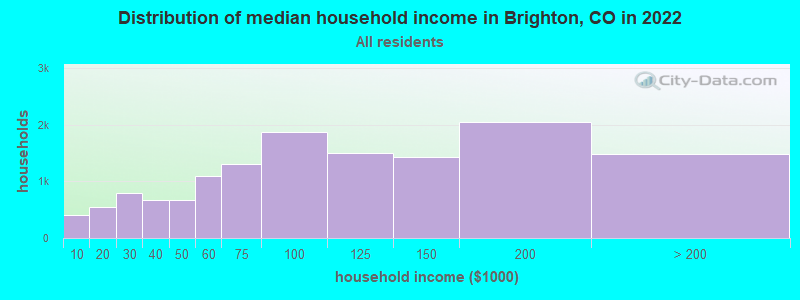
Brighton, CO household income distribution

- 409Less than $10,000
- 555$10,000 to $19,999
- 794$20,000 to $29,999
- 675$30,000 to $39,999
- 674$40,000 to $49,999
- 1,097$50,000 to $59,999
- 1,298$60,000 to $74,999
- 1,866$75,000 to $99,999
- 1,493$100,000 to $124,999
- 1,422$125,000 to $149,999
- 2,045$150,000 to $199,999
- 1,489$200,000 or more
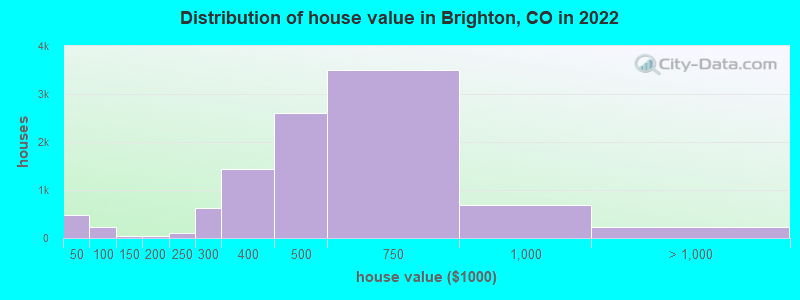
Home value of owner - occupied houses in 2022 in Brighton, CO
-
- 27Less than $10,000
- 34$10,000 to $14,999
- 18$15,000 to $19,999
- 66$20,000 to $24,999
- 145$25,000 to $29,999
- 39$30,000 to $34,999
- 23$35,000 to $39,999
- 122$40,000 to $49,999
- 11$50,000 to $59,999
- 15$60,000 to $69,999
- 44$70,000 to $79,999
- 15$80,000 to $89,999
- 11$90,000 to $99,999
- 16$100,000 to $124,999
- 30$125,000 to $149,999
- 21$150,000 to $174,999
- 19$175,000 to $199,999
- 111$200,000 to $249,999
- 617$250,000 to $299,999
- 1,445$300,000 to $399,999
- 2,607$400,000 to $499,999
- 3,502$500,000 to $749,999
- 693$750,000 to $999,999
- 89$1,000,000 to $1,499,999
- 58$1,500,000 to $1,999,999
- 83$2,000,000 or more
Rent paid by renters in 2022 in Brighton, CO
-
- 19$100 to $149
- 115$150 to $199
- 5$200 to $249
- 30$250 to $299
- 106$300 to $349
- 14$450 to $499
- 35$500 to $549
- 52$550 to $599
- 170$650 to $699
- 39$700 to $749
- 14$750 to $799
- 196$800 to $899
- 188$900 to $999
- 440$1,000 to $1,249
- 796$1,250 to $1,499
- 1,238$1,500 to $1,999
- 423$2,000 to $2,499
- 98$2,500 to $2,999
- 25$3,000 to $3,499
- 68No cash rent


Percentage of workers working in this county: 60.0%
Number of people working at home: 2,563 (12.0% of all workers)
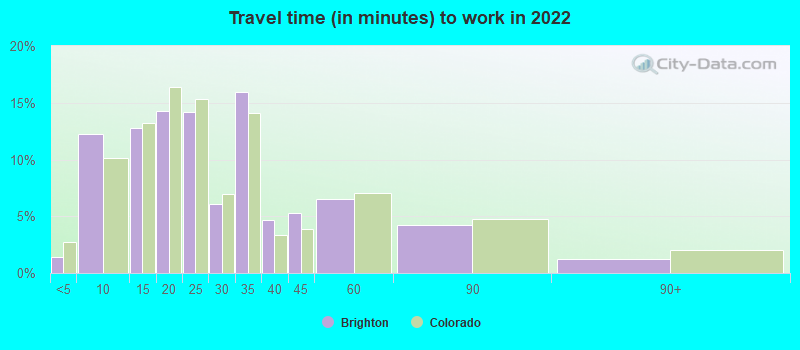
Travel time to work (commute)
- Less than 5 minutes: 133
- 5 to 9 minutes: 1,916
- 10 to 14 minutes: 1,747
- 15 to 19 minutes: 2,066
- 20 to 24 minutes: 1,682
- 25 to 29 minutes: 930
- 30 to 34 minutes: 3,801
- 35 to 39 minutes: 457
- 40 to 44 minutes: 1,544
- 45 to 59 minutes: 2,109
- 60 to 89 minutes: 1,247
- 90 or more minutes: 511
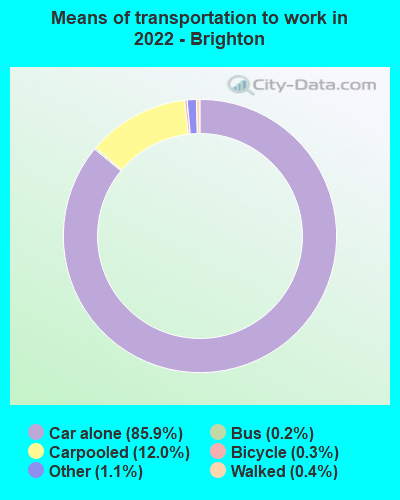
Means of transportation to work:
- Drove a car alone: 13,140 (72.2%)
- Carpooled: 1,957 (10.7%)
- Bus: 22 (0.1%)
- Taxi: 162 (0.9%)
- Bicycle: 40 (0.2%)
- Walked: 52 (0.3%)
- Worked at home: 2,563 (14.1%)

- Unemployment by race in 2022
- Unemployment rate for White non-Hispanic residents
- 1.3%Males
- 3.8%Females
- Unemployment rate for Black residents
- 8.6%Males
- 9.8%Females
- Unemployment rate for other race residents
- 18.4%Males
- 6.4%Females
- Unemployment rate for two or more race residents
- 7.3%Males
- 1.7%Females
- Unemployment rate for Hispanic or Latino residents
- 7.9%Males
- 3.0%Females

- Year of entry for the foreign-born population in Brighton, Colorado
- 4712010 or later
- 1,0422000 to 2009
- 1,1221990 to 1999
- 6321980 to 1989
- 3611970 to 1979
- 293Before 1970

First ancestries reported:
- German: 2,506 (12.0%)
- American: 1,452 (7.0%)
- Irish: 903 (4.3%)
- English: 750 (3.6%)
- Italian: 443 (2.1%)
- European: 351 (1.7%)
- Scottish: 162 (0.8%)
- Swedish: 148 (0.7%)
- Norwegian: 145 (0.7%)
- French: 138 (0.7%)
- Polish: 128 (0.6%)
- Scotch-Irish: 110 (0.5%)
- Northern European: 103 (0.5%)
- Russian: 93 (0.4%)
- Eastern European: 78 (0.4%)
- Armenian: 68 (0.3%)
- Dutch: 66 (0.3%)
- Belgian: 56 (0.3%)
- Bulgarian: 47 (0.2%)
- Swiss: 45 (0.2%)
- Welsh: 36 (0.2%)
- Hungarian: 34 (0.2%)
- Czech: 32 (0.2%)
- Danish: 28 (0.1%)
- Portuguese: 27 (0.1%)
- Croatian: 21 (0.1%)
- Canadian: 19 (0.09%)
- French Canadian: 18 (0.09%)
- Arab: 15 (0.07%)
- British: 14 (0.07%)
- Scandinavian: 11 (0.05%)
- Czechoslovakian: 11 (0.05%)
- Nigerian: 9 (0.04%)
- South African: 7 (0.03%)
- Yugoslavian: 6 (0.03%)
- German Russian: 4 (0.02%)
- Australian: 2 (0.01%)
- Jamaican: 2 (0.01%)
Most common places of birth for foreign-born residents (%):
| Brighton: | 74.2% (2,531) |
| Colorado: | 38.3% (209,491) |
| Brighton: | 2.3% (78) |
| Colorado: | 2.7% (15,026) |
| Brighton: | 2.2% (74) |
| Colorado: | 0.2% (968) |
| Brighton: | 2.0% (67) |
| Colorado: | 3.0% (16,616) |
| Brighton: | 1.9% (64) |
| Colorado: | 4.0% (21,689) |
| Brighton: | 1.7% (59) |
| Colorado: | 2.3% (12,342) |
Place of birth for U.S.-born residents:
- This state: 23,127
- Other state: 13,983
- Northeast: 986
- Midwest: 4,288
- South: 3,142
- West: 5,566
89.9% of Brighton residents lived in the same house 1 years ago.
Out of people who lived in different houses, 29.1% lived in this county.
Out of people who lived in different counties, 78.8% lived in Colorado.
| Brighton: | 89.9% |
| State average: | 83.6% |
Education attainment for males 25 years and older:
- No schooling: 400
- Nursery to 4th grade: 87
- 5th and 6th grade: 87
- 7th and 8th grade: 61
- 9th grade: 211
- 10th grade: 320
- 11th grade: 331
- 12th grade, no diploma: 914
- High school graduate (or equivalency): 4,449
- Less than 1 year of college: 918
- Some college more than 1 year, no degree: 1,744
- Associate degree: 1,386
- Bachelor's degree: 1,831
- Master's degree: 479
- Professional school degree: 140
- Doctorate degree: 195

Education attainment for females 25 years and older:
- No schooling: 376
- Nursery to 4th grade: 48
- 5th and 6th grade: 60
- 7th and 8th grade: 130
- 9th grade: 160
- 10th grade: 94
- 11th grade: 451
- 12th grade, no diploma: 335
- High school graduate (or equivalency): 4,181
- Less than 1 year of college: 845
- Some college more than 1 year, no degree: 2,023
- Associate degree: 1,159
- Bachelor's degree: 2,427
- Master's degree: 1,195
- Professional school degree: 26
- Doctorate degree: 84


Housing units in structures:
- One, detached: 9,758
- One, attached: 1,303
- Two: 206
- 3 or 4: 366
- 5 to 9: 664
- 10 to 19: 546
- 20 to 49: 587
- 50 or more: 376
- Mobile homes: 370
Median worth of mobile homes: $45,702
Housing units lacking complete kitchen facilities in 2022: 1.0%
House/condo owner moved in on average 8 years ago
Renter moved in on average 4 years ago

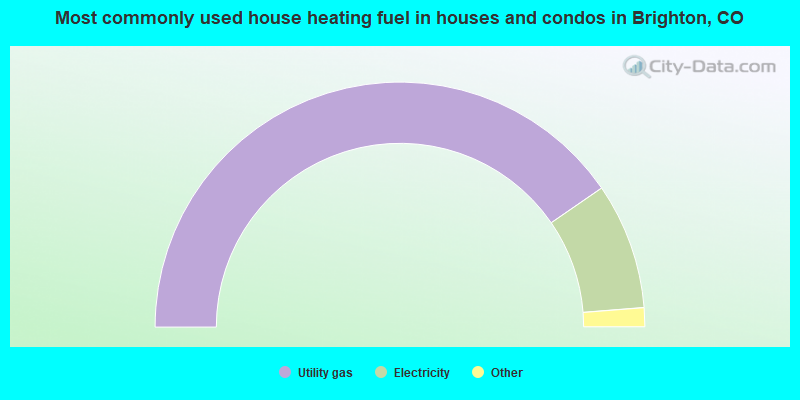
- 80.8%Utility gas
- 16.7%Electricity
- 1.2%Solar energy
- 0.9%Bottled, tank, or LP gas
- 0.5%Wood
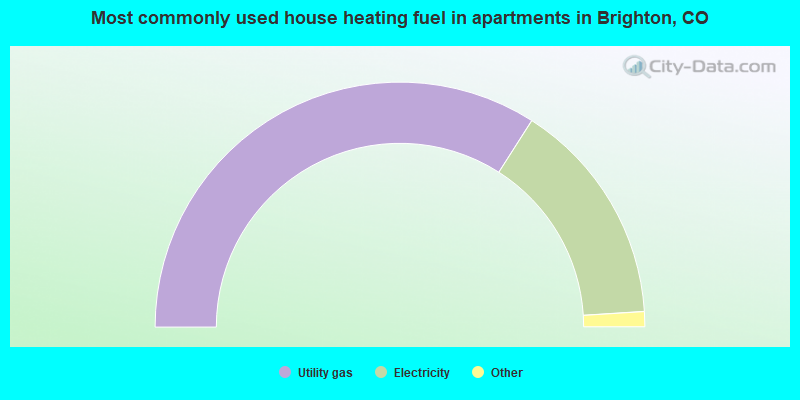
- 68.1%Utility gas
- 29.9%Electricity
- 1.2%Bottled, tank, or LP gas
- 0.4%Other fuel
- 0.3%No fuel used
Private vs. public school enrollment:
| Here: | 4.8% |
| Colorado: | 11.4% |
| Here: | 11.1% |
| Colorado: | 8.5% |
| Here: | 16.9% |
| Colorado: | 14.0% |


